
Key Insights
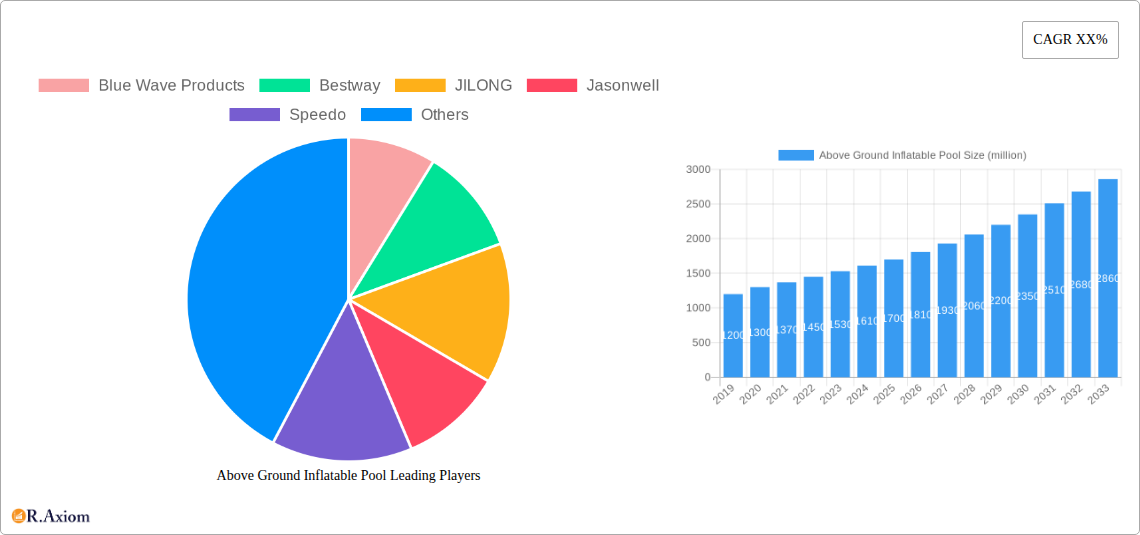
The global Above Ground Inflatable Pool market is poised for significant expansion, with an estimated market size of approximately $1.5 billion in 2025. This growth is projected to continue at a robust Compound Annual Growth Rate (CAGR) of 7.5% through 2033, leading to a market valuation of roughly $2.5 billion by the forecast period's end. This impressive trajectory is fueled by a confluence of factors, most notably the increasing demand for accessible and affordable recreational solutions for homes and gardens. The convenience of setup and storage, coupled with evolving consumer lifestyles that prioritize leisure and family time, are major drivers. Furthermore, innovations in material technology and design are enhancing durability and aesthetic appeal, making inflatable pools a more attractive alternative to traditional structures. The market's expansion is also supported by rising disposable incomes in emerging economies and a growing awareness of the health benefits associated with swimming and water-based activities.
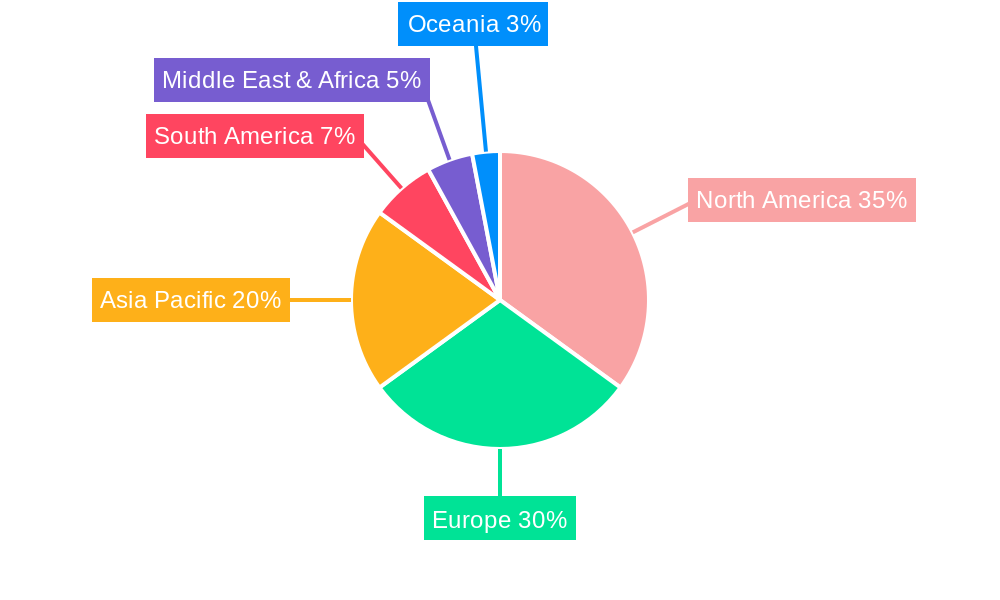
The market's segmentation reveals distinct growth opportunities within both residential and commercial applications, with the "Home" application segment anticipated to dominate due to widespread consumer adoption. Within the "Types" segment, both "Adult" and "Child" pools are experiencing healthy demand, reflecting a broad demographic appeal. Geographically, the Asia Pacific region is expected to exhibit the fastest growth, driven by a burgeoning middle class and increasing urbanization, leading to a greater need for space-saving leisure options. North America and Europe, established markets, will continue to contribute significantly due to strong consumer spending power and a well-entrenched culture of outdoor recreation. Key players such as Intex Recreation, Bestway, and Blue Wave Products are at the forefront, investing in product development and market penetration strategies. While the market enjoys strong tailwinds, potential restraints such as seasonal demand fluctuations and competition from other recreational activities warrant strategic consideration for sustained long-term success.
This in-depth report provides an exhaustive analysis of the global Above Ground Inflatable Pool market, meticulously covering the historical period from 2019 to 2024 and offering robust forecasts for the period 2025 to 2033, with the base and estimated year set at 2025. The report delves into market concentration, innovation drivers, regulatory landscapes, product substitutes, end-user trends, and merger and acquisition (M&A) activities, alongside exploring prevailing industry trends, dominant markets, crucial growth drivers, and significant challenges. With a focus on actionable insights, this study aims to equip industry stakeholders, investors, and manufacturers with the critical data needed to navigate this dynamic and expanding sector.
Above Ground Inflatable Pool Market Concentration & Innovation
The global Above Ground Inflatable Pool market exhibits a moderate level of concentration, with key players like Intex Recreation, Bestway, and Blue Wave Products holding substantial market shares, estimated to be in the range of 15-20% collectively. Innovation is a critical driver, fueled by advancements in material science for enhanced durability and safety, alongside the integration of smart features such as integrated filtration systems and remote control functionalities. Regulatory frameworks, particularly concerning child safety standards and environmental disposal, are becoming increasingly stringent, influencing product design and manufacturing processes. Product substitutes, including permanent above-ground pools and smaller kiddie pools, pose a competitive threat, though inflatable pools offer distinct advantages in portability and affordability. End-user trends are leaning towards convenience, quick setup, and family-oriented entertainment, leading to larger pool sizes and enhanced features. M&A activities in the historical period (2019-2024) have been relatively moderate, with deal values primarily in the tens of millions, focused on consolidating market share and acquiring innovative technologies. Looking ahead, continued investment in research and development for eco-friendly materials and user-friendly designs will be paramount for sustained growth.
Above Ground Inflatable Pool Industry Trends & Insights
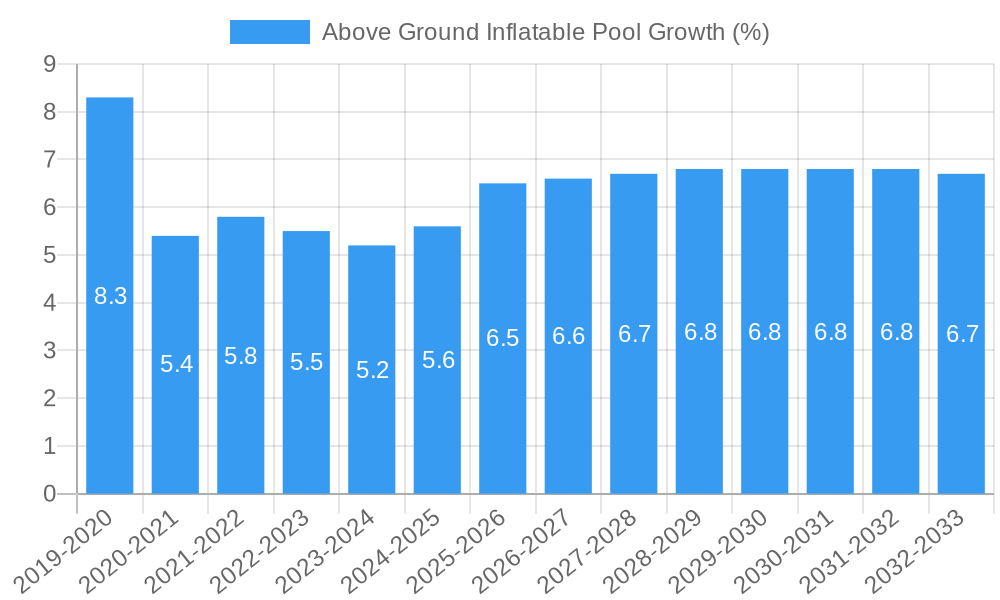
The Above Ground Inflatable Pool industry is poised for significant growth, driven by a confluence of factors including rising disposable incomes, a growing emphasis on outdoor leisure activities, and the increasing popularity of staycations. The market penetration of above-ground inflatable pools is projected to escalate, with a Compound Annual Growth Rate (CAGR) estimated at 6.5% during the forecast period (2025-2033). Technological disruptions are playing a crucial role, with advancements in manufacturing techniques leading to more robust and aesthetically pleasing designs. The incorporation of UV-resistant materials, improved pump and filter systems, and ease of assembly are becoming standard features, directly influencing consumer purchasing decisions. Consumer preferences are increasingly shifting towards user-friendly, quick-setup options that offer a cost-effective alternative to traditional swimming pools. The demand for larger family-sized inflatable pools and those with integrated accessories like loungers and shade covers is on the rise. Competitive dynamics are characterized by intense price competition and a constant drive for product differentiation. Companies are investing heavily in marketing and branding to capture a larger share of the expanding market. The resurgence of interest in home-based recreational activities, amplified by global events in recent years, has further propelled the demand for accessible and enjoyable backyard amenities. The market's resilience and adaptability to evolving consumer needs underscore its strong growth trajectory.
Dominant Markets & Segments in Above Ground Inflatable Pool
The Home application segment is the undisputed leader in the Above Ground Inflatable Pool market, driven by factors such as increased urbanization, smaller backyard sizes, and a desire for personal recreational spaces. The economic policies favoring disposable income growth in developed and emerging economies directly translate into higher consumer spending on home-based leisure products. Infrastructure development, while more relevant to in-ground pools, indirectly supports the demand for above-ground options by enhancing overall suburban and urban living appeal. In the Adult type segment, the dominance is fueled by a growing awareness of the health benefits of swimming, stress relief, and the desire for personal fitness solutions. The convenience of setting up and dismantling these pools for seasonal use is a significant draw. The Child type segment is a massive and consistently growing market, driven by parental emphasis on child development, safety, and providing engaging outdoor activities. The affordability and accessibility of child-sized inflatable pools make them a staple for families worldwide. Geographically, North America and Europe currently hold the largest market shares due to established recreational spending habits and favorable climate conditions for pool usage. However, the Asia-Pacific region, particularly China and Southeast Asian countries, is exhibiting the fastest growth, propelled by a burgeoning middle class, increasing disposable incomes, and a growing adoption of Western leisure trends. Government initiatives promoting outdoor activities and family well-being further contribute to the expansion of these dominant markets.
Above Ground Inflatable Pool Product Developments
Product developments in the Above Ground Inflatable Pool sector are increasingly focused on enhancing user experience and durability. Innovations include advanced interlocking frame designs for greater stability, integrated LED lighting for evening ambiance, and multi-layer PVC materials for superior puncture resistance. Many manufacturers are also introducing eco-friendly options, utilizing recycled materials and more sustainable production processes. The competitive advantage lies in offering a blend of affordability, ease of use, and aesthetic appeal, catering to diverse consumer needs from small backyard splash pools for children to larger family-sized models for recreation and exercise.
Report Scope & Segmentation Analysis
This report meticulously segments the Above Ground Inflatable Pool market across key dimensions to provide granular insights. The Home application segment is projected to exhibit robust growth, driven by increasing consumer spending on backyard amenities and the demand for personal recreational spaces. Market size for this segment is estimated to be in the hundreds of millions. The Commercial application segment, while smaller, presents opportunities in temporary event setups, resorts, and recreational centers, with projected growth tied to the tourism and events industry. The Adult type segment is experiencing sustained demand due to its dual purpose of recreation and fitness, with market penetration expected to rise steadily. The Child type segment remains a cornerstone of the market, with consistent demand driven by family-oriented purchasing decisions and child safety features. Competitive dynamics within each segment vary, with a focus on product features, pricing, and brand reputation.
Key Drivers of Above Ground Inflatable Pool Growth
Several key drivers are propelling the growth of the Above Ground Inflatable Pool market. Technologically, advancements in material science have led to more durable, puncture-resistant, and UV-stable inflatable pools, enhancing their lifespan and appeal. Economically, rising disposable incomes globally, particularly in emerging economies, have increased consumer spending power on leisure and recreational products. The trend of "staycations" and increased focus on home-based entertainment further fuels demand. Regulatory bodies are also indirectly supporting growth by setting safety standards that encourage manufacturers to produce higher-quality, safer products. The increasing adoption of online retail channels has also made these pools more accessible to a wider consumer base.
Challenges in the Above Ground Inflatable Pool Sector
Despite the positive growth trajectory, the Above Ground Inflatable Pool sector faces several challenges. Regulatory hurdles, particularly those related to safety certifications and environmental impact assessments, can increase manufacturing costs and complexity. Supply chain disruptions, as witnessed in recent years, can lead to material shortages and increased lead times, impacting production and delivery schedules. Intense competitive pressures, especially from lower-cost manufacturers, can squeeze profit margins. Furthermore, consumer concerns regarding the longevity and potential for leaks in some inflatable pool models can act as a restraint, although technological advancements are steadily addressing these issues. The availability and cost of accessories, such as pumps and filters, also play a role in the overall consumer investment.
Emerging Opportunities in Above Ground Inflatable Pool
Emerging opportunities within the Above Ground Inflatable Pool market are multifaceted. The development of smart inflatable pools with integrated filtration and heating systems presents a significant avenue for innovation and premium pricing. The growing consumer interest in sustainable and eco-friendly products is driving demand for inflatable pools made from recycled materials and employing greener manufacturing processes. Expansion into emerging markets in regions like Southeast Asia and Latin America, where disposable incomes are rising and the concept of backyard leisure is gaining traction, offers substantial growth potential. Furthermore, partnerships with hospitality and event management companies for temporary pool installations present a lucrative commercial application avenue.
Leading Players in the Above Ground Inflatable Pool Market
The leading players in the Above Ground Inflatable Pool market include:
- Blue Wave Products
- Bestway
- JILONG
- Jasonwell
- Speedo
- Decathlon
- Intex Recreation
- Mizukami Kinzoki
- Summer Escapes Swimming Pools
- Aquafun.in
- Aierinflatable Yiwu Tuozhan
- Mojena Ground Pool
- Homech
- Sunnylife
- MINNIDIP
Key Developments in Above Ground Inflatable Pool Industry
- 2024: Launch of enhanced UV-resistant materials by several manufacturers, increasing pool lifespan by an estimated 20%.
- 2023: Introduction of smart inflatable pools with integrated Wi-Fi connectivity and app control for filtration and temperature management.
- 2022: Increased focus on child safety features, including advanced locking mechanisms and integrated safety warnings.
- 2021: Emergence of eco-friendly inflatable pools utilizing recycled PVC and sustainable packaging solutions.
- 2020: Significant surge in demand due to increased focus on home-based leisure activities and staycations.
- 2019: Expansion of product lines to include larger family-sized inflatable pools with integrated accessories.
Strategic Outlook for Above Ground Inflatable Pool Market
The strategic outlook for the Above Ground Inflatable Pool market is exceptionally positive, underpinned by sustained consumer demand for accessible and enjoyable outdoor recreational solutions. The industry's ability to innovate, particularly in areas of enhanced durability, smart technology integration, and environmental sustainability, will be crucial for capturing future growth. Expansion into untapped geographical markets and strategic partnerships will further solidify market positions. The ongoing trend towards prioritizing home-based leisure and well-being ensures a robust demand pipeline. Companies that can effectively balance affordability with advanced features and eco-conscious practices are best positioned for long-term success in this dynamic market.
Above Ground Inflatable Pool Segmentation
-
1. Application
- 1.1. Home
- 1.2. Commercial
-
2. Types
- 2.1. Adult
- 2.2. Child
Above Ground Inflatable Pool Segmentation By Geography
-
1. North America
- 1.1. United States
- 1.2. Canada
- 1.3. Mexico
-
2. South America
- 2.1. Brazil
- 2.2. Argentina
- 2.3. Rest of South America
-
3. Europe
- 3.1. United Kingdom
- 3.2. Germany
- 3.3. France
- 3.4. Italy
- 3.5. Spain
- 3.6. Russia
- 3.7. Benelux
- 3.8. Nordics
- 3.9. Rest of Europe
-
4. Middle East & Africa
- 4.1. Turkey
- 4.2. Israel
- 4.3. GCC
- 4.4. North Africa
- 4.5. South Africa
- 4.6. Rest of Middle East & Africa
-
5. Asia Pacific
- 5.1. China
- 5.2. India
- 5.3. Japan
- 5.4. South Korea
- 5.5. ASEAN
- 5.6. Oceania
- 5.7. Rest of Asia Pacific
Above Ground Inflatable Pool REPORT HIGHLIGHTS
| Aspects | Details |
|---|---|
| Study Period | 2019-2033 |
| Base Year | 2024 |
| Estimated Year | 2025 |
| Forecast Period | 2025-2033 |
| Historical Period | 2019-2024 |
| Growth Rate | CAGR of XX% from 2019-2033 |
| Segmentation |
|
Table of Contents
- 1. Introduction
- 1.1. Research Scope
- 1.2. Market Segmentation
- 1.3. Research Methodology
- 1.4. Definitions and Assumptions
- 2. Executive Summary
- 2.1. Introduction
- 3. Market Dynamics
- 3.1. Introduction
- 3.2. Market Drivers
- 3.3. Market Restrains
- 3.4. Market Trends
- 4. Market Factor Analysis
- 4.1. Porters Five Forces
- 4.2. Supply/Value Chain
- 4.3. PESTEL analysis
- 4.4. Market Entropy
- 4.5. Patent/Trademark Analysis
- 5. Global Above Ground Inflatable Pool Analysis, Insights and Forecast, 2019-2031
- 5.1. Market Analysis, Insights and Forecast - by Application
- 5.1.1. Home
- 5.1.2. Commercial
- 5.2. Market Analysis, Insights and Forecast - by Types
- 5.2.1. Adult
- 5.2.2. Child
- 5.3. Market Analysis, Insights and Forecast - by Region
- 5.3.1. North America
- 5.3.2. South America
- 5.3.3. Europe
- 5.3.4. Middle East & Africa
- 5.3.5. Asia Pacific
- 5.1. Market Analysis, Insights and Forecast - by Application
- 6. North America Above Ground Inflatable Pool Analysis, Insights and Forecast, 2019-2031
- 6.1. Market Analysis, Insights and Forecast - by Application
- 6.1.1. Home
- 6.1.2. Commercial
- 6.2. Market Analysis, Insights and Forecast - by Types
- 6.2.1. Adult
- 6.2.2. Child
- 6.1. Market Analysis, Insights and Forecast - by Application
- 7. South America Above Ground Inflatable Pool Analysis, Insights and Forecast, 2019-2031
- 7.1. Market Analysis, Insights and Forecast - by Application
- 7.1.1. Home
- 7.1.2. Commercial
- 7.2. Market Analysis, Insights and Forecast - by Types
- 7.2.1. Adult
- 7.2.2. Child
- 7.1. Market Analysis, Insights and Forecast - by Application
- 8. Europe Above Ground Inflatable Pool Analysis, Insights and Forecast, 2019-2031
- 8.1. Market Analysis, Insights and Forecast - by Application
- 8.1.1. Home
- 8.1.2. Commercial
- 8.2. Market Analysis, Insights and Forecast - by Types
- 8.2.1. Adult
- 8.2.2. Child
- 8.1. Market Analysis, Insights and Forecast - by Application
- 9. Middle East & Africa Above Ground Inflatable Pool Analysis, Insights and Forecast, 2019-2031
- 9.1. Market Analysis, Insights and Forecast - by Application
- 9.1.1. Home
- 9.1.2. Commercial
- 9.2. Market Analysis, Insights and Forecast - by Types
- 9.2.1. Adult
- 9.2.2. Child
- 9.1. Market Analysis, Insights and Forecast - by Application
- 10. Asia Pacific Above Ground Inflatable Pool Analysis, Insights and Forecast, 2019-2031
- 10.1. Market Analysis, Insights and Forecast - by Application
- 10.1.1. Home
- 10.1.2. Commercial
- 10.2. Market Analysis, Insights and Forecast - by Types
- 10.2.1. Adult
- 10.2.2. Child
- 10.1. Market Analysis, Insights and Forecast - by Application
- 11. Competitive Analysis
- 11.1. Global Market Share Analysis 2024
- 11.2. Company Profiles
- 11.2.1 Blue Wave Products
- 11.2.1.1. Overview
- 11.2.1.2. Products
- 11.2.1.3. SWOT Analysis
- 11.2.1.4. Recent Developments
- 11.2.1.5. Financials (Based on Availability)
- 11.2.2 Bestway
- 11.2.2.1. Overview
- 11.2.2.2. Products
- 11.2.2.3. SWOT Analysis
- 11.2.2.4. Recent Developments
- 11.2.2.5. Financials (Based on Availability)
- 11.2.3 JILONG
- 11.2.3.1. Overview
- 11.2.3.2. Products
- 11.2.3.3. SWOT Analysis
- 11.2.3.4. Recent Developments
- 11.2.3.5. Financials (Based on Availability)
- 11.2.4 Jasonwell
- 11.2.4.1. Overview
- 11.2.4.2. Products
- 11.2.4.3. SWOT Analysis
- 11.2.4.4. Recent Developments
- 11.2.4.5. Financials (Based on Availability)
- 11.2.5 Speedo
- 11.2.5.1. Overview
- 11.2.5.2. Products
- 11.2.5.3. SWOT Analysis
- 11.2.5.4. Recent Developments
- 11.2.5.5. Financials (Based on Availability)
- 11.2.6 Decathlon
- 11.2.6.1. Overview
- 11.2.6.2. Products
- 11.2.6.3. SWOT Analysis
- 11.2.6.4. Recent Developments
- 11.2.6.5. Financials (Based on Availability)
- 11.2.7 Intex Recreation
- 11.2.7.1. Overview
- 11.2.7.2. Products
- 11.2.7.3. SWOT Analysis
- 11.2.7.4. Recent Developments
- 11.2.7.5. Financials (Based on Availability)
- 11.2.8 Mizukami Kinzoki
- 11.2.8.1. Overview
- 11.2.8.2. Products
- 11.2.8.3. SWOT Analysis
- 11.2.8.4. Recent Developments
- 11.2.8.5. Financials (Based on Availability)
- 11.2.9 Summer Escapes Swimming Pools
- 11.2.9.1. Overview
- 11.2.9.2. Products
- 11.2.9.3. SWOT Analysis
- 11.2.9.4. Recent Developments
- 11.2.9.5. Financials (Based on Availability)
- 11.2.10 Aquafun.in
- 11.2.10.1. Overview
- 11.2.10.2. Products
- 11.2.10.3. SWOT Analysis
- 11.2.10.4. Recent Developments
- 11.2.10.5. Financials (Based on Availability)
- 11.2.11 Aierinflatable Yiwu Tuozhan
- 11.2.11.1. Overview
- 11.2.11.2. Products
- 11.2.11.3. SWOT Analysis
- 11.2.11.4. Recent Developments
- 11.2.11.5. Financials (Based on Availability)
- 11.2.12 Mojena Ground Pool
- 11.2.12.1. Overview
- 11.2.12.2. Products
- 11.2.12.3. SWOT Analysis
- 11.2.12.4. Recent Developments
- 11.2.12.5. Financials (Based on Availability)
- 11.2.13 Homech
- 11.2.13.1. Overview
- 11.2.13.2. Products
- 11.2.13.3. SWOT Analysis
- 11.2.13.4. Recent Developments
- 11.2.13.5. Financials (Based on Availability)
- 11.2.14 Sunnylife
- 11.2.14.1. Overview
- 11.2.14.2. Products
- 11.2.14.3. SWOT Analysis
- 11.2.14.4. Recent Developments
- 11.2.14.5. Financials (Based on Availability)
- 11.2.15 MINNIDIP
- 11.2.15.1. Overview
- 11.2.15.2. Products
- 11.2.15.3. SWOT Analysis
- 11.2.15.4. Recent Developments
- 11.2.15.5. Financials (Based on Availability)
- 11.2.1 Blue Wave Products
List of Figures
- Figure 1: Global Above Ground Inflatable Pool Revenue Breakdown (million, %) by Region 2024 & 2032
- Figure 2: Global Above Ground Inflatable Pool Volume Breakdown (K, %) by Region 2024 & 2032
- Figure 3: North America Above Ground Inflatable Pool Revenue (million), by Application 2024 & 2032
- Figure 4: North America Above Ground Inflatable Pool Volume (K), by Application 2024 & 2032
- Figure 5: North America Above Ground Inflatable Pool Revenue Share (%), by Application 2024 & 2032
- Figure 6: North America Above Ground Inflatable Pool Volume Share (%), by Application 2024 & 2032
- Figure 7: North America Above Ground Inflatable Pool Revenue (million), by Types 2024 & 2032
- Figure 8: North America Above Ground Inflatable Pool Volume (K), by Types 2024 & 2032
- Figure 9: North America Above Ground Inflatable Pool Revenue Share (%), by Types 2024 & 2032
- Figure 10: North America Above Ground Inflatable Pool Volume Share (%), by Types 2024 & 2032
- Figure 11: North America Above Ground Inflatable Pool Revenue (million), by Country 2024 & 2032
- Figure 12: North America Above Ground Inflatable Pool Volume (K), by Country 2024 & 2032
- Figure 13: North America Above Ground Inflatable Pool Revenue Share (%), by Country 2024 & 2032
- Figure 14: North America Above Ground Inflatable Pool Volume Share (%), by Country 2024 & 2032
- Figure 15: South America Above Ground Inflatable Pool Revenue (million), by Application 2024 & 2032
- Figure 16: South America Above Ground Inflatable Pool Volume (K), by Application 2024 & 2032
- Figure 17: South America Above Ground Inflatable Pool Revenue Share (%), by Application 2024 & 2032
- Figure 18: South America Above Ground Inflatable Pool Volume Share (%), by Application 2024 & 2032
- Figure 19: South America Above Ground Inflatable Pool Revenue (million), by Types 2024 & 2032
- Figure 20: South America Above Ground Inflatable Pool Volume (K), by Types 2024 & 2032
- Figure 21: South America Above Ground Inflatable Pool Revenue Share (%), by Types 2024 & 2032
- Figure 22: South America Above Ground Inflatable Pool Volume Share (%), by Types 2024 & 2032
- Figure 23: South America Above Ground Inflatable Pool Revenue (million), by Country 2024 & 2032
- Figure 24: South America Above Ground Inflatable Pool Volume (K), by Country 2024 & 2032
- Figure 25: South America Above Ground Inflatable Pool Revenue Share (%), by Country 2024 & 2032
- Figure 26: South America Above Ground Inflatable Pool Volume Share (%), by Country 2024 & 2032
- Figure 27: Europe Above Ground Inflatable Pool Revenue (million), by Application 2024 & 2032
- Figure 28: Europe Above Ground Inflatable Pool Volume (K), by Application 2024 & 2032
- Figure 29: Europe Above Ground Inflatable Pool Revenue Share (%), by Application 2024 & 2032
- Figure 30: Europe Above Ground Inflatable Pool Volume Share (%), by Application 2024 & 2032
- Figure 31: Europe Above Ground Inflatable Pool Revenue (million), by Types 2024 & 2032
- Figure 32: Europe Above Ground Inflatable Pool Volume (K), by Types 2024 & 2032
- Figure 33: Europe Above Ground Inflatable Pool Revenue Share (%), by Types 2024 & 2032
- Figure 34: Europe Above Ground Inflatable Pool Volume Share (%), by Types 2024 & 2032
- Figure 35: Europe Above Ground Inflatable Pool Revenue (million), by Country 2024 & 2032
- Figure 36: Europe Above Ground Inflatable Pool Volume (K), by Country 2024 & 2032
- Figure 37: Europe Above Ground Inflatable Pool Revenue Share (%), by Country 2024 & 2032
- Figure 38: Europe Above Ground Inflatable Pool Volume Share (%), by Country 2024 & 2032
- Figure 39: Middle East & Africa Above Ground Inflatable Pool Revenue (million), by Application 2024 & 2032
- Figure 40: Middle East & Africa Above Ground Inflatable Pool Volume (K), by Application 2024 & 2032
- Figure 41: Middle East & Africa Above Ground Inflatable Pool Revenue Share (%), by Application 2024 & 2032
- Figure 42: Middle East & Africa Above Ground Inflatable Pool Volume Share (%), by Application 2024 & 2032
- Figure 43: Middle East & Africa Above Ground Inflatable Pool Revenue (million), by Types 2024 & 2032
- Figure 44: Middle East & Africa Above Ground Inflatable Pool Volume (K), by Types 2024 & 2032
- Figure 45: Middle East & Africa Above Ground Inflatable Pool Revenue Share (%), by Types 2024 & 2032
- Figure 46: Middle East & Africa Above Ground Inflatable Pool Volume Share (%), by Types 2024 & 2032
- Figure 47: Middle East & Africa Above Ground Inflatable Pool Revenue (million), by Country 2024 & 2032
- Figure 48: Middle East & Africa Above Ground Inflatable Pool Volume (K), by Country 2024 & 2032
- Figure 49: Middle East & Africa Above Ground Inflatable Pool Revenue Share (%), by Country 2024 & 2032
- Figure 50: Middle East & Africa Above Ground Inflatable Pool Volume Share (%), by Country 2024 & 2032
- Figure 51: Asia Pacific Above Ground Inflatable Pool Revenue (million), by Application 2024 & 2032
- Figure 52: Asia Pacific Above Ground Inflatable Pool Volume (K), by Application 2024 & 2032
- Figure 53: Asia Pacific Above Ground Inflatable Pool Revenue Share (%), by Application 2024 & 2032
- Figure 54: Asia Pacific Above Ground Inflatable Pool Volume Share (%), by Application 2024 & 2032
- Figure 55: Asia Pacific Above Ground Inflatable Pool Revenue (million), by Types 2024 & 2032
- Figure 56: Asia Pacific Above Ground Inflatable Pool Volume (K), by Types 2024 & 2032
- Figure 57: Asia Pacific Above Ground Inflatable Pool Revenue Share (%), by Types 2024 & 2032
- Figure 58: Asia Pacific Above Ground Inflatable Pool Volume Share (%), by Types 2024 & 2032
- Figure 59: Asia Pacific Above Ground Inflatable Pool Revenue (million), by Country 2024 & 2032
- Figure 60: Asia Pacific Above Ground Inflatable Pool Volume (K), by Country 2024 & 2032
- Figure 61: Asia Pacific Above Ground Inflatable Pool Revenue Share (%), by Country 2024 & 2032
- Figure 62: Asia Pacific Above Ground Inflatable Pool Volume Share (%), by Country 2024 & 2032
List of Tables
- Table 1: Global Above Ground Inflatable Pool Revenue million Forecast, by Region 2019 & 2032
- Table 2: Global Above Ground Inflatable Pool Volume K Forecast, by Region 2019 & 2032
- Table 3: Global Above Ground Inflatable Pool Revenue million Forecast, by Application 2019 & 2032
- Table 4: Global Above Ground Inflatable Pool Volume K Forecast, by Application 2019 & 2032
- Table 5: Global Above Ground Inflatable Pool Revenue million Forecast, by Types 2019 & 2032
- Table 6: Global Above Ground Inflatable Pool Volume K Forecast, by Types 2019 & 2032
- Table 7: Global Above Ground Inflatable Pool Revenue million Forecast, by Region 2019 & 2032
- Table 8: Global Above Ground Inflatable Pool Volume K Forecast, by Region 2019 & 2032
- Table 9: Global Above Ground Inflatable Pool Revenue million Forecast, by Application 2019 & 2032
- Table 10: Global Above Ground Inflatable Pool Volume K Forecast, by Application 2019 & 2032
- Table 11: Global Above Ground Inflatable Pool Revenue million Forecast, by Types 2019 & 2032
- Table 12: Global Above Ground Inflatable Pool Volume K Forecast, by Types 2019 & 2032
- Table 13: Global Above Ground Inflatable Pool Revenue million Forecast, by Country 2019 & 2032
- Table 14: Global Above Ground Inflatable Pool Volume K Forecast, by Country 2019 & 2032
- Table 15: United States Above Ground Inflatable Pool Revenue (million) Forecast, by Application 2019 & 2032
- Table 16: United States Above Ground Inflatable Pool Volume (K) Forecast, by Application 2019 & 2032
- Table 17: Canada Above Ground Inflatable Pool Revenue (million) Forecast, by Application 2019 & 2032
- Table 18: Canada Above Ground Inflatable Pool Volume (K) Forecast, by Application 2019 & 2032
- Table 19: Mexico Above Ground Inflatable Pool Revenue (million) Forecast, by Application 2019 & 2032
- Table 20: Mexico Above Ground Inflatable Pool Volume (K) Forecast, by Application 2019 & 2032
- Table 21: Global Above Ground Inflatable Pool Revenue million Forecast, by Application 2019 & 2032
- Table 22: Global Above Ground Inflatable Pool Volume K Forecast, by Application 2019 & 2032
- Table 23: Global Above Ground Inflatable Pool Revenue million Forecast, by Types 2019 & 2032
- Table 24: Global Above Ground Inflatable Pool Volume K Forecast, by Types 2019 & 2032
- Table 25: Global Above Ground Inflatable Pool Revenue million Forecast, by Country 2019 & 2032
- Table 26: Global Above Ground Inflatable Pool Volume K Forecast, by Country 2019 & 2032
- Table 27: Brazil Above Ground Inflatable Pool Revenue (million) Forecast, by Application 2019 & 2032
- Table 28: Brazil Above Ground Inflatable Pool Volume (K) Forecast, by Application 2019 & 2032
- Table 29: Argentina Above Ground Inflatable Pool Revenue (million) Forecast, by Application 2019 & 2032
- Table 30: Argentina Above Ground Inflatable Pool Volume (K) Forecast, by Application 2019 & 2032
- Table 31: Rest of South America Above Ground Inflatable Pool Revenue (million) Forecast, by Application 2019 & 2032
- Table 32: Rest of South America Above Ground Inflatable Pool Volume (K) Forecast, by Application 2019 & 2032
- Table 33: Global Above Ground Inflatable Pool Revenue million Forecast, by Application 2019 & 2032
- Table 34: Global Above Ground Inflatable Pool Volume K Forecast, by Application 2019 & 2032
- Table 35: Global Above Ground Inflatable Pool Revenue million Forecast, by Types 2019 & 2032
- Table 36: Global Above Ground Inflatable Pool Volume K Forecast, by Types 2019 & 2032
- Table 37: Global Above Ground Inflatable Pool Revenue million Forecast, by Country 2019 & 2032
- Table 38: Global Above Ground Inflatable Pool Volume K Forecast, by Country 2019 & 2032
- Table 39: United Kingdom Above Ground Inflatable Pool Revenue (million) Forecast, by Application 2019 & 2032
- Table 40: United Kingdom Above Ground Inflatable Pool Volume (K) Forecast, by Application 2019 & 2032
- Table 41: Germany Above Ground Inflatable Pool Revenue (million) Forecast, by Application 2019 & 2032
- Table 42: Germany Above Ground Inflatable Pool Volume (K) Forecast, by Application 2019 & 2032
- Table 43: France Above Ground Inflatable Pool Revenue (million) Forecast, by Application 2019 & 2032
- Table 44: France Above Ground Inflatable Pool Volume (K) Forecast, by Application 2019 & 2032
- Table 45: Italy Above Ground Inflatable Pool Revenue (million) Forecast, by Application 2019 & 2032
- Table 46: Italy Above Ground Inflatable Pool Volume (K) Forecast, by Application 2019 & 2032
- Table 47: Spain Above Ground Inflatable Pool Revenue (million) Forecast, by Application 2019 & 2032
- Table 48: Spain Above Ground Inflatable Pool Volume (K) Forecast, by Application 2019 & 2032
- Table 49: Russia Above Ground Inflatable Pool Revenue (million) Forecast, by Application 2019 & 2032
- Table 50: Russia Above Ground Inflatable Pool Volume (K) Forecast, by Application 2019 & 2032
- Table 51: Benelux Above Ground Inflatable Pool Revenue (million) Forecast, by Application 2019 & 2032
- Table 52: Benelux Above Ground Inflatable Pool Volume (K) Forecast, by Application 2019 & 2032
- Table 53: Nordics Above Ground Inflatable Pool Revenue (million) Forecast, by Application 2019 & 2032
- Table 54: Nordics Above Ground Inflatable Pool Volume (K) Forecast, by Application 2019 & 2032
- Table 55: Rest of Europe Above Ground Inflatable Pool Revenue (million) Forecast, by Application 2019 & 2032
- Table 56: Rest of Europe Above Ground Inflatable Pool Volume (K) Forecast, by Application 2019 & 2032
- Table 57: Global Above Ground Inflatable Pool Revenue million Forecast, by Application 2019 & 2032
- Table 58: Global Above Ground Inflatable Pool Volume K Forecast, by Application 2019 & 2032
- Table 59: Global Above Ground Inflatable Pool Revenue million Forecast, by Types 2019 & 2032
- Table 60: Global Above Ground Inflatable Pool Volume K Forecast, by Types 2019 & 2032
- Table 61: Global Above Ground Inflatable Pool Revenue million Forecast, by Country 2019 & 2032
- Table 62: Global Above Ground Inflatable Pool Volume K Forecast, by Country 2019 & 2032
- Table 63: Turkey Above Ground Inflatable Pool Revenue (million) Forecast, by Application 2019 & 2032
- Table 64: Turkey Above Ground Inflatable Pool Volume (K) Forecast, by Application 2019 & 2032
- Table 65: Israel Above Ground Inflatable Pool Revenue (million) Forecast, by Application 2019 & 2032
- Table 66: Israel Above Ground Inflatable Pool Volume (K) Forecast, by Application 2019 & 2032
- Table 67: GCC Above Ground Inflatable Pool Revenue (million) Forecast, by Application 2019 & 2032
- Table 68: GCC Above Ground Inflatable Pool Volume (K) Forecast, by Application 2019 & 2032
- Table 69: North Africa Above Ground Inflatable Pool Revenue (million) Forecast, by Application 2019 & 2032
- Table 70: North Africa Above Ground Inflatable Pool Volume (K) Forecast, by Application 2019 & 2032
- Table 71: South Africa Above Ground Inflatable Pool Revenue (million) Forecast, by Application 2019 & 2032
- Table 72: South Africa Above Ground Inflatable Pool Volume (K) Forecast, by Application 2019 & 2032
- Table 73: Rest of Middle East & Africa Above Ground Inflatable Pool Revenue (million) Forecast, by Application 2019 & 2032
- Table 74: Rest of Middle East & Africa Above Ground Inflatable Pool Volume (K) Forecast, by Application 2019 & 2032
- Table 75: Global Above Ground Inflatable Pool Revenue million Forecast, by Application 2019 & 2032
- Table 76: Global Above Ground Inflatable Pool Volume K Forecast, by Application 2019 & 2032
- Table 77: Global Above Ground Inflatable Pool Revenue million Forecast, by Types 2019 & 2032
- Table 78: Global Above Ground Inflatable Pool Volume K Forecast, by Types 2019 & 2032
- Table 79: Global Above Ground Inflatable Pool Revenue million Forecast, by Country 2019 & 2032
- Table 80: Global Above Ground Inflatable Pool Volume K Forecast, by Country 2019 & 2032
- Table 81: China Above Ground Inflatable Pool Revenue (million) Forecast, by Application 2019 & 2032
- Table 82: China Above Ground Inflatable Pool Volume (K) Forecast, by Application 2019 & 2032
- Table 83: India Above Ground Inflatable Pool Revenue (million) Forecast, by Application 2019 & 2032
- Table 84: India Above Ground Inflatable Pool Volume (K) Forecast, by Application 2019 & 2032
- Table 85: Japan Above Ground Inflatable Pool Revenue (million) Forecast, by Application 2019 & 2032
- Table 86: Japan Above Ground Inflatable Pool Volume (K) Forecast, by Application 2019 & 2032
- Table 87: South Korea Above Ground Inflatable Pool Revenue (million) Forecast, by Application 2019 & 2032
- Table 88: South Korea Above Ground Inflatable Pool Volume (K) Forecast, by Application 2019 & 2032
- Table 89: ASEAN Above Ground Inflatable Pool Revenue (million) Forecast, by Application 2019 & 2032
- Table 90: ASEAN Above Ground Inflatable Pool Volume (K) Forecast, by Application 2019 & 2032
- Table 91: Oceania Above Ground Inflatable Pool Revenue (million) Forecast, by Application 2019 & 2032
- Table 92: Oceania Above Ground Inflatable Pool Volume (K) Forecast, by Application 2019 & 2032
- Table 93: Rest of Asia Pacific Above Ground Inflatable Pool Revenue (million) Forecast, by Application 2019 & 2032
- Table 94: Rest of Asia Pacific Above Ground Inflatable Pool Volume (K) Forecast, by Application 2019 & 2032
Frequently Asked Questions
1. What is the projected Compound Annual Growth Rate (CAGR) of the Above Ground Inflatable Pool?
The projected CAGR is approximately XX%.
2. Which companies are prominent players in the Above Ground Inflatable Pool?
Key companies in the market include Blue Wave Products, Bestway, JILONG, Jasonwell, Speedo, Decathlon, Intex Recreation, Mizukami Kinzoki, Summer Escapes Swimming Pools, Aquafun.in, Aierinflatable Yiwu Tuozhan, Mojena Ground Pool, Homech, Sunnylife, MINNIDIP.
3. What are the main segments of the Above Ground Inflatable Pool?
The market segments include Application, Types.
4. Can you provide details about the market size?
The market size is estimated to be USD XXX million as of 2022.
5. What are some drivers contributing to market growth?
N/A
6. What are the notable trends driving market growth?
N/A
7. Are there any restraints impacting market growth?
N/A
8. Can you provide examples of recent developments in the market?
N/A
9. What pricing options are available for accessing the report?
Pricing options include single-user, multi-user, and enterprise licenses priced at USD 3350.00, USD 5025.00, and USD 6700.00 respectively.
10. Is the market size provided in terms of value or volume?
The market size is provided in terms of value, measured in million and volume, measured in K.
11. Are there any specific market keywords associated with the report?
Yes, the market keyword associated with the report is "Above Ground Inflatable Pool," which aids in identifying and referencing the specific market segment covered.
12. How do I determine which pricing option suits my needs best?
The pricing options vary based on user requirements and access needs. Individual users may opt for single-user licenses, while businesses requiring broader access may choose multi-user or enterprise licenses for cost-effective access to the report.
13. Are there any additional resources or data provided in the Above Ground Inflatable Pool report?
While the report offers comprehensive insights, it's advisable to review the specific contents or supplementary materials provided to ascertain if additional resources or data are available.
14. How can I stay updated on further developments or reports in the Above Ground Inflatable Pool?
To stay informed about further developments, trends, and reports in the Above Ground Inflatable Pool, consider subscribing to industry newsletters, following relevant companies and organizations, or regularly checking reputable industry news sources and publications.
Methodology
Step 1 - Identification of Relevant Samples Size from Population Database


Step 2 - Approaches for Defining Global Market Size (Value, Volume* & Price*)

Note*: In applicable scenarios
Step 3 - Data Sources
Primary Research
- Web Analytics
- Survey Reports
- Research Institute
- Latest Research Reports
- Opinion Leaders
Secondary Research
- Annual Reports
- White Paper
- Latest Press Release
- Industry Association
- Paid Database
- Investor Presentations

Step 4 - Data Triangulation
Involves using different sources of information in order to increase the validity of a study
These sources are likely to be stakeholders in a program - participants, other researchers, program staff, other community members, and so on.
Then we put all data in single framework & apply various statistical tools to find out the dynamic on the market.
During the analysis stage, feedback from the stakeholder groups would be compared to determine areas of agreement as well as areas of divergence


