

Key Insights
The global abrasive tools market, valued at approximately 49.58 billion in the base year 2025, is projected for significant expansion, forecasting a compound annual growth rate (CAGR) of 5% through 2033. Key growth drivers include escalating demand from the automotive and aerospace sectors, propelled by advancements in precision manufacturing and high-performance component requirements. The burgeoning medical device industry also fuels market growth, necessitating precise tools for implant and surgical instrument fabrication. Global infrastructure development, particularly in emerging economies, is boosting demand in construction and mining. Technological innovations in material science, yielding more durable and efficient abrasives like Cubic Boron Nitride (CBN), further enhance market prospects. Restraints include raw material price volatility and environmental regulations. The market is segmented by material type, with diamond being dominant, and by applications including powertrain, bearing, gear manufacturing, tool grinding, and turbine production. Geographically, North America and Europe are established markets, while Asia-Pacific presents substantial growth potential due to rapid industrialization and infrastructure expansion.
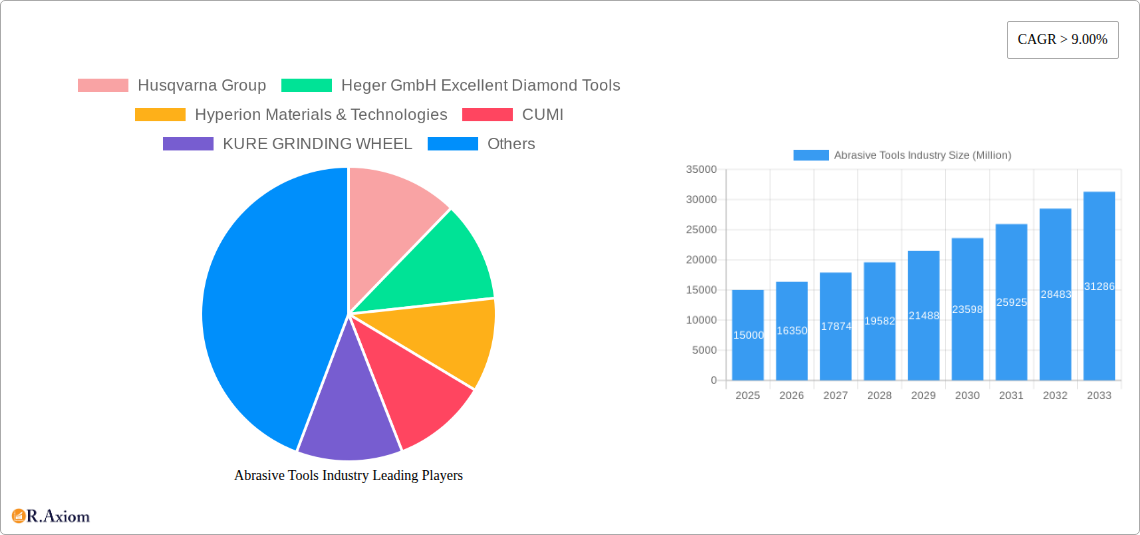
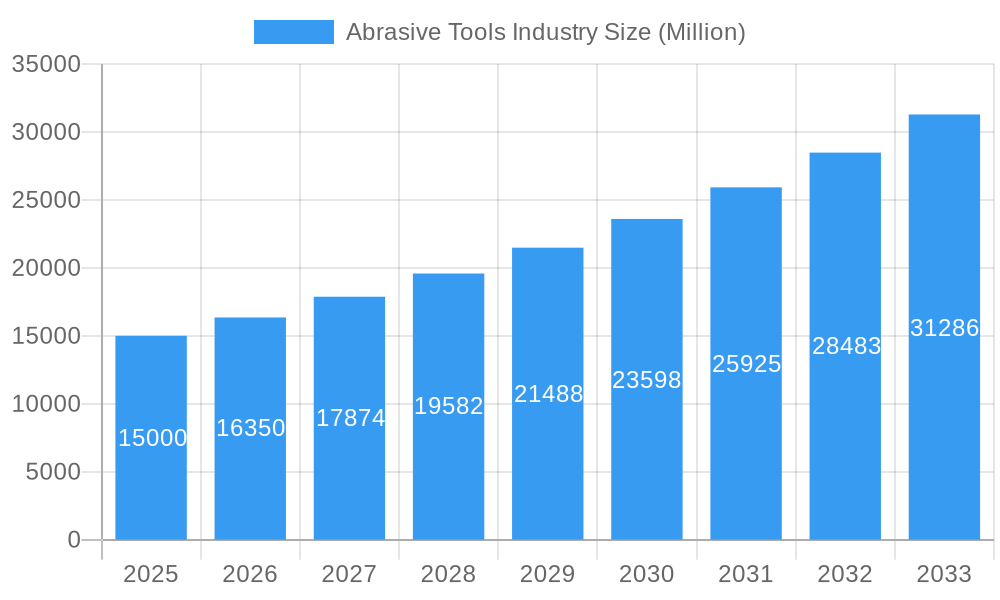
Abrasive Tools Industry Market Size (In Billion)
Market segmentation reveals key growth areas. CBN is expected to increase its market share due to superior performance in high-demand applications. The automotive and aerospace sectors lead in application segments, underscoring the need for precision. Emerging opportunities exist in the medical and electronics industries. Asia-Pacific, notably China and India, offers significant regional potential driven by expanding manufacturing. The competitive landscape features established global and regional players, necessitating strategic partnerships, acquisitions, and innovation for sustained growth. Future projections indicate continued expansion, driven by technological advancements and broader adoption across diverse end-use industries.
Abrasive Tools Industry Company Market Share
Abrasive Tools Industry: A Comprehensive Market Report (2019-2033)
This comprehensive report provides an in-depth analysis of the global abrasive tools industry, covering market size, segmentation, key players, growth drivers, and future outlook. The study period spans from 2019 to 2033, with 2025 serving as the base and estimated year. The forecast period is 2025-2033, and the historical period covers 2019-2024. The report offers actionable insights for industry stakeholders, including manufacturers, suppliers, distributors, and investors. This detailed analysis uses millions (M) for all value notations.
Abrasive Tools Industry Market Concentration & Innovation
The abrasive tools market is moderately concentrated, with several major players holding significant market share. While precise market share figures for individual companies are proprietary, leading players like Husqvarna Group, 3M, Saint-Gobain, and Tyrolit command substantial portions. The industry witnesses continuous innovation driven by the need for higher efficiency, precision, and durability in abrasive tools. Regulatory frameworks, particularly concerning environmental regulations and worker safety, significantly influence product design and manufacturing processes. Product substitutes, such as laser cutting and water jet cutting, present challenges, yet the cost-effectiveness and versatility of abrasive tools maintain their dominant position. End-user trends towards automation and advanced manufacturing processes drive demand for sophisticated abrasive tools with enhanced precision and longevity. Mergers and acquisitions (M&A) activity reflects industry consolidation and the pursuit of technological advancements. For example, 3M's acquisition of Diamond Productions Inc. in June 2022, valued at xx M, showcases this trend. Other M&A deals during the period 2019-2024 resulted in a cumulative value of approximately xx M, contributing to market restructuring and increased competition.
- Market Concentration: Moderately concentrated with a few dominant players.
- Innovation Drivers: Demand for higher efficiency, precision, and durability.
- Regulatory Influence: Stringent environmental and safety regulations.
- M&A Activity: Significant consolidation and technology acquisition, with a cumulative value of approximately xx M (2019-2024).
Abrasive Tools Industry Industry Trends & Insights
The abrasive tools industry exhibits robust growth, driven by increasing demand across diverse end-user industries. The market is estimated at xx M in 2025, with a Compound Annual Growth Rate (CAGR) projected at xx% from 2025 to 2033. Technological advancements, including the development of advanced materials like nanocrystalline diamond and improved bonding technologies, enhance tool performance and lifespan. Consumer preferences increasingly favor sustainable and eco-friendly options, leading manufacturers to focus on reducing environmental impact and improving recyclability. Intense competition necessitates continuous product innovation and cost optimization. Market penetration of advanced abrasive tools, like those using CBN and nanomaterials, is growing steadily, particularly in high-precision applications such as aerospace and medical device manufacturing. The shift towards automation and Industry 4.0 principles also significantly impacts the industry, with a demand for smart abrasive tools integrated with data analytics and predictive maintenance systems. Market penetration of such automated solutions is expected to reach approximately xx% by 2033.
Dominant Markets & Segments in Abrasive Tools Industry
The automotive industry remains a dominant end-user sector, primarily due to its high volume manufacturing processes requiring extensive grinding and polishing. Within material types, diamond abrasive tools command a larger market share compared to CBN, owing to their cost-effectiveness in many applications. However, CBN tools are gaining traction in niche applications requiring higher hardness and thermal stability. Geographically, regions with robust manufacturing bases, like North America, Europe, and East Asia, exhibit higher demand.
- Leading Region: North America and East Asia lead based on robust manufacturing sectors and automotive industry focus.
- Dominant Material Type: Diamond abrasives maintain a larger market share.
- Key Application: Automotive manufacturing utilizes the highest volume of abrasive tools.
- Key Drivers: Automotive industry growth, demand for high-precision manufacturing, increasing automation, and government incentives for infrastructure development are prominent drivers in leading regions.
The dominance of the automotive segment stems from the extensive use of abrasive tools in machining various automotive components. Increased automation in automotive manufacturing facilities further fuels this demand. The growth of the aerospace industry and its rigorous quality control standards drives a significant demand for high-precision abrasive tools, particularly in the turbine application segment. Similar trends are observed within the medical, electronics, and oil and gas sectors.
Abrasive Tools Industry Product Developments
Recent product innovations focus on enhancing performance, durability, and precision. This includes the development of new bonding technologies for improved wheel strength, the use of advanced materials like nanocrystalline diamond and CBN composites, and the integration of sensors for real-time monitoring and automated process control. These advancements cater to the growing demand for improved efficiency, reduced manufacturing costs, and enhanced surface finishes across various applications. The market competitiveness necessitates the creation of products that seamlessly integrate with advanced manufacturing systems, offering superior performance and cost-effectiveness compared to traditional abrasive tools.
Report Scope & Segmentation Analysis
This report segments the abrasive tools market based on material type (Diamond, Cubic Boron Nitride (CBN)), application (Powertrain, Bearing, Gear, Tool Grinding, Turbine, Other Applications), and end-user industry (Aerospace, Automotive, Medical, Electronics, Oil and Gas, Other End-user Industries). Each segment's market size, growth projections, and competitive dynamics are analyzed. The automotive industry is projected to maintain its dominance with an estimated xx M market share in 2025, exhibiting a xx% CAGR during the forecast period. Diamond abrasive tools are predicted to capture a larger market share compared to CBN tools within the material segment. The market is further segmented geographically, providing regional insights into market dynamics.
Key Drivers of Abrasive Tools Industry Growth
Several factors fuel the abrasive tools market's growth. Technological advancements lead to improved tool performance and efficiency. Increasing automation in manufacturing processes boosts demand for high-precision abrasive tools. The expansion of end-user industries, particularly in the automotive, aerospace, and medical sectors, drives market growth. Government regulations promoting industrial efficiency and worker safety also influence the demand for more sophisticated and environmentally friendly abrasive tools. Economic growth in developing nations creates new markets for abrasive tools.
Challenges in the Abrasive Tools Industry Sector
The abrasive tools industry faces challenges such as fluctuating raw material prices and supply chain disruptions that impact production costs. Intense competition among established and emerging players necessitates continuous innovation to stay ahead. Environmental regulations concerning waste disposal and material usage necessitate the adoption of sustainable practices, leading to cost increases and technological changes. Economic downturns in key end-user sectors can negatively affect demand and market growth. These challenges are predicted to reduce growth by approximately xx% at certain periods.
Emerging Opportunities in Abrasive Tools Industry
Emerging opportunities lie in the development of advanced materials like nanocrystalline diamond and the integration of smart technologies for automated process control. Growth in emerging markets and new applications within the renewable energy sector offer considerable potential. The demand for sustainable and eco-friendly abrasive tools presents another opportunity for market expansion. Furthermore, the increasing adoption of additive manufacturing processes necessitates the development of abrasive tools suited for these new techniques.
Leading Players in the Abrasive Tools Industry Market
- Husqvarna Group
- Heger GmbH Excellent Diamond Tools
- Hyperion Materials & Technologies
- CUMI
- KURE GRINDING WHEEL
- Saint-Gobain
- Tyrolit
- Asahi Diamond Industrial Co Ltd
- Zhengzhou Hongtuo Superabrasive Products Co Ltd
- Gunter Effgen GmbH
- 3M
- NORITAKE CO LIMITED
- Dr Kaiser
Key Developments in Abrasive Tools Industry Industry
- June 2022: 3M acquired Diamond Productions Inc., expanding its superabrasive product portfolio.
- May 2022: Heger GmbH joined Husqvarna Construction, strengthening its position in the diamond tools market for construction.
Strategic Outlook for Abrasive Tools Industry Market
The abrasive tools industry is poised for sustained growth driven by technological advancements, increasing automation in manufacturing, and the expansion of key end-user industries. Opportunities exist in developing innovative products catering to emerging applications and a focus on sustainability. Companies that successfully navigate regulatory challenges, manage supply chain complexities, and embrace technological advancements will be best positioned to capture market share and drive future growth. The long-term outlook remains positive, with substantial growth potential in emerging markets and high-growth sectors.
Abrasive Tools Industry Segmentation
-
1. Material Type
- 1.1. Diamond
- 1.2. Cubic Boron Nitride (CBN)
-
2. Application
- 2.1. Powertrain
- 2.2. Bearing
- 2.3. Gear
- 2.4. Tool Grinding
- 2.5. Turbine
- 2.6. Other Applications
-
3. End-user Industry
- 3.1. Aerospace
- 3.2. Automotive
- 3.3. Medical
- 3.4. Electronics
- 3.5. Oil and Gas
- 3.6. Other End-user Industries
Abrasive Tools Industry Segmentation By Geography
-
1. Asia Pacific
- 1.1. China
- 1.2. India
- 1.3. Japan
- 1.4. South Korea
- 1.5. Rest of Asia Pacific
-
2. North America
- 2.1. United States
- 2.2. Canada
- 2.3. Mexico
-
3. Europe
- 3.1. Germany
- 3.2. United Kingdom
- 3.3. Italy
- 3.4. France
- 3.5. Nordic Countries
- 3.6. Rest of Europe
-
4. Rest of the World
- 4.1. South America
- 4.2. Middle East and Africa
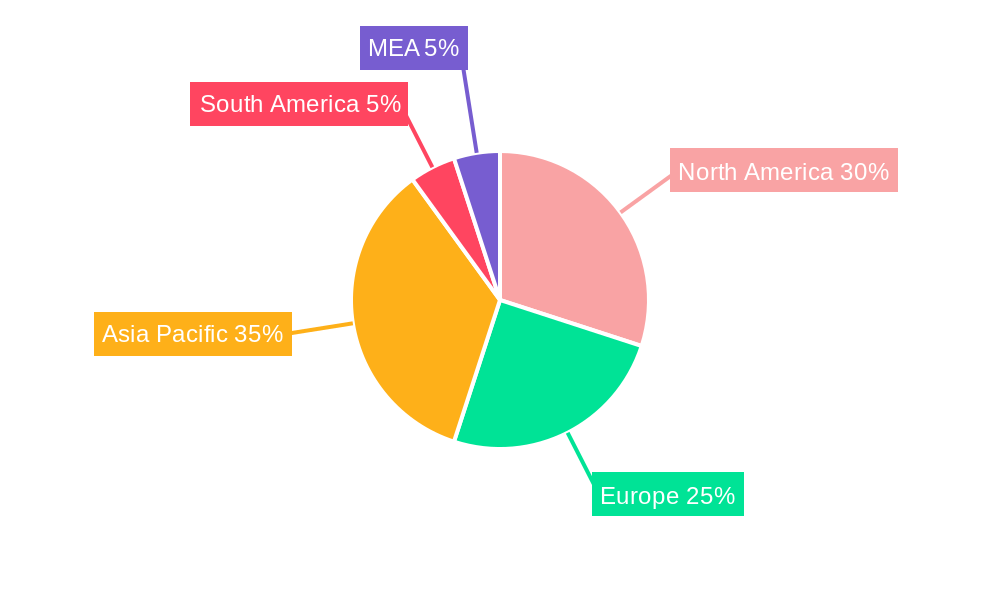
Abrasive Tools Industry Regional Market Share
Geographic Coverage of Abrasive Tools Industry
Abrasive Tools Industry REPORT HIGHLIGHTS
| Aspects | Details |
|---|---|
| Study Period | 2020-2034 |
| Base Year | 2025 |
| Estimated Year | 2026 |
| Forecast Period | 2026-2034 |
| Historical Period | 2020-2025 |
| Growth Rate | CAGR of 5% from 2020-2034 |
| Segmentation |
|
Table of Contents
- 1. Introduction
- 1.1. Research Scope
- 1.2. Market Segmentation
- 1.3. Research Objective
- 1.4. Definitions and Assumptions
- 2. Executive Summary
- 2.1. Market Snapshot
- 3. Market Dynamics
- 3.1. Market Drivers
- 3.2. Market Restrains
- 3.3. Market Trends
- 3.4. Market Opportunities
- 4. Market Factor Analysis
- 4.1. Porters Five Forces
- 4.1.1. Bargaining Power of Suppliers
- 4.1.2. Bargaining Power of Buyers
- 4.1.3. Threat of New Entrants
- 4.1.4. Threat of Substitutes
- 4.1.5. Competitive Rivalry
- 4.2. PESTEL analysis
- 4.3. BCG Analysis
- 4.3.1. Stars (High Growth, High Market Share)
- 4.3.2. Cash Cows (Low Growth, High Market Share)
- 4.3.3. Question Mark (High Growth, Low Market Share)
- 4.3.4. Dogs (Low Growth, Low Market Share)
- 4.4. Ansoff Matrix Analysis
- 4.5. Supply Chain Analysis
- 4.6. Regulatory Landscape
- 4.7. Current Market Potential and Opportunity Assessment (TAM–SAM–SOM Framework)
- 4.8. RAX Analyst Note
- 4.1. Porters Five Forces
- 5. Market Analysis, Insights and Forecast 2021-2033
- 5.1. Market Analysis, Insights and Forecast - by Material Type
- 5.1.1. Diamond
- 5.1.2. Cubic Boron Nitride (CBN)
- 5.2. Market Analysis, Insights and Forecast - by Application
- 5.2.1. Powertrain
- 5.2.2. Bearing
- 5.2.3. Gear
- 5.2.4. Tool Grinding
- 5.2.5. Turbine
- 5.2.6. Other Applications
- 5.3. Market Analysis, Insights and Forecast - by End-user Industry
- 5.3.1. Aerospace
- 5.3.2. Automotive
- 5.3.3. Medical
- 5.3.4. Electronics
- 5.3.5. Oil and Gas
- 5.3.6. Other End-user Industries
- 5.4. Market Analysis, Insights and Forecast - by Region
- 5.4.1. Asia Pacific
- 5.4.2. North America
- 5.4.3. Europe
- 5.4.4. Rest of the World
- 5.1. Market Analysis, Insights and Forecast - by Material Type
- 6. Global Abrasive Tools Industry Analysis, Insights and Forecast, 2021-2033
- 6.1. Market Analysis, Insights and Forecast - by Material Type
- 6.1.1. Diamond
- 6.1.2. Cubic Boron Nitride (CBN)
- 6.2. Market Analysis, Insights and Forecast - by Application
- 6.2.1. Powertrain
- 6.2.2. Bearing
- 6.2.3. Gear
- 6.2.4. Tool Grinding
- 6.2.5. Turbine
- 6.2.6. Other Applications
- 6.3. Market Analysis, Insights and Forecast - by End-user Industry
- 6.3.1. Aerospace
- 6.3.2. Automotive
- 6.3.3. Medical
- 6.3.4. Electronics
- 6.3.5. Oil and Gas
- 6.3.6. Other End-user Industries
- 6.1. Market Analysis, Insights and Forecast - by Material Type
- 7. Asia Pacific Abrasive Tools Industry Analysis, Insights and Forecast, 2020-2032
- 7.1. Market Analysis, Insights and Forecast - by Material Type
- 7.1.1. Diamond
- 7.1.2. Cubic Boron Nitride (CBN)
- 7.2. Market Analysis, Insights and Forecast - by Application
- 7.2.1. Powertrain
- 7.2.2. Bearing
- 7.2.3. Gear
- 7.2.4. Tool Grinding
- 7.2.5. Turbine
- 7.2.6. Other Applications
- 7.3. Market Analysis, Insights and Forecast - by End-user Industry
- 7.3.1. Aerospace
- 7.3.2. Automotive
- 7.3.3. Medical
- 7.3.4. Electronics
- 7.3.5. Oil and Gas
- 7.3.6. Other End-user Industries
- 7.1. Market Analysis, Insights and Forecast - by Material Type
- 8. North America Abrasive Tools Industry Analysis, Insights and Forecast, 2020-2032
- 8.1. Market Analysis, Insights and Forecast - by Material Type
- 8.1.1. Diamond
- 8.1.2. Cubic Boron Nitride (CBN)
- 8.2. Market Analysis, Insights and Forecast - by Application
- 8.2.1. Powertrain
- 8.2.2. Bearing
- 8.2.3. Gear
- 8.2.4. Tool Grinding
- 8.2.5. Turbine
- 8.2.6. Other Applications
- 8.3. Market Analysis, Insights and Forecast - by End-user Industry
- 8.3.1. Aerospace
- 8.3.2. Automotive
- 8.3.3. Medical
- 8.3.4. Electronics
- 8.3.5. Oil and Gas
- 8.3.6. Other End-user Industries
- 8.1. Market Analysis, Insights and Forecast - by Material Type
- 9. Europe Abrasive Tools Industry Analysis, Insights and Forecast, 2020-2032
- 9.1. Market Analysis, Insights and Forecast - by Material Type
- 9.1.1. Diamond
- 9.1.2. Cubic Boron Nitride (CBN)
- 9.2. Market Analysis, Insights and Forecast - by Application
- 9.2.1. Powertrain
- 9.2.2. Bearing
- 9.2.3. Gear
- 9.2.4. Tool Grinding
- 9.2.5. Turbine
- 9.2.6. Other Applications
- 9.3. Market Analysis, Insights and Forecast - by End-user Industry
- 9.3.1. Aerospace
- 9.3.2. Automotive
- 9.3.3. Medical
- 9.3.4. Electronics
- 9.3.5. Oil and Gas
- 9.3.6. Other End-user Industries
- 9.1. Market Analysis, Insights and Forecast - by Material Type
- 10. Rest of the World Abrasive Tools Industry Analysis, Insights and Forecast, 2020-2032
- 10.1. Market Analysis, Insights and Forecast - by Material Type
- 10.1.1. Diamond
- 10.1.2. Cubic Boron Nitride (CBN)
- 10.2. Market Analysis, Insights and Forecast - by Application
- 10.2.1. Powertrain
- 10.2.2. Bearing
- 10.2.3. Gear
- 10.2.4. Tool Grinding
- 10.2.5. Turbine
- 10.2.6. Other Applications
- 10.3. Market Analysis, Insights and Forecast - by End-user Industry
- 10.3.1. Aerospace
- 10.3.2. Automotive
- 10.3.3. Medical
- 10.3.4. Electronics
- 10.3.5. Oil and Gas
- 10.3.6. Other End-user Industries
- 10.1. Market Analysis, Insights and Forecast - by Material Type
- 11. Competitive Analysis
- 11.1. Company Profiles
- 11.1.1 Husqvarna Group
- 11.1.1.1. Company Overview
- 11.1.1.2. Products
- 11.1.1.3. Company Financials
- 11.1.1.4. SWOT Analysis
- 11.1.2 Heger GmbH Excellent Diamond Tools
- 11.1.2.1. Company Overview
- 11.1.2.2. Products
- 11.1.2.3. Company Financials
- 11.1.2.4. SWOT Analysis
- 11.1.3 Hyperion Materials & Technologies
- 11.1.3.1. Company Overview
- 11.1.3.2. Products
- 11.1.3.3. Company Financials
- 11.1.3.4. SWOT Analysis
- 11.1.4 CUMI
- 11.1.4.1. Company Overview
- 11.1.4.2. Products
- 11.1.4.3. Company Financials
- 11.1.4.4. SWOT Analysis
- 11.1.5 KURE GRINDING WHEEL
- 11.1.5.1. Company Overview
- 11.1.5.2. Products
- 11.1.5.3. Company Financials
- 11.1.5.4. SWOT Analysis
- 11.1.6 Saint-Gobain
- 11.1.6.1. Company Overview
- 11.1.6.2. Products
- 11.1.6.3. Company Financials
- 11.1.6.4. SWOT Analysis
- 11.1.7 Tyrolit
- 11.1.7.1. Company Overview
- 11.1.7.2. Products
- 11.1.7.3. Company Financials
- 11.1.7.4. SWOT Analysis
- 11.1.8 Asahi Diamond Industrial Co Ltd
- 11.1.8.1. Company Overview
- 11.1.8.2. Products
- 11.1.8.3. Company Financials
- 11.1.8.4. SWOT Analysis
- 11.1.9 Zhengzhou Hongtuo Superabrasive Products Co Ltd*List Not Exhaustive
- 11.1.9.1. Company Overview
- 11.1.9.2. Products
- 11.1.9.3. Company Financials
- 11.1.9.4. SWOT Analysis
- 11.1.10 Gunter Effgen GmbH
- 11.1.10.1. Company Overview
- 11.1.10.2. Products
- 11.1.10.3. Company Financials
- 11.1.10.4. SWOT Analysis
- 11.1.11 3M
- 11.1.11.1. Company Overview
- 11.1.11.2. Products
- 11.1.11.3. Company Financials
- 11.1.11.4. SWOT Analysis
- 11.1.12 NORITAKE CO LIMITED
- 11.1.12.1. Company Overview
- 11.1.12.2. Products
- 11.1.12.3. Company Financials
- 11.1.12.4. SWOT Analysis
- 11.1.13 Dr Kaiser
- 11.1.13.1. Company Overview
- 11.1.13.2. Products
- 11.1.13.3. Company Financials
- 11.1.13.4. SWOT Analysis
- 11.1.1 Husqvarna Group
- 11.2. Market Entropy
- 11.2.1 Company's Key Areas Served
- 11.2.2 Recent Developments
- 11.3. Company Market Share Analysis 2025
- 11.3.1 Top 5 Companies Market Share Analysis
- 11.3.2 Top 3 Companies Market Share Analysis
- 11.4. List of Potential Customers
- 12. Research Methodology
List of Figures
- Figure 1: Global Abrasive Tools Industry Revenue Breakdown (billion, %) by Region 2025 & 2033
- Figure 2: Asia Pacific Abrasive Tools Industry Revenue (billion), by Material Type 2025 & 2033
- Figure 3: Asia Pacific Abrasive Tools Industry Revenue Share (%), by Material Type 2025 & 2033
- Figure 4: Asia Pacific Abrasive Tools Industry Revenue (billion), by Application 2025 & 2033
- Figure 5: Asia Pacific Abrasive Tools Industry Revenue Share (%), by Application 2025 & 2033
- Figure 6: Asia Pacific Abrasive Tools Industry Revenue (billion), by End-user Industry 2025 & 2033
- Figure 7: Asia Pacific Abrasive Tools Industry Revenue Share (%), by End-user Industry 2025 & 2033
- Figure 8: Asia Pacific Abrasive Tools Industry Revenue (billion), by Country 2025 & 2033
- Figure 9: Asia Pacific Abrasive Tools Industry Revenue Share (%), by Country 2025 & 2033
- Figure 10: North America Abrasive Tools Industry Revenue (billion), by Material Type 2025 & 2033
- Figure 11: North America Abrasive Tools Industry Revenue Share (%), by Material Type 2025 & 2033
- Figure 12: North America Abrasive Tools Industry Revenue (billion), by Application 2025 & 2033
- Figure 13: North America Abrasive Tools Industry Revenue Share (%), by Application 2025 & 2033
- Figure 14: North America Abrasive Tools Industry Revenue (billion), by End-user Industry 2025 & 2033
- Figure 15: North America Abrasive Tools Industry Revenue Share (%), by End-user Industry 2025 & 2033
- Figure 16: North America Abrasive Tools Industry Revenue (billion), by Country 2025 & 2033
- Figure 17: North America Abrasive Tools Industry Revenue Share (%), by Country 2025 & 2033
- Figure 18: Europe Abrasive Tools Industry Revenue (billion), by Material Type 2025 & 2033
- Figure 19: Europe Abrasive Tools Industry Revenue Share (%), by Material Type 2025 & 2033
- Figure 20: Europe Abrasive Tools Industry Revenue (billion), by Application 2025 & 2033
- Figure 21: Europe Abrasive Tools Industry Revenue Share (%), by Application 2025 & 2033
- Figure 22: Europe Abrasive Tools Industry Revenue (billion), by End-user Industry 2025 & 2033
- Figure 23: Europe Abrasive Tools Industry Revenue Share (%), by End-user Industry 2025 & 2033
- Figure 24: Europe Abrasive Tools Industry Revenue (billion), by Country 2025 & 2033
- Figure 25: Europe Abrasive Tools Industry Revenue Share (%), by Country 2025 & 2033
- Figure 26: Rest of the World Abrasive Tools Industry Revenue (billion), by Material Type 2025 & 2033
- Figure 27: Rest of the World Abrasive Tools Industry Revenue Share (%), by Material Type 2025 & 2033
- Figure 28: Rest of the World Abrasive Tools Industry Revenue (billion), by Application 2025 & 2033
- Figure 29: Rest of the World Abrasive Tools Industry Revenue Share (%), by Application 2025 & 2033
- Figure 30: Rest of the World Abrasive Tools Industry Revenue (billion), by End-user Industry 2025 & 2033
- Figure 31: Rest of the World Abrasive Tools Industry Revenue Share (%), by End-user Industry 2025 & 2033
- Figure 32: Rest of the World Abrasive Tools Industry Revenue (billion), by Country 2025 & 2033
- Figure 33: Rest of the World Abrasive Tools Industry Revenue Share (%), by Country 2025 & 2033
List of Tables
- Table 1: Global Abrasive Tools Industry Revenue billion Forecast, by Material Type 2020 & 2033
- Table 2: Global Abrasive Tools Industry Revenue billion Forecast, by Application 2020 & 2033
- Table 3: Global Abrasive Tools Industry Revenue billion Forecast, by End-user Industry 2020 & 2033
- Table 4: Global Abrasive Tools Industry Revenue billion Forecast, by Region 2020 & 2033
- Table 5: Global Abrasive Tools Industry Revenue billion Forecast, by Material Type 2020 & 2033
- Table 6: Global Abrasive Tools Industry Revenue billion Forecast, by Application 2020 & 2033
- Table 7: Global Abrasive Tools Industry Revenue billion Forecast, by End-user Industry 2020 & 2033
- Table 8: Global Abrasive Tools Industry Revenue billion Forecast, by Country 2020 & 2033
- Table 9: China Abrasive Tools Industry Revenue (billion) Forecast, by Application 2020 & 2033
- Table 10: India Abrasive Tools Industry Revenue (billion) Forecast, by Application 2020 & 2033
- Table 11: Japan Abrasive Tools Industry Revenue (billion) Forecast, by Application 2020 & 2033
- Table 12: South Korea Abrasive Tools Industry Revenue (billion) Forecast, by Application 2020 & 2033
- Table 13: Rest of Asia Pacific Abrasive Tools Industry Revenue (billion) Forecast, by Application 2020 & 2033
- Table 14: Global Abrasive Tools Industry Revenue billion Forecast, by Material Type 2020 & 2033
- Table 15: Global Abrasive Tools Industry Revenue billion Forecast, by Application 2020 & 2033
- Table 16: Global Abrasive Tools Industry Revenue billion Forecast, by End-user Industry 2020 & 2033
- Table 17: Global Abrasive Tools Industry Revenue billion Forecast, by Country 2020 & 2033
- Table 18: United States Abrasive Tools Industry Revenue (billion) Forecast, by Application 2020 & 2033
- Table 19: Canada Abrasive Tools Industry Revenue (billion) Forecast, by Application 2020 & 2033
- Table 20: Mexico Abrasive Tools Industry Revenue (billion) Forecast, by Application 2020 & 2033
- Table 21: Global Abrasive Tools Industry Revenue billion Forecast, by Material Type 2020 & 2033
- Table 22: Global Abrasive Tools Industry Revenue billion Forecast, by Application 2020 & 2033
- Table 23: Global Abrasive Tools Industry Revenue billion Forecast, by End-user Industry 2020 & 2033
- Table 24: Global Abrasive Tools Industry Revenue billion Forecast, by Country 2020 & 2033
- Table 25: Germany Abrasive Tools Industry Revenue (billion) Forecast, by Application 2020 & 2033
- Table 26: United Kingdom Abrasive Tools Industry Revenue (billion) Forecast, by Application 2020 & 2033
- Table 27: Italy Abrasive Tools Industry Revenue (billion) Forecast, by Application 2020 & 2033
- Table 28: France Abrasive Tools Industry Revenue (billion) Forecast, by Application 2020 & 2033
- Table 29: Nordic Countries Abrasive Tools Industry Revenue (billion) Forecast, by Application 2020 & 2033
- Table 30: Rest of Europe Abrasive Tools Industry Revenue (billion) Forecast, by Application 2020 & 2033
- Table 31: Global Abrasive Tools Industry Revenue billion Forecast, by Material Type 2020 & 2033
- Table 32: Global Abrasive Tools Industry Revenue billion Forecast, by Application 2020 & 2033
- Table 33: Global Abrasive Tools Industry Revenue billion Forecast, by End-user Industry 2020 & 2033
- Table 34: Global Abrasive Tools Industry Revenue billion Forecast, by Country 2020 & 2033
- Table 35: South America Abrasive Tools Industry Revenue (billion) Forecast, by Application 2020 & 2033
- Table 36: Middle East and Africa Abrasive Tools Industry Revenue (billion) Forecast, by Application 2020 & 2033
Frequently Asked Questions
1. What is the projected Compound Annual Growth Rate (CAGR) of the Abrasive Tools Industry?
The projected CAGR is approximately 5%.
2. Which companies are prominent players in the Abrasive Tools Industry?
Key companies in the market include Husqvarna Group, Heger GmbH Excellent Diamond Tools, Hyperion Materials & Technologies, CUMI, KURE GRINDING WHEEL, Saint-Gobain, Tyrolit, Asahi Diamond Industrial Co Ltd, Zhengzhou Hongtuo Superabrasive Products Co Ltd*List Not Exhaustive, Gunter Effgen GmbH, 3M, NORITAKE CO LIMITED, Dr Kaiser.
3. What are the main segments of the Abrasive Tools Industry?
The market segments include Material Type, Application, End-user Industry.
4. Can you provide details about the market size?
The market size is estimated to be USD 49.58 billion as of 2022.
5. What are some drivers contributing to market growth?
Expanding Electronics Industry; Conventional Abrasives Substituted by Super Abrasives.
6. What are the notable trends driving market growth?
Expanding Electronics Industry.
7. Are there any restraints impacting market growth?
High Initial Investment due to High Cost of Abrasives.
8. Can you provide examples of recent developments in the market?
June 2022: 3M announced that it had acquired Diamond Productions Inc. The company manufactures super abrasive diamonds, CBN (cubic boron nitride) wheels, and tools for dimensioning and finishing hard-to-grind materials.
9. What pricing options are available for accessing the report?
Pricing options include single-user, multi-user, and enterprise licenses priced at USD 4750, USD 5250, and USD 8750 respectively.
10. Is the market size provided in terms of value or volume?
The market size is provided in terms of value, measured in billion.
11. Are there any specific market keywords associated with the report?
Yes, the market keyword associated with the report is "Abrasive Tools Industry," which aids in identifying and referencing the specific market segment covered.
12. How do I determine which pricing option suits my needs best?
The pricing options vary based on user requirements and access needs. Individual users may opt for single-user licenses, while businesses requiring broader access may choose multi-user or enterprise licenses for cost-effective access to the report.
13. Are there any additional resources or data provided in the Abrasive Tools Industry report?
While the report offers comprehensive insights, it's advisable to review the specific contents or supplementary materials provided to ascertain if additional resources or data are available.
14. How can I stay updated on further developments or reports in the Abrasive Tools Industry?
To stay informed about further developments, trends, and reports in the Abrasive Tools Industry, consider subscribing to industry newsletters, following relevant companies and organizations, or regularly checking reputable industry news sources and publications.
Methodology
Step 1 - Identification of Relevant Samples Size from Population Database


Step 2 - Approaches for Defining Global Market Size (Value, Volume* & Price*)

Note*: In applicable scenarios
Step 3 - Data Sources
Primary Research
- Web Analytics
- Survey Reports
- Research Institute
- Latest Research Reports
- Opinion Leaders
Secondary Research
- Annual Reports
- White Paper
- Latest Press Release
- Industry Association
- Paid Database
- Investor Presentations

Step 4 - Data Triangulation
Involves using different sources of information in order to increase the validity of a study
These sources are likely to be stakeholders in a program - participants, other researchers, program staff, other community members, and so on.
Then we put all data in single framework & apply various statistical tools to find out the dynamic on the market.
During the analysis stage, feedback from the stakeholder groups would be compared to determine areas of agreement as well as areas of divergence