

Key Insights
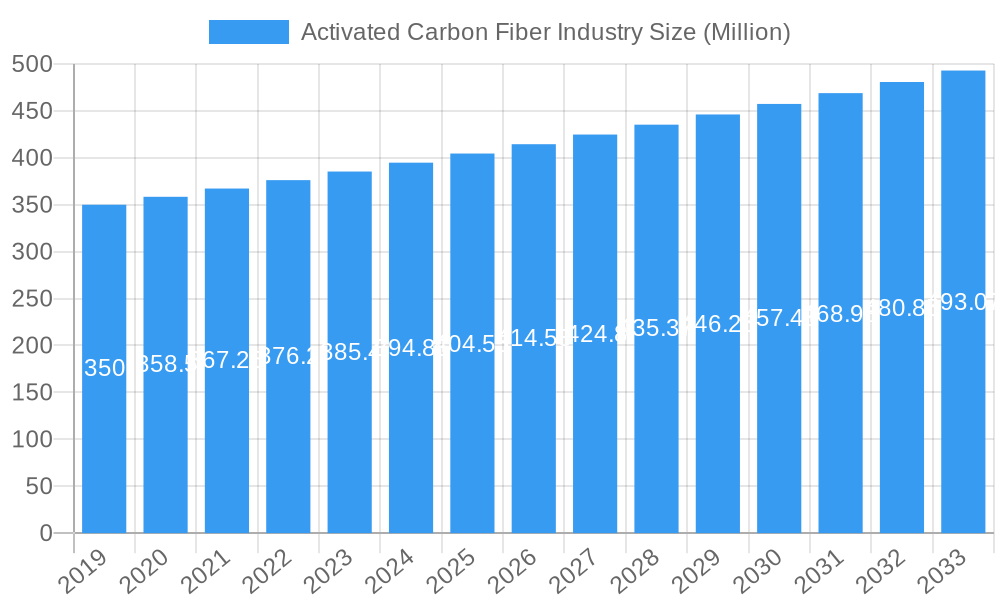
The global Activated Carbon Fiber (ACF) market is poised for steady growth, projected to reach approximately USD 414.13 million by 2025, with a Compound Annual Growth Rate (CAGR) of 3.71% anticipated through 2033. This expansion is primarily fueled by the escalating demand for advanced filtration and purification solutions across various industries, including water treatment, air purification, and industrial process control. The growing environmental consciousness and stringent regulations aimed at reducing pollution are significant drivers, pushing industries to adopt more effective ACF-based technologies for emission control and waste management. Furthermore, the increasing utilization of ACF in high-performance applications such as medical implants, protective clothing for hazardous environments, and energy storage devices like supercapacitors is contributing to market dynamism.
Activated Carbon Fiber Industry Market Size (In Million)
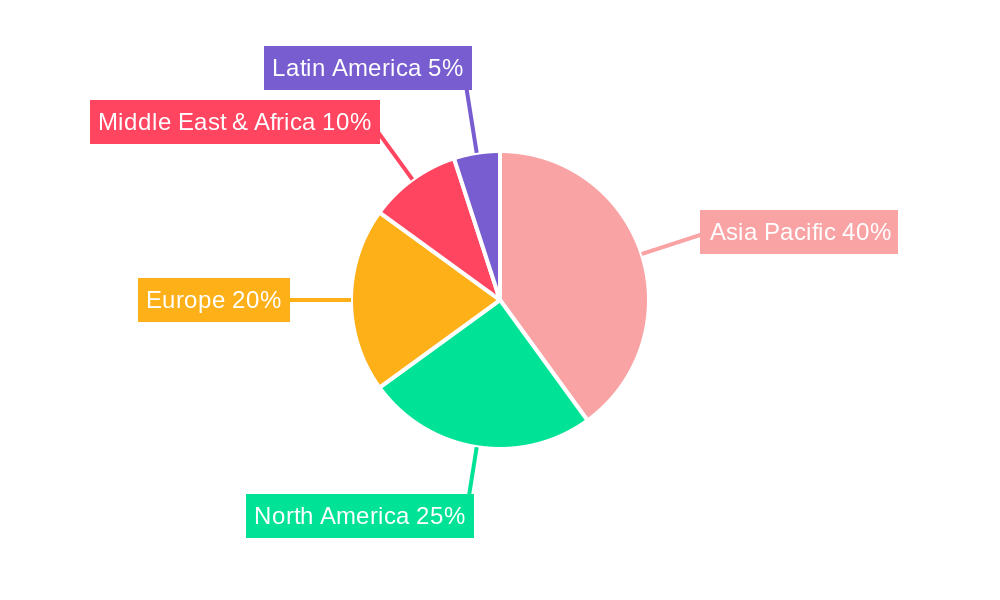
The ACF market is characterized by its diverse raw material base, encompassing both natural and synthetic options. Pitch-based and PAN-based fibers are gaining traction due to their superior adsorption properties and mechanical strength, catering to demanding applications. The trend towards sustainable and eco-friendly materials is also influencing raw material selection. Regionally, the Asia Pacific is expected to lead the market, driven by rapid industrialization, increasing investments in environmental technologies, and a large manufacturing base in countries like China and India. North America and Europe, with their established industrial sectors and a strong focus on R&D, will also represent significant markets. However, challenges such as the relatively high production cost of ACF compared to conventional activated carbon and the need for specialized manufacturing processes may moderate the growth trajectory in certain segments. Innovations in production techniques and the development of cost-effective ACF variants are crucial for overcoming these restraints and unlocking the full market potential.
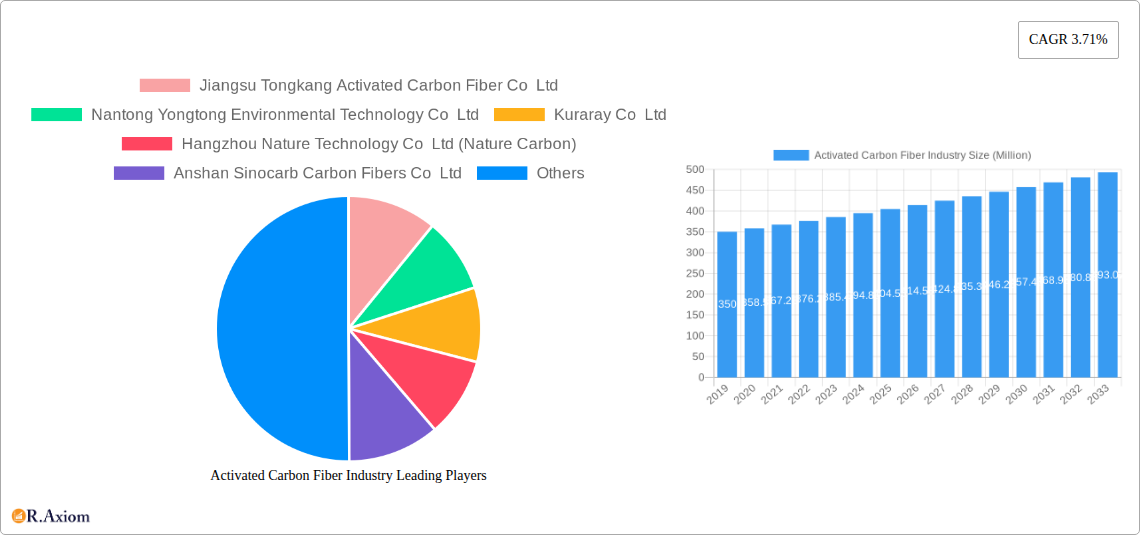
Activated Carbon Fiber Industry Company Market Share
This comprehensive report offers an in-depth analysis of the global Activated Carbon Fiber (ACF) industry, providing crucial insights for stakeholders seeking to navigate this rapidly evolving market. Spanning the historical period from 2019 to 2024, with a base year of 2025 and a forecast period extending to 2033, this study meticulously examines market concentration, innovation drivers, regulatory frameworks, product substitutes, end-user trends, and M&A activities. We delve into the intricate market dynamics, explore dominant markets and segments, and pinpoint key growth drivers, challenges, and emerging opportunities. This report is an essential resource for understanding the present landscape and future trajectory of the Activated Carbon Fiber industry, projected to reach XX Million by 2033.
Activated Carbon Fiber Industry Market Concentration & Innovation
The Activated Carbon Fiber (ACF) industry exhibits a moderate level of market concentration, with key players like Jiangsu Tongkang Activated Carbon Fiber Co Ltd, Nantong Yongtong Environmental Technology Co Ltd, and Kuraray Co Ltd holding significant market shares, estimated in the range of XX% to XX% of the global market. Innovation is a primary driver of growth, fueled by the demand for advanced materials with superior adsorption and filtration capabilities. Significant investments in research and development are observed, particularly in the development of novel ACF structures and surface modifications to enhance performance in specific applications such as water purification and air filtration. Regulatory frameworks, especially those concerning environmental protection and emission control, are increasingly stringent, creating a favorable environment for ACF adoption. However, the presence of effective product substitutes, including activated carbon granules and membranes, poses a competitive challenge. End-user trends are shifting towards sustainable and high-performance materials, with a growing preference for ACF in critical applications like medical devices and personal protective equipment. Mergers and acquisitions (M&A) activity in the sector is moderate, with a few strategic partnerships and acquisitions valued in the range of XX Million to XX Million aimed at expanding product portfolios and market reach.
Activated Carbon Fiber Industry Industry Trends & Insights
The Activated Carbon Fiber (ACF) industry is poised for substantial growth, driven by a confluence of technological advancements, evolving consumer preferences, and stringent environmental regulations. The market is projected to witness a Compound Annual Growth Rate (CAGR) of XX% during the forecast period of 2025–2033. A significant trend is the increasing adoption of ACF in environmental remediation applications, particularly for air and water purification, responding to global concerns about pollution and the need for cleaner industrial processes. Technological disruptions are primarily focused on enhancing the adsorptive capacity, selectivity, and regeneration efficiency of ACF. Innovations in raw material sourcing and processing, including the development of novel synthetic precursors like pitch-based and PAN-based fibers, are contributing to improved material properties and cost-effectiveness. Consumer preferences are leaning towards sustainable and eco-friendly solutions, with ACF offering a compelling alternative to conventional filtration materials due to its lightweight nature, high surface area, and reusability. The competitive dynamics within the industry are characterized by a blend of established players and emerging startups, all striving to capture market share through product differentiation and technological superiority. Market penetration is steadily increasing across various sectors, with a notable surge in demand from the automotive, aerospace, and healthcare industries. The ongoing development of advanced composite materials incorporating ACF further broadens its application spectrum and market reach.
Dominant Markets & Segments in Activated Carbon Fiber Industry
The Activated Carbon Fiber (ACF) industry is experiencing robust growth across various regions and application segments. Geographically, Asia-Pacific, particularly China, stands out as a dominant market due to its extensive manufacturing base, significant investments in environmental protection infrastructure, and a strong presence of key ACF manufacturers. The region's economic policies promoting technological innovation and the development of advanced materials further bolster its leadership.
Dominant Segments:
Application: Purification: This segment is a primary growth engine for ACF.
- Key Drivers: Stringent environmental regulations mandating cleaner air and water, rising industrial pollution, and increasing consumer awareness regarding health and hygiene are driving demand for ACF in water treatment plants, industrial emission control systems, and household air purifiers.
- Detailed Dominance Analysis: The purification segment leverages ACF's high adsorption capacity and large surface area to effectively remove a wide range of contaminants, including volatile organic compounds (VOCs), heavy metals, and organic pollutants. Its use in personal protective equipment (PPE) for hazardous environments also contributes to its dominance.
Raw Material: Synthetic (Pitch-based, Pan-based): Synthetic raw materials are increasingly favored for their controllability and ability to yield ACF with tailored properties.
- Key Drivers: The ability to engineer specific pore structures and surface chemistries in pitch-based and PAN-based ACF allows for enhanced performance in specialized applications. These materials offer superior thermal stability and mechanical strength compared to some natural alternatives.
- Detailed Dominance Analysis: Pitch-based ACF is particularly valued for its high mechanical strength and thermal stability, making it suitable for high-temperature applications and demanding filtration processes. PAN-based ACF offers excellent adsorption capabilities and is increasingly used in medical and electronic applications.
Activated Carbon Fiber Industry Product Developments
Recent product developments in the Activated Carbon Fiber (ACF) industry are focused on enhancing performance, expanding applications, and improving sustainability. Innovations include the development of ACF with highly tunable pore structures for selective adsorption of specific molecules, leading to improved efficiency in chemical separation and catalysis. Advancements in surface functionalization are creating ACF materials with enhanced antimicrobial properties for medical applications and improved fire retardancy for protective clothing. The competitive advantage lies in offering customized solutions that meet the precise demands of emerging industries such as supercapacitors, where high surface area and electrical conductivity are paramount. These product innovations are positioning ACF as a critical material for next-generation technologies.
Report Scope & Segmentation Analysis
This report provides a comprehensive analysis of the Activated Carbon Fiber (ACF) market, segmented by raw material and application.
- Raw Material Segmentation: The market is analyzed across Natural, Synthetic (Pitch-based, Pan-based, Phenolic-based, Viscose-based, Other Materials). Synthetic raw materials, particularly pitch-based and PAN-based fibers, are projected to witness the highest growth rates, driven by their superior properties and controllability, with a forecasted market size of XX Million by 2033.
- Application Segmentation: Key applications include Purification, Chemical Separation and Catalysis, Protective Clothing, Medical, Super Capacitors, and Other Applications. The Purification segment is anticipated to maintain its leading position, with an estimated market size of XX Million by 2033, driven by global environmental concerns. Super Capacitors represent a high-growth segment, with projected market expansion due to the increasing demand for energy storage solutions.
Key Drivers of Activated Carbon Fiber Industry Growth
The Activated Carbon Fiber (ACF) industry's growth is propelled by several key factors. Foremost among these is the escalating global demand for effective environmental solutions, driven by stringent regulations on air and water quality, and increasing industrialization. Technological advancements in material science are enabling the development of ACF with superior adsorption, filtration, and catalytic properties, opening up new application avenues. The growing awareness and adoption of sustainable and eco-friendly materials by consumers and industries further support the market. Furthermore, the expansion of industries such as healthcare, automotive, and electronics, which increasingly rely on high-performance materials, acts as a significant growth catalyst.
Challenges in the Activated Carbon Fiber Industry Sector
Despite its promising growth, the Activated Carbon Fiber (ACF) industry faces several challenges. High production costs associated with sophisticated manufacturing processes can limit market penetration in price-sensitive applications. The availability and consistent quality of raw materials, particularly specialized synthetic precursors, can pose supply chain challenges. Intense competition from established alternatives like activated carbon granules and other advanced filtration materials necessitates continuous innovation and cost optimization. Regulatory hurdles related to product certification and environmental compliance in certain regions can also slow down market adoption. Furthermore, the need for specialized handling and disposal of ACF in some applications requires end-user education and infrastructure development.
Emerging Opportunities in Activated Carbon Fiber Industry
The Activated Carbon Fiber (ACF) industry is ripe with emerging opportunities. The burgeoning demand for advanced energy storage solutions is creating significant potential for ACF in supercapacitors and batteries, driven by its high surface area and electrical conductivity. The increasing focus on personalized medicine and advanced diagnostics presents opportunities for ACF in biomedical applications, including drug delivery systems and wound care. The development of lightweight and high-performance composite materials for the aerospace and automotive industries, where ACF can provide enhanced structural integrity and functionality, represents another key growth area. Furthermore, the circular economy trend is fostering opportunities for developing more efficient and cost-effective regeneration technologies for ACF, reducing waste and improving sustainability.
Leading Players in the Activated Carbon Fiber Industry Market
- Jiangsu Tongkang Activated Carbon Fiber Co Ltd
- Nantong Yongtong Environmental Technology Co Ltd
- Kuraray Co Ltd
- Hangzhou Nature Technology Co Ltd (Nature Carbon)
- Anshan Sinocarb Carbon Fibers Co Ltd
- Unitika LTD
- China Beihai Fiberglass Co Ltd
- Toyobo Co Ltd
- Osaka Gas Chemicals Co Ltd
- Evertech Envisafe Ecology Co Ltd
- HPMS Graphite
Key Developments in Activated Carbon Fiber Industry Industry
- 2023: Kuraray Co Ltd announces advancements in developing highly porous pitch-based ACF for enhanced gas separation applications.
- 2023: Nantong Yongtong Environmental Technology Co Ltd expands its production capacity for PAN-based ACF to meet the growing demand from the medical sector.
- 2022: Hangzhou Nature Technology Co Ltd (Nature Carbon) introduces a new range of flexible ACF materials for wearable electronics and smart textiles.
- 2021: Jiangsu Tongkang Activated Carbon Fiber Co Ltd patents a novel surface modification technique for ACF to improve its catalytic activity in chemical processes.
- 2020: Toyobo Co Ltd develops a new generation of ACF with superior fire-retardant properties for use in high-performance protective clothing.
Strategic Outlook for Activated Carbon Fiber Industry Market
The strategic outlook for the Activated Carbon Fiber (ACF) market is exceptionally positive, characterized by sustained growth driven by technological innovation and increasing global demand for advanced materials. The industry is poised to capitalize on its versatility across a wide array of applications, from critical environmental remediation and healthcare solutions to cutting-edge energy storage and high-performance composites. Strategic investments in research and development, particularly in developing novel ACF precursors and enhancing existing performance characteristics, will be crucial for maintaining a competitive edge. Furthermore, strategic partnerships and collaborations aimed at expanding market reach and fostering application-specific innovations will accelerate the industry's trajectory. The increasing emphasis on sustainability and circular economy principles presents significant opportunities for developing environmentally friendly production and regeneration processes, further solidifying ACF's position as a key material for the future.
Activated Carbon Fiber Industry Segmentation
-
1. Raw Material
- 1.1. Natural
-
1.2. Synthetic
- 1.2.1. Pitch-based
- 1.2.2. Pan-based
- 1.2.3. Phenolic-based
- 1.2.4. Viscose-based
- 1.2.5. Other Materials
-
2. Application
- 2.1. Purification
- 2.2. Chemical Separation and Catalysis
- 2.3. Protective Clothing
- 2.4. Medical
- 2.5. Super Capacitors
- 2.6. Other Applications
Activated Carbon Fiber Industry Segmentation By Geography
-
1. Asia Pacific
- 1.1. China
- 1.2. India
- 1.3. Japan
- 1.4. South Korea
- 1.5. Rest of Asia Pacific
-
2. North America
- 2.1. United States
- 2.2. Mexico
- 2.3. Canada
-
3. Europe
- 3.1. Germany
- 3.2. United Kingdom
- 3.3. France
- 3.4. Italy
- 3.5. Rest of Europe
- 4. Middle East
-
5. Saudi Arabia
- 5.1. South Africa
- 5.2. Rest of Middle East
Activated Carbon Fiber Industry Regional Market Share
Geographic Coverage of Activated Carbon Fiber Industry
Activated Carbon Fiber Industry REPORT HIGHLIGHTS
| Aspects | Details |
|---|---|
| Study Period | 2020-2034 |
| Base Year | 2025 |
| Estimated Year | 2026 |
| Forecast Period | 2026-2034 |
| Historical Period | 2020-2025 |
| Growth Rate | CAGR of 3.71% from 2020-2034 |
| Segmentation |
|
Table of Contents
- 1. Introduction
- 1.1. Research Scope
- 1.2. Market Segmentation
- 1.3. Research Objective
- 1.4. Definitions and Assumptions
- 2. Executive Summary
- 2.1. Market Snapshot
- 3. Market Dynamics
- 3.1. Market Drivers
- 3.2. Market Restrains
- 3.3. Market Trends
- 3.4. Market Opportunities
- 4. Market Factor Analysis
- 4.1. Porters Five Forces
- 4.1.1. Bargaining Power of Suppliers
- 4.1.2. Bargaining Power of Buyers
- 4.1.3. Threat of New Entrants
- 4.1.4. Threat of Substitutes
- 4.1.5. Competitive Rivalry
- 4.2. PESTEL analysis
- 4.3. BCG Analysis
- 4.3.1. Stars (High Growth, High Market Share)
- 4.3.2. Cash Cows (Low Growth, High Market Share)
- 4.3.3. Question Mark (High Growth, Low Market Share)
- 4.3.4. Dogs (Low Growth, Low Market Share)
- 4.4. Ansoff Matrix Analysis
- 4.5. Supply Chain Analysis
- 4.6. Regulatory Landscape
- 4.7. Current Market Potential and Opportunity Assessment (TAM–SAM–SOM Framework)
- 4.8. RAX Analyst Note
- 4.1. Porters Five Forces
- 5. Market Analysis, Insights and Forecast 2021-2033
- 5.1. Market Analysis, Insights and Forecast - by Raw Material
- 5.1.1. Natural
- 5.1.2. Synthetic
- 5.1.2.1. Pitch-based
- 5.1.2.2. Pan-based
- 5.1.2.3. Phenolic-based
- 5.1.2.4. Viscose-based
- 5.1.2.5. Other Materials
- 5.2. Market Analysis, Insights and Forecast - by Application
- 5.2.1. Purification
- 5.2.2. Chemical Separation and Catalysis
- 5.2.3. Protective Clothing
- 5.2.4. Medical
- 5.2.5. Super Capacitors
- 5.2.6. Other Applications
- 5.3. Market Analysis, Insights and Forecast - by Region
- 5.3.1. Asia Pacific
- 5.3.2. North America
- 5.3.3. Europe
- 5.3.4. Middle East
- 5.3.5. Saudi Arabia
- 5.1. Market Analysis, Insights and Forecast - by Raw Material
- 6. Global Activated Carbon Fiber Industry Analysis, Insights and Forecast, 2021-2033
- 6.1. Market Analysis, Insights and Forecast - by Raw Material
- 6.1.1. Natural
- 6.1.2. Synthetic
- 6.1.2.1. Pitch-based
- 6.1.2.2. Pan-based
- 6.1.2.3. Phenolic-based
- 6.1.2.4. Viscose-based
- 6.1.2.5. Other Materials
- 6.2. Market Analysis, Insights and Forecast - by Application
- 6.2.1. Purification
- 6.2.2. Chemical Separation and Catalysis
- 6.2.3. Protective Clothing
- 6.2.4. Medical
- 6.2.5. Super Capacitors
- 6.2.6. Other Applications
- 6.1. Market Analysis, Insights and Forecast - by Raw Material
- 7. Asia Pacific Activated Carbon Fiber Industry Analysis, Insights and Forecast, 2020-2032
- 7.1. Market Analysis, Insights and Forecast - by Raw Material
- 7.1.1. Natural
- 7.1.2. Synthetic
- 7.1.2.1. Pitch-based
- 7.1.2.2. Pan-based
- 7.1.2.3. Phenolic-based
- 7.1.2.4. Viscose-based
- 7.1.2.5. Other Materials
- 7.2. Market Analysis, Insights and Forecast - by Application
- 7.2.1. Purification
- 7.2.2. Chemical Separation and Catalysis
- 7.2.3. Protective Clothing
- 7.2.4. Medical
- 7.2.5. Super Capacitors
- 7.2.6. Other Applications
- 7.1. Market Analysis, Insights and Forecast - by Raw Material
- 8. North America Activated Carbon Fiber Industry Analysis, Insights and Forecast, 2020-2032
- 8.1. Market Analysis, Insights and Forecast - by Raw Material
- 8.1.1. Natural
- 8.1.2. Synthetic
- 8.1.2.1. Pitch-based
- 8.1.2.2. Pan-based
- 8.1.2.3. Phenolic-based
- 8.1.2.4. Viscose-based
- 8.1.2.5. Other Materials
- 8.2. Market Analysis, Insights and Forecast - by Application
- 8.2.1. Purification
- 8.2.2. Chemical Separation and Catalysis
- 8.2.3. Protective Clothing
- 8.2.4. Medical
- 8.2.5. Super Capacitors
- 8.2.6. Other Applications
- 8.1. Market Analysis, Insights and Forecast - by Raw Material
- 9. Europe Activated Carbon Fiber Industry Analysis, Insights and Forecast, 2020-2032
- 9.1. Market Analysis, Insights and Forecast - by Raw Material
- 9.1.1. Natural
- 9.1.2. Synthetic
- 9.1.2.1. Pitch-based
- 9.1.2.2. Pan-based
- 9.1.2.3. Phenolic-based
- 9.1.2.4. Viscose-based
- 9.1.2.5. Other Materials
- 9.2. Market Analysis, Insights and Forecast - by Application
- 9.2.1. Purification
- 9.2.2. Chemical Separation and Catalysis
- 9.2.3. Protective Clothing
- 9.2.4. Medical
- 9.2.5. Super Capacitors
- 9.2.6. Other Applications
- 9.1. Market Analysis, Insights and Forecast - by Raw Material
- 10. Middle East Activated Carbon Fiber Industry Analysis, Insights and Forecast, 2020-2032
- 10.1. Market Analysis, Insights and Forecast - by Raw Material
- 10.1.1. Natural
- 10.1.2. Synthetic
- 10.1.2.1. Pitch-based
- 10.1.2.2. Pan-based
- 10.1.2.3. Phenolic-based
- 10.1.2.4. Viscose-based
- 10.1.2.5. Other Materials
- 10.2. Market Analysis, Insights and Forecast - by Application
- 10.2.1. Purification
- 10.2.2. Chemical Separation and Catalysis
- 10.2.3. Protective Clothing
- 10.2.4. Medical
- 10.2.5. Super Capacitors
- 10.2.6. Other Applications
- 10.1. Market Analysis, Insights and Forecast - by Raw Material
- 11. Saudi Arabia Activated Carbon Fiber Industry Analysis, Insights and Forecast, 2020-2032
- 11.1. Market Analysis, Insights and Forecast - by Raw Material
- 11.1.1. Natural
- 11.1.2. Synthetic
- 11.1.2.1. Pitch-based
- 11.1.2.2. Pan-based
- 11.1.2.3. Phenolic-based
- 11.1.2.4. Viscose-based
- 11.1.2.5. Other Materials
- 11.2. Market Analysis, Insights and Forecast - by Application
- 11.2.1. Purification
- 11.2.2. Chemical Separation and Catalysis
- 11.2.3. Protective Clothing
- 11.2.4. Medical
- 11.2.5. Super Capacitors
- 11.2.6. Other Applications
- 11.1. Market Analysis, Insights and Forecast - by Raw Material
- 12. Competitive Analysis
- 12.1. Company Profiles
- 12.1.1 Jiangsu Tongkang Activated Carbon Fiber Co Ltd
- 12.1.1.1. Company Overview
- 12.1.1.2. Products
- 12.1.1.3. Company Financials
- 12.1.1.4. SWOT Analysis
- 12.1.2 Nantong Yongtong Environmental Technology Co Ltd
- 12.1.2.1. Company Overview
- 12.1.2.2. Products
- 12.1.2.3. Company Financials
- 12.1.2.4. SWOT Analysis
- 12.1.3 Kuraray Co Ltd
- 12.1.3.1. Company Overview
- 12.1.3.2. Products
- 12.1.3.3. Company Financials
- 12.1.3.4. SWOT Analysis
- 12.1.4 Hangzhou Nature Technology Co Ltd (Nature Carbon)
- 12.1.4.1. Company Overview
- 12.1.4.2. Products
- 12.1.4.3. Company Financials
- 12.1.4.4. SWOT Analysis
- 12.1.5 Anshan Sinocarb Carbon Fibers Co Ltd
- 12.1.5.1. Company Overview
- 12.1.5.2. Products
- 12.1.5.3. Company Financials
- 12.1.5.4. SWOT Analysis
- 12.1.6 Unitika LTD*List Not Exhaustive
- 12.1.6.1. Company Overview
- 12.1.6.2. Products
- 12.1.6.3. Company Financials
- 12.1.6.4. SWOT Analysis
- 12.1.7 China Beihai Fiberglass Co Ltd
- 12.1.7.1. Company Overview
- 12.1.7.2. Products
- 12.1.7.3. Company Financials
- 12.1.7.4. SWOT Analysis
- 12.1.8 Toyobo Co Ltd
- 12.1.8.1. Company Overview
- 12.1.8.2. Products
- 12.1.8.3. Company Financials
- 12.1.8.4. SWOT Analysis
- 12.1.9 Osaka Gas Chemicals Co Ltd
- 12.1.9.1. Company Overview
- 12.1.9.2. Products
- 12.1.9.3. Company Financials
- 12.1.9.4. SWOT Analysis
- 12.1.10 Evertech Envisafe Ecology Co Ltd
- 12.1.10.1. Company Overview
- 12.1.10.2. Products
- 12.1.10.3. Company Financials
- 12.1.10.4. SWOT Analysis
- 12.1.11 HPMS Graphite
- 12.1.11.1. Company Overview
- 12.1.11.2. Products
- 12.1.11.3. Company Financials
- 12.1.11.4. SWOT Analysis
- 12.1.1 Jiangsu Tongkang Activated Carbon Fiber Co Ltd
- 12.2. Market Entropy
- 12.2.1 Company's Key Areas Served
- 12.2.2 Recent Developments
- 12.3. Company Market Share Analysis 2025
- 12.3.1 Top 5 Companies Market Share Analysis
- 12.3.2 Top 3 Companies Market Share Analysis
- 12.4. List of Potential Customers
- 13. Research Methodology
List of Figures
- Figure 1: Global Activated Carbon Fiber Industry Revenue Breakdown (Million, %) by Region 2025 & 2033
- Figure 2: Asia Pacific Activated Carbon Fiber Industry Revenue (Million), by Raw Material 2025 & 2033
- Figure 3: Asia Pacific Activated Carbon Fiber Industry Revenue Share (%), by Raw Material 2025 & 2033
- Figure 4: Asia Pacific Activated Carbon Fiber Industry Revenue (Million), by Application 2025 & 2033
- Figure 5: Asia Pacific Activated Carbon Fiber Industry Revenue Share (%), by Application 2025 & 2033
- Figure 6: Asia Pacific Activated Carbon Fiber Industry Revenue (Million), by Country 2025 & 2033
- Figure 7: Asia Pacific Activated Carbon Fiber Industry Revenue Share (%), by Country 2025 & 2033
- Figure 8: North America Activated Carbon Fiber Industry Revenue (Million), by Raw Material 2025 & 2033
- Figure 9: North America Activated Carbon Fiber Industry Revenue Share (%), by Raw Material 2025 & 2033
- Figure 10: North America Activated Carbon Fiber Industry Revenue (Million), by Application 2025 & 2033
- Figure 11: North America Activated Carbon Fiber Industry Revenue Share (%), by Application 2025 & 2033
- Figure 12: North America Activated Carbon Fiber Industry Revenue (Million), by Country 2025 & 2033
- Figure 13: North America Activated Carbon Fiber Industry Revenue Share (%), by Country 2025 & 2033
- Figure 14: Europe Activated Carbon Fiber Industry Revenue (Million), by Raw Material 2025 & 2033
- Figure 15: Europe Activated Carbon Fiber Industry Revenue Share (%), by Raw Material 2025 & 2033
- Figure 16: Europe Activated Carbon Fiber Industry Revenue (Million), by Application 2025 & 2033
- Figure 17: Europe Activated Carbon Fiber Industry Revenue Share (%), by Application 2025 & 2033
- Figure 18: Europe Activated Carbon Fiber Industry Revenue (Million), by Country 2025 & 2033
- Figure 19: Europe Activated Carbon Fiber Industry Revenue Share (%), by Country 2025 & 2033
- Figure 20: Middle East Activated Carbon Fiber Industry Revenue (Million), by Raw Material 2025 & 2033
- Figure 21: Middle East Activated Carbon Fiber Industry Revenue Share (%), by Raw Material 2025 & 2033
- Figure 22: Middle East Activated Carbon Fiber Industry Revenue (Million), by Application 2025 & 2033
- Figure 23: Middle East Activated Carbon Fiber Industry Revenue Share (%), by Application 2025 & 2033
- Figure 24: Middle East Activated Carbon Fiber Industry Revenue (Million), by Country 2025 & 2033
- Figure 25: Middle East Activated Carbon Fiber Industry Revenue Share (%), by Country 2025 & 2033
- Figure 26: Saudi Arabia Activated Carbon Fiber Industry Revenue (Million), by Raw Material 2025 & 2033
- Figure 27: Saudi Arabia Activated Carbon Fiber Industry Revenue Share (%), by Raw Material 2025 & 2033
- Figure 28: Saudi Arabia Activated Carbon Fiber Industry Revenue (Million), by Application 2025 & 2033
- Figure 29: Saudi Arabia Activated Carbon Fiber Industry Revenue Share (%), by Application 2025 & 2033
- Figure 30: Saudi Arabia Activated Carbon Fiber Industry Revenue (Million), by Country 2025 & 2033
- Figure 31: Saudi Arabia Activated Carbon Fiber Industry Revenue Share (%), by Country 2025 & 2033
List of Tables
- Table 1: Global Activated Carbon Fiber Industry Revenue Million Forecast, by Raw Material 2020 & 2033
- Table 2: Global Activated Carbon Fiber Industry Revenue Million Forecast, by Application 2020 & 2033
- Table 3: Global Activated Carbon Fiber Industry Revenue Million Forecast, by Region 2020 & 2033
- Table 4: Global Activated Carbon Fiber Industry Revenue Million Forecast, by Raw Material 2020 & 2033
- Table 5: Global Activated Carbon Fiber Industry Revenue Million Forecast, by Application 2020 & 2033
- Table 6: Global Activated Carbon Fiber Industry Revenue Million Forecast, by Country 2020 & 2033
- Table 7: China Activated Carbon Fiber Industry Revenue (Million) Forecast, by Application 2020 & 2033
- Table 8: India Activated Carbon Fiber Industry Revenue (Million) Forecast, by Application 2020 & 2033
- Table 9: Japan Activated Carbon Fiber Industry Revenue (Million) Forecast, by Application 2020 & 2033
- Table 10: South Korea Activated Carbon Fiber Industry Revenue (Million) Forecast, by Application 2020 & 2033
- Table 11: Rest of Asia Pacific Activated Carbon Fiber Industry Revenue (Million) Forecast, by Application 2020 & 2033
- Table 12: Global Activated Carbon Fiber Industry Revenue Million Forecast, by Raw Material 2020 & 2033
- Table 13: Global Activated Carbon Fiber Industry Revenue Million Forecast, by Application 2020 & 2033
- Table 14: Global Activated Carbon Fiber Industry Revenue Million Forecast, by Country 2020 & 2033
- Table 15: United States Activated Carbon Fiber Industry Revenue (Million) Forecast, by Application 2020 & 2033
- Table 16: Mexico Activated Carbon Fiber Industry Revenue (Million) Forecast, by Application 2020 & 2033
- Table 17: Canada Activated Carbon Fiber Industry Revenue (Million) Forecast, by Application 2020 & 2033
- Table 18: Global Activated Carbon Fiber Industry Revenue Million Forecast, by Raw Material 2020 & 2033
- Table 19: Global Activated Carbon Fiber Industry Revenue Million Forecast, by Application 2020 & 2033
- Table 20: Global Activated Carbon Fiber Industry Revenue Million Forecast, by Country 2020 & 2033
- Table 21: Germany Activated Carbon Fiber Industry Revenue (Million) Forecast, by Application 2020 & 2033
- Table 22: United Kingdom Activated Carbon Fiber Industry Revenue (Million) Forecast, by Application 2020 & 2033
- Table 23: France Activated Carbon Fiber Industry Revenue (Million) Forecast, by Application 2020 & 2033
- Table 24: Italy Activated Carbon Fiber Industry Revenue (Million) Forecast, by Application 2020 & 2033
- Table 25: Rest of Europe Activated Carbon Fiber Industry Revenue (Million) Forecast, by Application 2020 & 2033
- Table 26: Global Activated Carbon Fiber Industry Revenue Million Forecast, by Raw Material 2020 & 2033
- Table 27: Global Activated Carbon Fiber Industry Revenue Million Forecast, by Application 2020 & 2033
- Table 28: Global Activated Carbon Fiber Industry Revenue Million Forecast, by Country 2020 & 2033
- Table 29: Global Activated Carbon Fiber Industry Revenue Million Forecast, by Raw Material 2020 & 2033
- Table 30: Global Activated Carbon Fiber Industry Revenue Million Forecast, by Application 2020 & 2033
- Table 31: Global Activated Carbon Fiber Industry Revenue Million Forecast, by Country 2020 & 2033
- Table 32: South Africa Activated Carbon Fiber Industry Revenue (Million) Forecast, by Application 2020 & 2033
- Table 33: Rest of Middle East Activated Carbon Fiber Industry Revenue (Million) Forecast, by Application 2020 & 2033
Frequently Asked Questions
1. What is the projected Compound Annual Growth Rate (CAGR) of the Activated Carbon Fiber Industry?
The projected CAGR is approximately 3.71%.
2. Which companies are prominent players in the Activated Carbon Fiber Industry?
Key companies in the market include Jiangsu Tongkang Activated Carbon Fiber Co Ltd, Nantong Yongtong Environmental Technology Co Ltd, Kuraray Co Ltd, Hangzhou Nature Technology Co Ltd (Nature Carbon), Anshan Sinocarb Carbon Fibers Co Ltd, Unitika LTD*List Not Exhaustive, China Beihai Fiberglass Co Ltd, Toyobo Co Ltd, Osaka Gas Chemicals Co Ltd, Evertech Envisafe Ecology Co Ltd, HPMS Graphite.
3. What are the main segments of the Activated Carbon Fiber Industry?
The market segments include Raw Material, Application.
4. Can you provide details about the market size?
The market size is estimated to be USD 414.13 Million as of 2022.
5. What are some drivers contributing to market growth?
Increasing Environmental Concerns Related to Air and Water Pollution; Superior Properties of Activated Carbon Fiber.
6. What are the notable trends driving market growth?
Increasing Demand from the Purification Industry.
7. Are there any restraints impacting market growth?
Concerns Related to Raw Materials.
8. Can you provide examples of recent developments in the market?
N/A
9. What pricing options are available for accessing the report?
Pricing options include single-user, multi-user, and enterprise licenses priced at USD 4750, USD 5250, and USD 8750 respectively.
10. Is the market size provided in terms of value or volume?
The market size is provided in terms of value, measured in Million.
11. Are there any specific market keywords associated with the report?
Yes, the market keyword associated with the report is "Activated Carbon Fiber Industry," which aids in identifying and referencing the specific market segment covered.
12. How do I determine which pricing option suits my needs best?
The pricing options vary based on user requirements and access needs. Individual users may opt for single-user licenses, while businesses requiring broader access may choose multi-user or enterprise licenses for cost-effective access to the report.
13. Are there any additional resources or data provided in the Activated Carbon Fiber Industry report?
While the report offers comprehensive insights, it's advisable to review the specific contents or supplementary materials provided to ascertain if additional resources or data are available.
14. How can I stay updated on further developments or reports in the Activated Carbon Fiber Industry?
To stay informed about further developments, trends, and reports in the Activated Carbon Fiber Industry, consider subscribing to industry newsletters, following relevant companies and organizations, or regularly checking reputable industry news sources and publications.
Methodology
Step 1 - Identification of Relevant Samples Size from Population Database


Step 2 - Approaches for Defining Global Market Size (Value, Volume* & Price*)

Note*: In applicable scenarios
Step 3 - Data Sources
Primary Research
- Web Analytics
- Survey Reports
- Research Institute
- Latest Research Reports
- Opinion Leaders
Secondary Research
- Annual Reports
- White Paper
- Latest Press Release
- Industry Association
- Paid Database
- Investor Presentations

Step 4 - Data Triangulation
Involves using different sources of information in order to increase the validity of a study
These sources are likely to be stakeholders in a program - participants, other researchers, program staff, other community members, and so on.
Then we put all data in single framework & apply various statistical tools to find out the dynamic on the market.
During the analysis stage, feedback from the stakeholder groups would be compared to determine areas of agreement as well as areas of divergence