

Key Insights
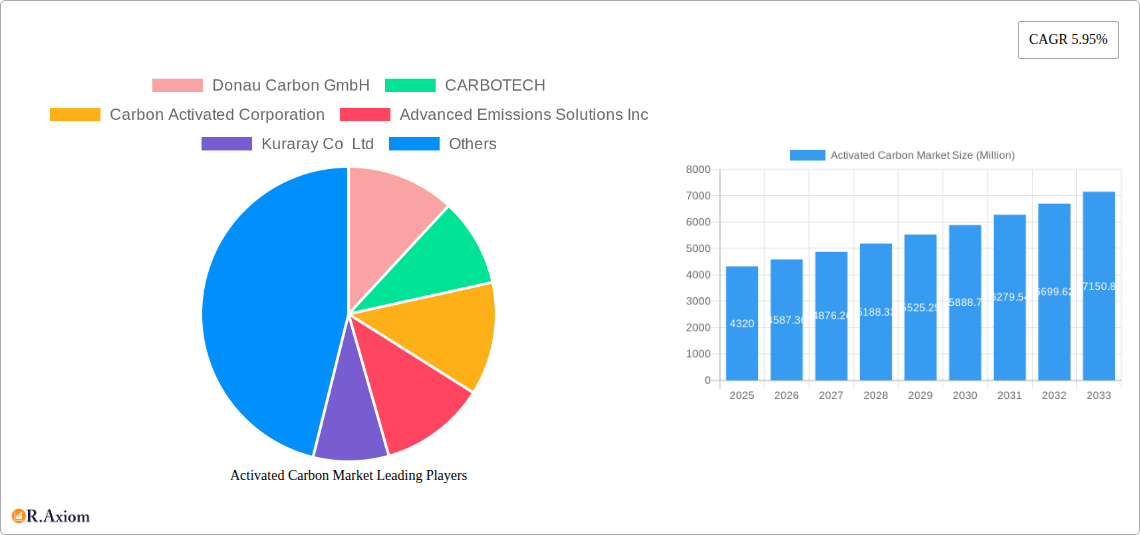
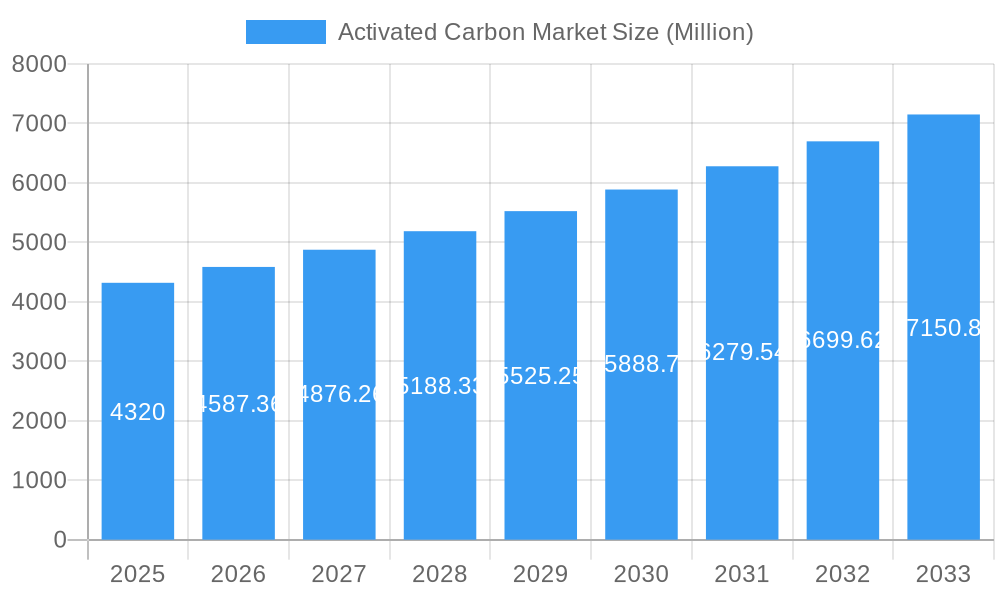
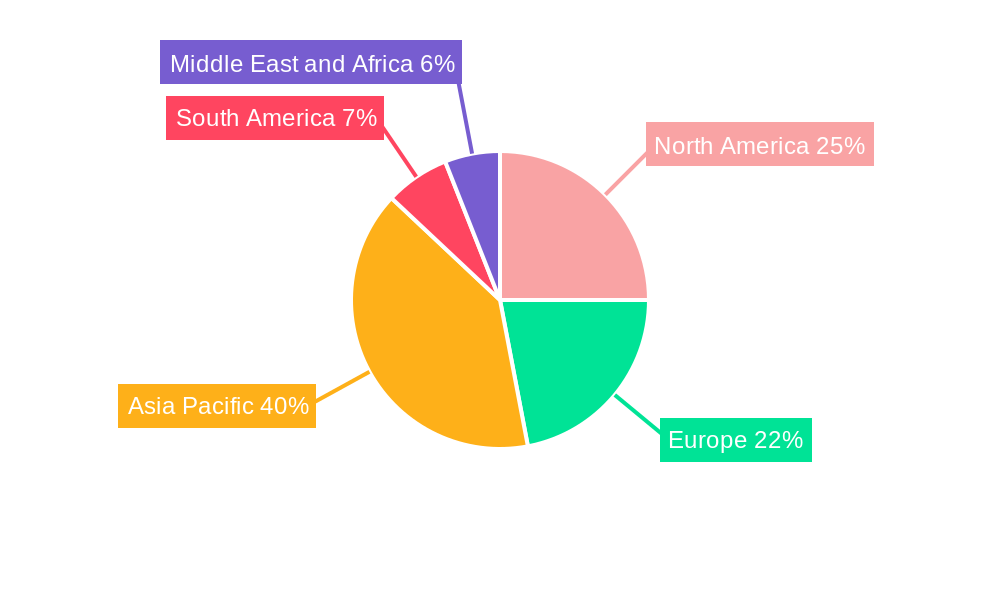
The global activated carbon market, valued at $4.32 billion in 2025, is projected to experience robust growth, driven by increasing demand across diverse sectors. A compound annual growth rate (CAGR) of 5.95% from 2025 to 2033 indicates a substantial expansion, primarily fueled by the rising adoption of water and air purification technologies in both developed and developing economies. The burgeoning food and beverage industry, stringent environmental regulations promoting cleaner industrial processes, and the growing healthcare sector requiring advanced filtration systems are key drivers. Powdered activated carbons (PAC) currently dominate the product type segment, but granular activated carbons (GAC) and extruded/pelletized forms are gaining traction due to their specific application advantages. Geographically, the Asia-Pacific region, led by China and India, holds a significant market share, attributed to rapid industrialization and increasing investments in infrastructure projects. However, North America and Europe also present substantial opportunities, driven by stringent environmental regulations and technological advancements. While the market faces challenges like fluctuating raw material prices and the potential for substitute technologies, the overall outlook remains positive, with significant growth potential across various applications and regions.
Activated Carbon Market Market Size (In Billion)
The competitive landscape is characterized by both large multinational corporations and specialized regional players. Companies like Cabot Corporation, Kuraray Co Ltd, and Donau Carbon GmbH are major players, often possessing diverse product portfolios and global reach. However, smaller, specialized firms are focusing on niche applications and regional markets, creating a dynamic and competitive market. Future market expansion is likely to be influenced by technological innovation, focusing on improved efficiency, sustainability, and cost-effectiveness of activated carbon production and application. The development of novel activated carbons with enhanced properties for specific applications will also play a significant role. Further expansion into emerging markets and the increasing awareness of environmental sustainability will continue to shape the market dynamics in the coming years.
Activated Carbon Market Company Market Share
This comprehensive report provides an in-depth analysis of the global activated carbon market, offering valuable insights for stakeholders across the value chain. The study covers the period from 2019 to 2033, with a focus on the forecast period from 2025 to 2033 and a base year of 2025. Key segments analyzed include product type (Powdered Activated Carbons (PAC), Granular Activated Carbons (GAC), Extruded or Pelletized Activated Carbon), application (Gas Purification, Water Purification, Metal Extraction, Medicine, Other Applications), and end-user industry (Water Treatment, Food and Beverage, Healthcare, Automotive, Industrial Processing, Other End-user Industries). The report also profiles leading players like Donau Carbon GmbH, CARBOTECH, and others, examining market dynamics, growth drivers, and future trends. The market is projected to reach xx Million by 2033.
Activated Carbon Market Concentration & Innovation
The activated carbon market exhibits a moderately concentrated structure, with a few major players holding significant market share. However, the presence of numerous smaller, specialized players ensures a dynamic competitive landscape. Market share data for 2024 suggests that the top 5 players collectively hold approximately xx% of the market, while the remaining share is distributed among several regional and niche players. Innovation is a crucial driver, with continuous advancements in production technologies, surface modification techniques, and application-specific formulations leading to enhanced performance and expanded applications.
Key Innovation Drivers:
- Development of high-performance activated carbons with improved adsorption capacity and selectivity.
- Advanced manufacturing processes leading to cost-effective production and consistent product quality.
- Emerging applications in environmental remediation, energy storage, and catalysis.
Regulatory frameworks, particularly those concerning environmental protection and industrial safety, significantly influence market dynamics. Stringent emission standards are driving the adoption of activated carbon in various industrial applications. The availability of substitute materials, such as zeolites and polymeric adsorbents, poses a challenge, albeit a limited one given the unique properties of activated carbon. End-user trends, including increasing demand for clean water and air, are fueling market growth. Mergers and acquisitions (M&A) are shaping market consolidation, with deal values averaging xx Million in recent years. Examples include the 2022 sale of Norit Activated Carbon by Cabot Corporation to One Equity Partners, highlighting ongoing industry restructuring.
Activated Carbon Market Industry Trends & Insights
The global activated carbon market is experiencing robust growth, driven by several factors. The rising global population and rapid urbanization are increasing the demand for clean water and air, significantly boosting the market for activated carbon in water and air purification applications. Technological advancements, particularly in the development of novel activated carbon materials with enhanced adsorption properties and selectivity, are widening the applications of activated carbon in various sectors, including medicine and industrial processing. Consumer preferences for environmentally friendly products and processes are also contributing to market growth. The market is witnessing a shift towards sustainable and environmentally responsible manufacturing practices, promoting the adoption of activated carbon in green technologies. The CAGR for the forecast period (2025-2033) is estimated at xx%, while market penetration in key segments, such as water treatment, is projected to increase to xx% by 2033. Competitive dynamics are marked by both consolidation through M&A activity and the emergence of new entrants, particularly in niche applications.
Dominant Markets & Segments in Activated Carbon Market
The Water Treatment segment dominates the Activated Carbon Market, driven by stringent regulatory standards for water quality and growing environmental concerns. Asia Pacific is the leading regional market, fueled by rapid industrialization and urbanization, along with increasing infrastructure investments in water treatment facilities. Within product types, Granular Activated Carbons (GAC) hold the largest market share due to their widespread use in water and wastewater treatment plants.
Key Drivers for Dominant Segments:
- Water Treatment: Stringent water quality regulations, expanding infrastructure, and increasing awareness of waterborne diseases.
- Asia Pacific Region: High population density, rapid industrialization, and significant investments in water and air purification infrastructure.
- Granular Activated Carbons (GAC): Versatility, ease of handling, and suitability for various applications.
Dominance Analysis: The dominance of the water treatment segment is primarily attributable to the rising global demand for clean and safe drinking water, amplified by stringent regulations and growing health awareness. The Asia-Pacific region’s rapid economic growth and significant investments in water treatment facilities have propelled its leading position in the market. GAC’s widespread use across various applications, coupled with its cost-effectiveness compared to PAC, contributes significantly to its market leadership in terms of product type.
Activated Carbon Market Product Developments
Recent product innovations focus on enhancing the adsorption capacity, selectivity, and durability of activated carbon. New materials, such as carbon nanotubes and graphene, are being integrated into activated carbon formulations to improve performance. Tailored activated carbon products are being developed for specific applications, addressing the unique challenges of each sector. These advancements are expanding the applications of activated carbon across various industries, giving the products a competitive advantage through superior performance and tailored solutions.
Report Scope & Segmentation Analysis
This report comprehensively analyzes the activated carbon market, segmented by product type, application, and end-user industry.
By Product Type: Powdered Activated Carbons (PAC), Granular Activated Carbons (GAC), and Extruded or Pelletized Activated Carbon are analyzed, focusing on their respective market sizes, growth projections, and competitive dynamics. PAC is expected to witness a xx% CAGR over the forecast period due to its widespread use in various applications, while GAC is poised for steady growth due to its superior performance and suitability for larger-scale operations. Extruded or pelletized activated carbon is gaining traction due to its enhanced properties and suitability for specialized applications.
By Application: The report analyzes market segments based on the application of activated carbon in gas purification, water purification, metal extraction, medicine, and other applications. Each application segment’s growth is driven by specific factors.
By End-user Industry: The report examines market segments according to the end-user industries that utilize activated carbon, such as water treatment, food and beverage, healthcare, automotive, industrial processing, and others. Each industry’s unique needs and growth trajectory influence the market for activated carbon.
Key Drivers of Activated Carbon Market Growth
The activated carbon market's growth is propelled by several key factors. Stringent environmental regulations worldwide are driving the adoption of activated carbon in various industries to meet emission control standards. The increasing demand for clean water and air, fueled by growing urbanization and population, is significantly boosting the use of activated carbon in water and air purification. Technological advancements in the production of high-performance activated carbon materials are expanding its applications in various sectors. Moreover, the rising focus on sustainable and environmentally friendly technologies is further enhancing the market for activated carbon.
Challenges in the Activated Carbon Market Sector
The activated carbon market faces several challenges, including fluctuations in raw material prices, which impact production costs and profitability. Competition from substitute materials and technological disruptions pose a threat to market growth. Furthermore, stringent regulatory requirements related to manufacturing and disposal can increase production costs and complexities. Supply chain disruptions can lead to production delays and price volatility.
Emerging Opportunities in Activated Carbon Market
Emerging opportunities exist in the development of novel activated carbon materials with enhanced functionalities, including improved adsorption capacity, selectivity, and durability. The use of activated carbon in energy storage applications, such as supercapacitors and batteries, is also gaining traction. Expanding applications in emerging markets, such as the treatment of industrial wastewater and air purification in developing economies, represent substantial growth potential. The increasing focus on sustainability is driving opportunities for the development of environmentally friendly production processes and applications of activated carbon in green technologies.
Leading Players in the Activated Carbon Market Market
- Donau Carbon GmbH
- CARBOTECH
- Carbon Activated Corporation
- Advanced Emissions Solutions Inc
- Kuraray Co Ltd
- CPL Activated Carbons
- Evoqua Water Technologies LLC
- Cabot Corporation
- Kureha Corporation
- Ingevity
- Silcarbon Aktivkohle GmbH
- Haycarb (Pvt ) Ltd
- Puragen Activated Carbons
- Jacobi Carbons Group
- Albemarle Corporation
- Veolia (Veolia Water Technologies)
- List Not Exhaustive
Key Developments in Activated Carbon Market Industry
- March 2022: Cabot Corporation sold its activated carbon unit, Norit Activated Carbon, to One Equity Partners. This divestiture resulted in Norit Activated Carbon becoming an independent company with ten production facilities across seven countries. This significantly altered the competitive landscape, creating a new major player in the market.
Strategic Outlook for Activated Carbon Market Market
The activated carbon market is poised for continued growth, driven by increasing environmental concerns, stringent regulations, and technological advancements. Expanding applications in emerging economies and the development of innovative activated carbon materials will further fuel market expansion. The strategic focus on sustainable and environmentally friendly solutions will attract investments and drive innovation in the sector. The market’s future is bright, with significant opportunities for growth and innovation across diverse applications.
Activated Carbon Market Segmentation
-
1. Product Type
- 1.1. Powdered Activated Carbons (PAC)
- 1.2. Granular Activated Carbons (GAC)
- 1.3. Extruded or Pelletized Activated Carbon
-
2. Application
- 2.1. Gas Purification
- 2.2. Water Purification
- 2.3. Metal Extraction
- 2.4. Medicine
- 2.5. Other Applications
-
3. End-user Industry
- 3.1. Water Treatment
- 3.2. Food and Beverage
- 3.3. Healthcare
- 3.4. Automotive
- 3.5. Industrial Processing
- 3.6. Other End-user Industries
Activated Carbon Market Segmentation By Geography
-
1. Asia Pacific
- 1.1. China
- 1.2. India
- 1.3. Japan
- 1.4. South Korea
- 1.5. Rest of Asia Pacific
-
2. North America
- 2.1. United States
- 2.2. Canada
- 2.3. Mexico
-
3. Europe
- 3.1. Germany
- 3.2. United Kingdom
- 3.3. France
- 3.4. Italy
- 3.5. Spain
- 3.6. Rest of Europe
-
4. South America
- 4.1. Brazil
- 4.2. Argentina
- 4.3. Rest of South America
-
5. Middle East and Africa
- 5.1. Saudi Arabia
- 5.2. South Africa
- 5.3. Rest of Middle East and Africa
Activated Carbon Market Regional Market Share
Geographic Coverage of Activated Carbon Market
Activated Carbon Market REPORT HIGHLIGHTS
| Aspects | Details |
|---|---|
| Study Period | 2020-2034 |
| Base Year | 2025 |
| Estimated Year | 2026 |
| Forecast Period | 2026-2034 |
| Historical Period | 2020-2025 |
| Growth Rate | CAGR of 5.95% from 2020-2034 |
| Segmentation |
|
Table of Contents
- 1. Introduction
- 1.1. Research Scope
- 1.2. Market Segmentation
- 1.3. Research Objective
- 1.4. Definitions and Assumptions
- 2. Executive Summary
- 2.1. Market Snapshot
- 3. Market Dynamics
- 3.1. Market Drivers
- 3.2. Market Restrains
- 3.3. Market Trends
- 3.4. Market Opportunities
- 4. Market Factor Analysis
- 4.1. Porters Five Forces
- 4.1.1. Bargaining Power of Suppliers
- 4.1.2. Bargaining Power of Buyers
- 4.1.3. Threat of New Entrants
- 4.1.4. Threat of Substitutes
- 4.1.5. Competitive Rivalry
- 4.2. PESTEL analysis
- 4.3. BCG Analysis
- 4.3.1. Stars (High Growth, High Market Share)
- 4.3.2. Cash Cows (Low Growth, High Market Share)
- 4.3.3. Question Mark (High Growth, Low Market Share)
- 4.3.4. Dogs (Low Growth, Low Market Share)
- 4.4. Ansoff Matrix Analysis
- 4.5. Supply Chain Analysis
- 4.6. Regulatory Landscape
- 4.7. Current Market Potential and Opportunity Assessment (TAM–SAM–SOM Framework)
- 4.8. RAX Analyst Note
- 4.1. Porters Five Forces
- 5. Market Analysis, Insights and Forecast 2021-2033
- 5.1. Market Analysis, Insights and Forecast - by Product Type
- 5.1.1. Powdered Activated Carbons (PAC)
- 5.1.2. Granular Activated Carbons (GAC)
- 5.1.3. Extruded or Pelletized Activated Carbon
- 5.2. Market Analysis, Insights and Forecast - by Application
- 5.2.1. Gas Purification
- 5.2.2. Water Purification
- 5.2.3. Metal Extraction
- 5.2.4. Medicine
- 5.2.5. Other Applications
- 5.3. Market Analysis, Insights and Forecast - by End-user Industry
- 5.3.1. Water Treatment
- 5.3.2. Food and Beverage
- 5.3.3. Healthcare
- 5.3.4. Automotive
- 5.3.5. Industrial Processing
- 5.3.6. Other End-user Industries
- 5.4. Market Analysis, Insights and Forecast - by Region
- 5.4.1. Asia Pacific
- 5.4.2. North America
- 5.4.3. Europe
- 5.4.4. South America
- 5.4.5. Middle East and Africa
- 5.1. Market Analysis, Insights and Forecast - by Product Type
- 6. Global Activated Carbon Market Analysis, Insights and Forecast, 2021-2033
- 6.1. Market Analysis, Insights and Forecast - by Product Type
- 6.1.1. Powdered Activated Carbons (PAC)
- 6.1.2. Granular Activated Carbons (GAC)
- 6.1.3. Extruded or Pelletized Activated Carbon
- 6.2. Market Analysis, Insights and Forecast - by Application
- 6.2.1. Gas Purification
- 6.2.2. Water Purification
- 6.2.3. Metal Extraction
- 6.2.4. Medicine
- 6.2.5. Other Applications
- 6.3. Market Analysis, Insights and Forecast - by End-user Industry
- 6.3.1. Water Treatment
- 6.3.2. Food and Beverage
- 6.3.3. Healthcare
- 6.3.4. Automotive
- 6.3.5. Industrial Processing
- 6.3.6. Other End-user Industries
- 6.1. Market Analysis, Insights and Forecast - by Product Type
- 7. Asia Pacific Activated Carbon Market Analysis, Insights and Forecast, 2020-2032
- 7.1. Market Analysis, Insights and Forecast - by Product Type
- 7.1.1. Powdered Activated Carbons (PAC)
- 7.1.2. Granular Activated Carbons (GAC)
- 7.1.3. Extruded or Pelletized Activated Carbon
- 7.2. Market Analysis, Insights and Forecast - by Application
- 7.2.1. Gas Purification
- 7.2.2. Water Purification
- 7.2.3. Metal Extraction
- 7.2.4. Medicine
- 7.2.5. Other Applications
- 7.3. Market Analysis, Insights and Forecast - by End-user Industry
- 7.3.1. Water Treatment
- 7.3.2. Food and Beverage
- 7.3.3. Healthcare
- 7.3.4. Automotive
- 7.3.5. Industrial Processing
- 7.3.6. Other End-user Industries
- 7.1. Market Analysis, Insights and Forecast - by Product Type
- 8. North America Activated Carbon Market Analysis, Insights and Forecast, 2020-2032
- 8.1. Market Analysis, Insights and Forecast - by Product Type
- 8.1.1. Powdered Activated Carbons (PAC)
- 8.1.2. Granular Activated Carbons (GAC)
- 8.1.3. Extruded or Pelletized Activated Carbon
- 8.2. Market Analysis, Insights and Forecast - by Application
- 8.2.1. Gas Purification
- 8.2.2. Water Purification
- 8.2.3. Metal Extraction
- 8.2.4. Medicine
- 8.2.5. Other Applications
- 8.3. Market Analysis, Insights and Forecast - by End-user Industry
- 8.3.1. Water Treatment
- 8.3.2. Food and Beverage
- 8.3.3. Healthcare
- 8.3.4. Automotive
- 8.3.5. Industrial Processing
- 8.3.6. Other End-user Industries
- 8.1. Market Analysis, Insights and Forecast - by Product Type
- 9. Europe Activated Carbon Market Analysis, Insights and Forecast, 2020-2032
- 9.1. Market Analysis, Insights and Forecast - by Product Type
- 9.1.1. Powdered Activated Carbons (PAC)
- 9.1.2. Granular Activated Carbons (GAC)
- 9.1.3. Extruded or Pelletized Activated Carbon
- 9.2. Market Analysis, Insights and Forecast - by Application
- 9.2.1. Gas Purification
- 9.2.2. Water Purification
- 9.2.3. Metal Extraction
- 9.2.4. Medicine
- 9.2.5. Other Applications
- 9.3. Market Analysis, Insights and Forecast - by End-user Industry
- 9.3.1. Water Treatment
- 9.3.2. Food and Beverage
- 9.3.3. Healthcare
- 9.3.4. Automotive
- 9.3.5. Industrial Processing
- 9.3.6. Other End-user Industries
- 9.1. Market Analysis, Insights and Forecast - by Product Type
- 10. South America Activated Carbon Market Analysis, Insights and Forecast, 2020-2032
- 10.1. Market Analysis, Insights and Forecast - by Product Type
- 10.1.1. Powdered Activated Carbons (PAC)
- 10.1.2. Granular Activated Carbons (GAC)
- 10.1.3. Extruded or Pelletized Activated Carbon
- 10.2. Market Analysis, Insights and Forecast - by Application
- 10.2.1. Gas Purification
- 10.2.2. Water Purification
- 10.2.3. Metal Extraction
- 10.2.4. Medicine
- 10.2.5. Other Applications
- 10.3. Market Analysis, Insights and Forecast - by End-user Industry
- 10.3.1. Water Treatment
- 10.3.2. Food and Beverage
- 10.3.3. Healthcare
- 10.3.4. Automotive
- 10.3.5. Industrial Processing
- 10.3.6. Other End-user Industries
- 10.1. Market Analysis, Insights and Forecast - by Product Type
- 11. Middle East and Africa Activated Carbon Market Analysis, Insights and Forecast, 2020-2032
- 11.1. Market Analysis, Insights and Forecast - by Product Type
- 11.1.1. Powdered Activated Carbons (PAC)
- 11.1.2. Granular Activated Carbons (GAC)
- 11.1.3. Extruded or Pelletized Activated Carbon
- 11.2. Market Analysis, Insights and Forecast - by Application
- 11.2.1. Gas Purification
- 11.2.2. Water Purification
- 11.2.3. Metal Extraction
- 11.2.4. Medicine
- 11.2.5. Other Applications
- 11.3. Market Analysis, Insights and Forecast - by End-user Industry
- 11.3.1. Water Treatment
- 11.3.2. Food and Beverage
- 11.3.3. Healthcare
- 11.3.4. Automotive
- 11.3.5. Industrial Processing
- 11.3.6. Other End-user Industries
- 11.1. Market Analysis, Insights and Forecast - by Product Type
- 12. Competitive Analysis
- 12.1. Company Profiles
- 12.1.1 Donau Carbon GmbH
- 12.1.1.1. Company Overview
- 12.1.1.2. Products
- 12.1.1.3. Company Financials
- 12.1.1.4. SWOT Analysis
- 12.1.2 CARBOTECH
- 12.1.2.1. Company Overview
- 12.1.2.2. Products
- 12.1.2.3. Company Financials
- 12.1.2.4. SWOT Analysis
- 12.1.3 Carbon Activated Corporation
- 12.1.3.1. Company Overview
- 12.1.3.2. Products
- 12.1.3.3. Company Financials
- 12.1.3.4. SWOT Analysis
- 12.1.4 Advanced Emissions Solutions Inc
- 12.1.4.1. Company Overview
- 12.1.4.2. Products
- 12.1.4.3. Company Financials
- 12.1.4.4. SWOT Analysis
- 12.1.5 Kuraray Co Ltd
- 12.1.5.1. Company Overview
- 12.1.5.2. Products
- 12.1.5.3. Company Financials
- 12.1.5.4. SWOT Analysis
- 12.1.6 CPL Activated Carbons
- 12.1.6.1. Company Overview
- 12.1.6.2. Products
- 12.1.6.3. Company Financials
- 12.1.6.4. SWOT Analysis
- 12.1.7 Evoqua Water Technologies LLC
- 12.1.7.1. Company Overview
- 12.1.7.2. Products
- 12.1.7.3. Company Financials
- 12.1.7.4. SWOT Analysis
- 12.1.8 Cabot Corporation
- 12.1.8.1. Company Overview
- 12.1.8.2. Products
- 12.1.8.3. Company Financials
- 12.1.8.4. SWOT Analysis
- 12.1.9 Kureha Corporation
- 12.1.9.1. Company Overview
- 12.1.9.2. Products
- 12.1.9.3. Company Financials
- 12.1.9.4. SWOT Analysis
- 12.1.10 Ingevity
- 12.1.10.1. Company Overview
- 12.1.10.2. Products
- 12.1.10.3. Company Financials
- 12.1.10.4. SWOT Analysis
- 12.1.11 Silcarbon Aktivkohle GmbH
- 12.1.11.1. Company Overview
- 12.1.11.2. Products
- 12.1.11.3. Company Financials
- 12.1.11.4. SWOT Analysis
- 12.1.12 Haycarb (Pvt ) Ltd
- 12.1.12.1. Company Overview
- 12.1.12.2. Products
- 12.1.12.3. Company Financials
- 12.1.12.4. SWOT Analysis
- 12.1.13 Puragen Activated Carbons
- 12.1.13.1. Company Overview
- 12.1.13.2. Products
- 12.1.13.3. Company Financials
- 12.1.13.4. SWOT Analysis
- 12.1.14 Jacobi Carbons Group
- 12.1.14.1. Company Overview
- 12.1.14.2. Products
- 12.1.14.3. Company Financials
- 12.1.14.4. SWOT Analysis
- 12.1.15 Albemarle Corporation
- 12.1.15.1. Company Overview
- 12.1.15.2. Products
- 12.1.15.3. Company Financials
- 12.1.15.4. SWOT Analysis
- 12.1.16 Veolia (Veolia Water Technologies)*List Not Exhaustive
- 12.1.16.1. Company Overview
- 12.1.16.2. Products
- 12.1.16.3. Company Financials
- 12.1.16.4. SWOT Analysis
- 12.1.1 Donau Carbon GmbH
- 12.2. Market Entropy
- 12.2.1 Company's Key Areas Served
- 12.2.2 Recent Developments
- 12.3. Company Market Share Analysis 2025
- 12.3.1 Top 5 Companies Market Share Analysis
- 12.3.2 Top 3 Companies Market Share Analysis
- 12.4. List of Potential Customers
- 13. Research Methodology
List of Figures
- Figure 1: Global Activated Carbon Market Revenue Breakdown (Million, %) by Region 2025 & 2033
- Figure 2: Asia Pacific Activated Carbon Market Revenue (Million), by Product Type 2025 & 2033
- Figure 3: Asia Pacific Activated Carbon Market Revenue Share (%), by Product Type 2025 & 2033
- Figure 4: Asia Pacific Activated Carbon Market Revenue (Million), by Application 2025 & 2033
- Figure 5: Asia Pacific Activated Carbon Market Revenue Share (%), by Application 2025 & 2033
- Figure 6: Asia Pacific Activated Carbon Market Revenue (Million), by End-user Industry 2025 & 2033
- Figure 7: Asia Pacific Activated Carbon Market Revenue Share (%), by End-user Industry 2025 & 2033
- Figure 8: Asia Pacific Activated Carbon Market Revenue (Million), by Country 2025 & 2033
- Figure 9: Asia Pacific Activated Carbon Market Revenue Share (%), by Country 2025 & 2033
- Figure 10: North America Activated Carbon Market Revenue (Million), by Product Type 2025 & 2033
- Figure 11: North America Activated Carbon Market Revenue Share (%), by Product Type 2025 & 2033
- Figure 12: North America Activated Carbon Market Revenue (Million), by Application 2025 & 2033
- Figure 13: North America Activated Carbon Market Revenue Share (%), by Application 2025 & 2033
- Figure 14: North America Activated Carbon Market Revenue (Million), by End-user Industry 2025 & 2033
- Figure 15: North America Activated Carbon Market Revenue Share (%), by End-user Industry 2025 & 2033
- Figure 16: North America Activated Carbon Market Revenue (Million), by Country 2025 & 2033
- Figure 17: North America Activated Carbon Market Revenue Share (%), by Country 2025 & 2033
- Figure 18: Europe Activated Carbon Market Revenue (Million), by Product Type 2025 & 2033
- Figure 19: Europe Activated Carbon Market Revenue Share (%), by Product Type 2025 & 2033
- Figure 20: Europe Activated Carbon Market Revenue (Million), by Application 2025 & 2033
- Figure 21: Europe Activated Carbon Market Revenue Share (%), by Application 2025 & 2033
- Figure 22: Europe Activated Carbon Market Revenue (Million), by End-user Industry 2025 & 2033
- Figure 23: Europe Activated Carbon Market Revenue Share (%), by End-user Industry 2025 & 2033
- Figure 24: Europe Activated Carbon Market Revenue (Million), by Country 2025 & 2033
- Figure 25: Europe Activated Carbon Market Revenue Share (%), by Country 2025 & 2033
- Figure 26: South America Activated Carbon Market Revenue (Million), by Product Type 2025 & 2033
- Figure 27: South America Activated Carbon Market Revenue Share (%), by Product Type 2025 & 2033
- Figure 28: South America Activated Carbon Market Revenue (Million), by Application 2025 & 2033
- Figure 29: South America Activated Carbon Market Revenue Share (%), by Application 2025 & 2033
- Figure 30: South America Activated Carbon Market Revenue (Million), by End-user Industry 2025 & 2033
- Figure 31: South America Activated Carbon Market Revenue Share (%), by End-user Industry 2025 & 2033
- Figure 32: South America Activated Carbon Market Revenue (Million), by Country 2025 & 2033
- Figure 33: South America Activated Carbon Market Revenue Share (%), by Country 2025 & 2033
- Figure 34: Middle East and Africa Activated Carbon Market Revenue (Million), by Product Type 2025 & 2033
- Figure 35: Middle East and Africa Activated Carbon Market Revenue Share (%), by Product Type 2025 & 2033
- Figure 36: Middle East and Africa Activated Carbon Market Revenue (Million), by Application 2025 & 2033
- Figure 37: Middle East and Africa Activated Carbon Market Revenue Share (%), by Application 2025 & 2033
- Figure 38: Middle East and Africa Activated Carbon Market Revenue (Million), by End-user Industry 2025 & 2033
- Figure 39: Middle East and Africa Activated Carbon Market Revenue Share (%), by End-user Industry 2025 & 2033
- Figure 40: Middle East and Africa Activated Carbon Market Revenue (Million), by Country 2025 & 2033
- Figure 41: Middle East and Africa Activated Carbon Market Revenue Share (%), by Country 2025 & 2033
List of Tables
- Table 1: Global Activated Carbon Market Revenue Million Forecast, by Product Type 2020 & 2033
- Table 2: Global Activated Carbon Market Revenue Million Forecast, by Application 2020 & 2033
- Table 3: Global Activated Carbon Market Revenue Million Forecast, by End-user Industry 2020 & 2033
- Table 4: Global Activated Carbon Market Revenue Million Forecast, by Region 2020 & 2033
- Table 5: Global Activated Carbon Market Revenue Million Forecast, by Product Type 2020 & 2033
- Table 6: Global Activated Carbon Market Revenue Million Forecast, by Application 2020 & 2033
- Table 7: Global Activated Carbon Market Revenue Million Forecast, by End-user Industry 2020 & 2033
- Table 8: Global Activated Carbon Market Revenue Million Forecast, by Country 2020 & 2033
- Table 9: China Activated Carbon Market Revenue (Million) Forecast, by Application 2020 & 2033
- Table 10: India Activated Carbon Market Revenue (Million) Forecast, by Application 2020 & 2033
- Table 11: Japan Activated Carbon Market Revenue (Million) Forecast, by Application 2020 & 2033
- Table 12: South Korea Activated Carbon Market Revenue (Million) Forecast, by Application 2020 & 2033
- Table 13: Rest of Asia Pacific Activated Carbon Market Revenue (Million) Forecast, by Application 2020 & 2033
- Table 14: Global Activated Carbon Market Revenue Million Forecast, by Product Type 2020 & 2033
- Table 15: Global Activated Carbon Market Revenue Million Forecast, by Application 2020 & 2033
- Table 16: Global Activated Carbon Market Revenue Million Forecast, by End-user Industry 2020 & 2033
- Table 17: Global Activated Carbon Market Revenue Million Forecast, by Country 2020 & 2033
- Table 18: United States Activated Carbon Market Revenue (Million) Forecast, by Application 2020 & 2033
- Table 19: Canada Activated Carbon Market Revenue (Million) Forecast, by Application 2020 & 2033
- Table 20: Mexico Activated Carbon Market Revenue (Million) Forecast, by Application 2020 & 2033
- Table 21: Global Activated Carbon Market Revenue Million Forecast, by Product Type 2020 & 2033
- Table 22: Global Activated Carbon Market Revenue Million Forecast, by Application 2020 & 2033
- Table 23: Global Activated Carbon Market Revenue Million Forecast, by End-user Industry 2020 & 2033
- Table 24: Global Activated Carbon Market Revenue Million Forecast, by Country 2020 & 2033
- Table 25: Germany Activated Carbon Market Revenue (Million) Forecast, by Application 2020 & 2033
- Table 26: United Kingdom Activated Carbon Market Revenue (Million) Forecast, by Application 2020 & 2033
- Table 27: France Activated Carbon Market Revenue (Million) Forecast, by Application 2020 & 2033
- Table 28: Italy Activated Carbon Market Revenue (Million) Forecast, by Application 2020 & 2033
- Table 29: Spain Activated Carbon Market Revenue (Million) Forecast, by Application 2020 & 2033
- Table 30: Rest of Europe Activated Carbon Market Revenue (Million) Forecast, by Application 2020 & 2033
- Table 31: Global Activated Carbon Market Revenue Million Forecast, by Product Type 2020 & 2033
- Table 32: Global Activated Carbon Market Revenue Million Forecast, by Application 2020 & 2033
- Table 33: Global Activated Carbon Market Revenue Million Forecast, by End-user Industry 2020 & 2033
- Table 34: Global Activated Carbon Market Revenue Million Forecast, by Country 2020 & 2033
- Table 35: Brazil Activated Carbon Market Revenue (Million) Forecast, by Application 2020 & 2033
- Table 36: Argentina Activated Carbon Market Revenue (Million) Forecast, by Application 2020 & 2033
- Table 37: Rest of South America Activated Carbon Market Revenue (Million) Forecast, by Application 2020 & 2033
- Table 38: Global Activated Carbon Market Revenue Million Forecast, by Product Type 2020 & 2033
- Table 39: Global Activated Carbon Market Revenue Million Forecast, by Application 2020 & 2033
- Table 40: Global Activated Carbon Market Revenue Million Forecast, by End-user Industry 2020 & 2033
- Table 41: Global Activated Carbon Market Revenue Million Forecast, by Country 2020 & 2033
- Table 42: Saudi Arabia Activated Carbon Market Revenue (Million) Forecast, by Application 2020 & 2033
- Table 43: South Africa Activated Carbon Market Revenue (Million) Forecast, by Application 2020 & 2033
- Table 44: Rest of Middle East and Africa Activated Carbon Market Revenue (Million) Forecast, by Application 2020 & 2033
Frequently Asked Questions
1. What is the projected Compound Annual Growth Rate (CAGR) of the Activated Carbon Market?
The projected CAGR is approximately 5.95%.
2. Which companies are prominent players in the Activated Carbon Market?
Key companies in the market include Donau Carbon GmbH, CARBOTECH, Carbon Activated Corporation, Advanced Emissions Solutions Inc, Kuraray Co Ltd, CPL Activated Carbons, Evoqua Water Technologies LLC, Cabot Corporation, Kureha Corporation, Ingevity, Silcarbon Aktivkohle GmbH, Haycarb (Pvt ) Ltd, Puragen Activated Carbons, Jacobi Carbons Group, Albemarle Corporation, Veolia (Veolia Water Technologies)*List Not Exhaustive.
3. What are the main segments of the Activated Carbon Market?
The market segments include Product Type, Application, End-user Industry.
4. Can you provide details about the market size?
The market size is estimated to be USD 4.32 Million as of 2022.
5. What are some drivers contributing to market growth?
Conformance to Stringent Environmental Regulations in Water Treatment Applications in the United States; Augmenting Prominence for Air Pollution Control (Especially Mercury Removal).
6. What are the notable trends driving market growth?
Water Treatment Industry to Dominate the Market.
7. Are there any restraints impacting market growth?
Narrower Markets Due to Increased Costs of Some Grades of Activated Carbon; Threat of Substitutes Like Silica Gel and Development of Better Alternatives.
8. Can you provide examples of recent developments in the market?
March 2022: Cabot Corporation sold off its activated carbon unit, Norit Activated Carbon, to One Equity Partners. Following the divestiture, Norit Activated Carbon became an independent company serving its customers with a broad portfolio of activated carbon solutions through its ten production facilities in seven countries.
9. What pricing options are available for accessing the report?
Pricing options include single-user, multi-user, and enterprise licenses priced at USD 4750, USD 5250, and USD 8750 respectively.
10. Is the market size provided in terms of value or volume?
The market size is provided in terms of value, measured in Million.
11. Are there any specific market keywords associated with the report?
Yes, the market keyword associated with the report is "Activated Carbon Market," which aids in identifying and referencing the specific market segment covered.
12. How do I determine which pricing option suits my needs best?
The pricing options vary based on user requirements and access needs. Individual users may opt for single-user licenses, while businesses requiring broader access may choose multi-user or enterprise licenses for cost-effective access to the report.
13. Are there any additional resources or data provided in the Activated Carbon Market report?
While the report offers comprehensive insights, it's advisable to review the specific contents or supplementary materials provided to ascertain if additional resources or data are available.
14. How can I stay updated on further developments or reports in the Activated Carbon Market?
To stay informed about further developments, trends, and reports in the Activated Carbon Market, consider subscribing to industry newsletters, following relevant companies and organizations, or regularly checking reputable industry news sources and publications.
Methodology
Step 1 - Identification of Relevant Samples Size from Population Database


Step 2 - Approaches for Defining Global Market Size (Value, Volume* & Price*)

Note*: In applicable scenarios
Step 3 - Data Sources
Primary Research
- Web Analytics
- Survey Reports
- Research Institute
- Latest Research Reports
- Opinion Leaders
Secondary Research
- Annual Reports
- White Paper
- Latest Press Release
- Industry Association
- Paid Database
- Investor Presentations

Step 4 - Data Triangulation
Involves using different sources of information in order to increase the validity of a study
These sources are likely to be stakeholders in a program - participants, other researchers, program staff, other community members, and so on.
Then we put all data in single framework & apply various statistical tools to find out the dynamic on the market.
During the analysis stage, feedback from the stakeholder groups would be compared to determine areas of agreement as well as areas of divergence