


Key Insights
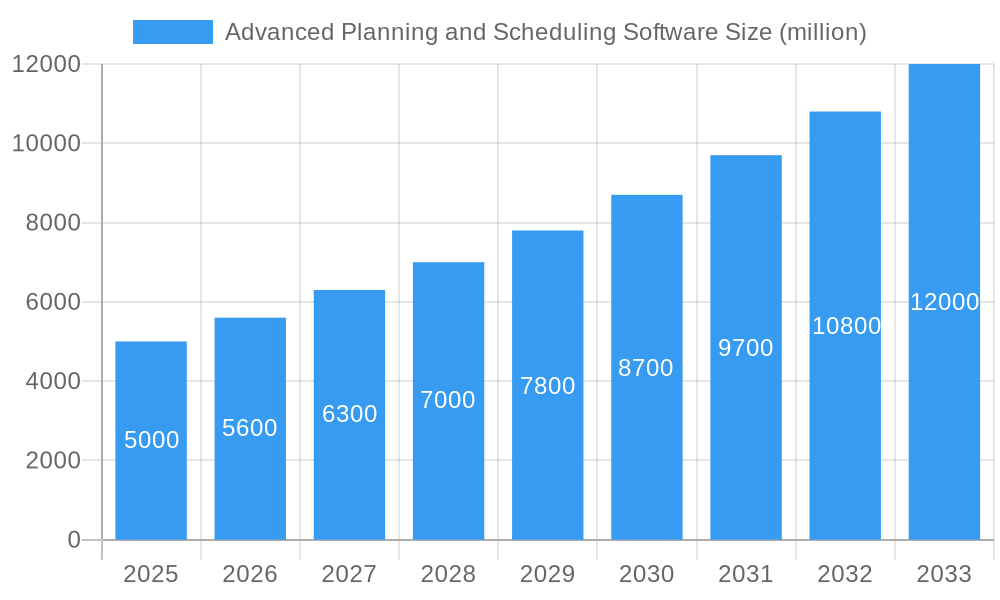
The Advanced Planning and Scheduling (APS) software market is experiencing robust growth, driven by the increasing need for efficient supply chain management and optimized production processes across diverse industries. The market, currently valued at approximately $5 billion in 2025, is projected to experience a Compound Annual Growth Rate (CAGR) of 12% from 2025 to 2033, reaching an estimated market size of $12 billion by 2033. This expansion is fueled by several key factors. Firstly, the growing adoption of Industry 4.0 technologies, including cloud computing and the Internet of Things (IoT), is significantly enhancing the capabilities and accessibility of APS solutions. Secondly, increasing pressure to reduce operational costs, improve on-time delivery, and enhance customer satisfaction is pushing businesses to adopt sophisticated planning and scheduling tools. Finally, the rising complexity of global supply chains necessitates advanced solutions to anticipate and mitigate disruptions. Key trends shaping the market include the integration of artificial intelligence (AI) and machine learning (ML) for predictive analytics and automation, the rise of cloud-based APS solutions for enhanced scalability and accessibility, and the growing demand for APS in smaller and medium-sized enterprises (SMEs). However, the market also faces restraints such as high implementation costs, the need for skilled personnel, and the integration challenges with existing enterprise resource planning (ERP) systems.
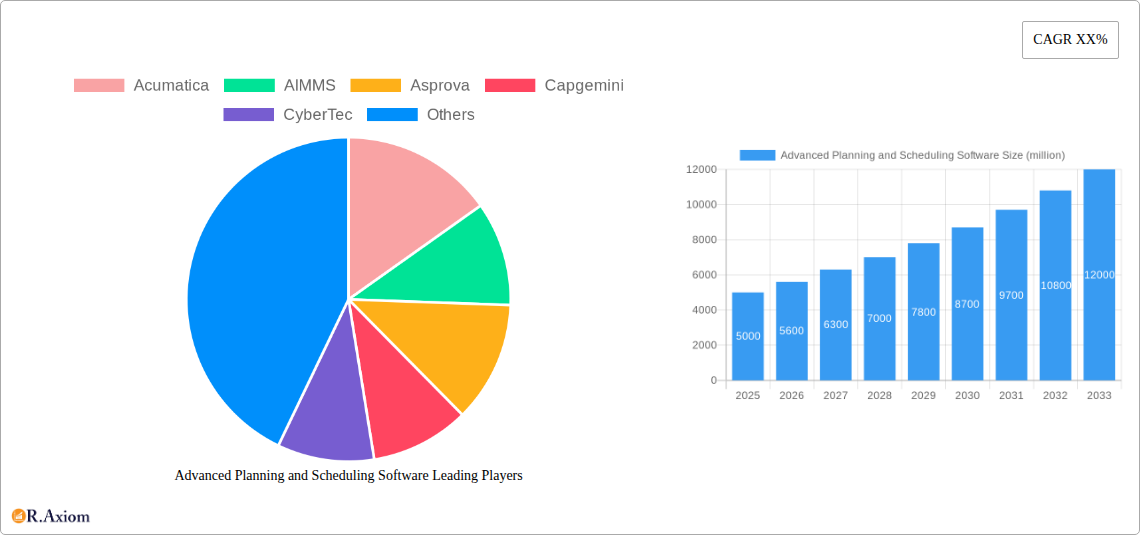
Advanced Planning and Scheduling Software Market Size (In Billion)

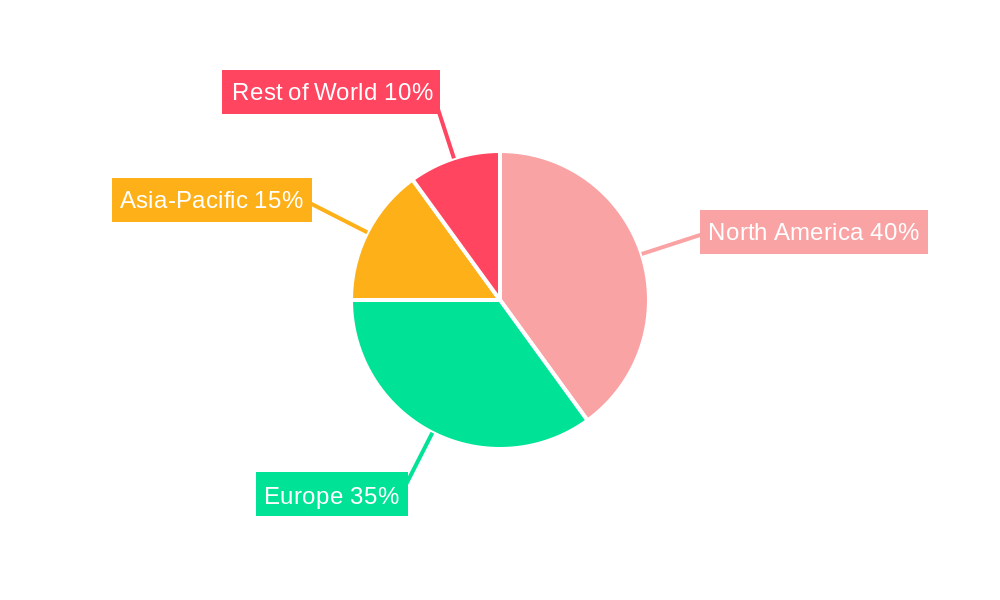
The competitive landscape is characterized by a mix of established players like SAP, Oracle, and Siemens, alongside specialized APS vendors such as Acumatica, AIMMS, and Plex Systems. These companies are constantly innovating and expanding their product offerings to cater to the evolving needs of various industries. Significant regional variations exist, with North America and Europe currently dominating the market due to early adoption and technological advancements. However, the Asia-Pacific region is expected to witness significant growth in the coming years, driven by increasing industrialization and economic development. The success of vendors depends on their ability to offer tailored solutions, provide robust customer support, and effectively address the unique challenges faced by different industries and geographies. This includes focusing on user-friendly interfaces, seamless integration with existing systems, and the provision of comprehensive training and support.
Advanced Planning and Scheduling Software Company Market Share
Advanced Planning and Scheduling Software Market Report: 2019-2033
This comprehensive report provides an in-depth analysis of the Advanced Planning and Scheduling (APS) software market, offering invaluable insights for stakeholders across the industry. The study covers the period 2019-2033, with a focus on the base year 2025 and a forecast period of 2025-2033. The report leverages extensive data from the historical period (2019-2024) to project future market trends and growth trajectories, estimating a market value reaching xx million by 2033.
Advanced Planning and Scheduling Software Market Concentration & Innovation
The Advanced Planning and Scheduling (APS) software market exhibits a moderately concentrated landscape, with key players like SAP, Oracle, and Dassault Systèmes holding significant market share. However, the market also features a number of agile, specialized players offering niche solutions. Market concentration is further influenced by ongoing mergers and acquisitions (M&A) activity. In the period 2019-2024, M&A deal values totalled approximately $xx million, highlighting consolidation trends. Innovation within the APS sector is driven by the need for enhanced functionalities including AI-powered predictive analytics, improved integration with IoT devices, and cloud-based deployment models. Regulatory frameworks, particularly those related to data privacy and security, significantly impact the market. The increasing availability of cloud-based alternatives presents a strong substitute to traditional on-premise deployments. End-user trends lean towards solutions that offer greater flexibility, scalability, and real-time visibility across the supply chain.
- Market Share (2024 Estimate): SAP (xx%), Oracle (xx%), Dassault Systèmes (xx%), others (xx%).
- M&A Activity (2019-2024): Total deal value approximately $xx million; average deal size $xx million.
- Key Innovation Drivers: AI/ML integration, Cloud deployment, improved visualization and reporting.
Advanced Planning and Scheduling Software Industry Trends & Insights
The APS software market is experiencing robust growth, driven by the increasing need for efficient supply chain management and optimized production processes across diverse industries. The Compound Annual Growth Rate (CAGR) for the period 2025-2033 is projected at xx%, fueled by several key factors. Technological disruptions, particularly the rise of cloud computing and the adoption of advanced analytics, are reshaping the market landscape. Consumer preferences are shifting towards user-friendly interfaces, seamless integrations, and personalized solutions tailored to specific business needs. Competitive dynamics are characterized by both intense rivalry among established players and the emergence of innovative startups offering specialized APS solutions. Market penetration is currently estimated at xx% and is projected to reach xx% by 2033. This growth is significantly boosted by the increasing adoption of Industry 4.0 principles and the need for real-time decision support. The shift towards digitization across multiple sectors is another key trend propelling the growth of the APS software market.
Dominant Markets & Segments in Advanced Planning and Scheduling Software
The North American market currently holds the dominant position in the global APS software market, driven by the high adoption rate across various sectors, strong technological infrastructure, and a robust economy.
- Key Drivers for North American Dominance:
- Advanced technological infrastructure
- High level of industrial automation
- Strong focus on supply chain optimization
- High disposable income and investment in technological solutions
- Favorable regulatory environment promoting technology adoption
The strong presence of key players and large-scale deployment across manufacturing, logistics and retail are further contributing factors. Europe and Asia Pacific are also showing significant growth, albeit at a slightly slower pace compared to North America. The dominance of North America is anticipated to continue throughout the forecast period, although other regions are expected to demonstrate a significant increase in market share driven by rapid technological advancement and increasing industrialization in developing economies.
Advanced Planning and Scheduling Software Product Developments
Recent product innovations in APS software have focused on incorporating advanced analytics, machine learning, and artificial intelligence to enhance forecasting accuracy and optimize planning decisions. Cloud-based solutions are gaining significant traction, offering flexibility, scalability, and reduced IT infrastructure costs. The integration of APS systems with other enterprise resource planning (ERP) and supply chain management (SCM) software is becoming increasingly important, enabling seamless data flow and holistic visibility across the entire business ecosystem. Competitive advantages are derived from offering superior analytics, ease of use, flexible deployment options, and robust customer support. The market increasingly favors solutions that provide real-time insights and predictive capabilities to facilitate proactive decision-making.
Report Scope & Segmentation Analysis
This report segments the Advanced Planning and Scheduling software market by deployment mode (cloud, on-premise), organization size (small, medium, large enterprises), industry vertical (manufacturing, retail, logistics, healthcare, others), and geography. The cloud-based segment is projected to witness significant growth due to its flexibility and cost-effectiveness. The manufacturing sector remains the largest end-user of APS software, driven by the demand for efficient production planning and inventory management. Detailed market size projections and competitive dynamics are presented for each segment. The market size in millions is projected as follows: Cloud (xx million), On-premise (xx million); Manufacturing (xx million), Retail (xx million), Logistics (xx million), others (xx million).
Key Drivers of Advanced Planning and Scheduling Software Growth
Several factors are driving the growth of the APS software market. Firstly, the increasing complexity of global supply chains necessitates advanced planning and scheduling tools to optimize operations and minimize disruptions. Secondly, the growing adoption of Industry 4.0 principles and the associated rise of IoT devices generate vast amounts of data, which APS software can analyze to provide actionable insights. Finally, the escalating demand for improved supply chain visibility and real-time decision-making across diverse industries drives adoption of the sophisticated APS software.
Challenges in the Advanced Planning and Scheduling Software Sector
The APS software market faces several challenges. The high initial investment cost of implementing an APS system can be a barrier for small and medium-sized enterprises. The need for specialized skills and expertise to effectively use and maintain APS systems adds complexity. Integrating APS software with existing legacy systems can be technically challenging and time-consuming. Furthermore, ensuring data security and privacy in an increasingly interconnected world is crucial and poses a significant challenge. These factors can limit market penetration, especially in emerging economies. The estimated total cost of addressing these challenges within the forecast period is xx million.
Emerging Opportunities in Advanced Planning and Scheduling Software
The APS software market offers several exciting opportunities. The increasing adoption of artificial intelligence (AI) and machine learning (ML) for predictive analytics is opening new avenues for enhancing forecasting accuracy and optimizing resource allocation. The integration of blockchain technology has the potential to improve supply chain transparency and traceability. Expanding into untapped markets in developing economies presents significant growth potential. Moreover, the development of specialized APS solutions tailored to the unique needs of specific industries can create new market niches.
Leading Players in the Advanced Planning and Scheduling Software Market
- Acumatica
- AIMMS
- Asprova
- Capgemini
- CyberTec
- Dassault Systèmes
- Global Shop Solutions
- INFORM
- MRPeasy
- Oracle
- ORTEC
- Plex Systems
- SAP
- Siemens
- Simio
Key Developments in Advanced Planning and Scheduling Software Industry
- 2022 Q4: SAP launched its enhanced cloud-based APS solution.
- 2023 Q1: Oracle announced a strategic partnership with a leading logistics provider to integrate its APS software.
- 2023 Q2: Dassault Systèmes acquired a smaller APS software vendor, expanding its market reach.
- 2024 Q1: Plex Systems released a new version of its APS software with AI-powered features. (Further developments to be added as they occur)
Strategic Outlook for Advanced Planning and Scheduling Software Market
The Advanced Planning and Scheduling software market is poised for continued strong growth over the forecast period, driven by increasing digitalization, the rising adoption of Industry 4.0 principles, and the escalating demand for efficient and resilient supply chains. The integration of AI, ML, and other advanced technologies will further enhance the capabilities of APS software, providing businesses with valuable insights and improved decision-making tools. The market's future growth is significantly dependent on ongoing innovation and the ability of vendors to adapt to the ever-evolving needs of businesses across various industry verticals. The market is expected to remain competitive, with ongoing M&A activity and the emergence of new players.
Advanced Planning and Scheduling Software Segmentation
-
1. Application
- 1.1. Large Enterprises
- 1.2. SMEs
-
2. Types
- 2.1. On-premises
- 2.2. Web Based
Advanced Planning and Scheduling Software Segmentation By Geography
-
1. North America
- 1.1. United States
- 1.2. Canada
- 1.3. Mexico
-
2. South America
- 2.1. Brazil
- 2.2. Argentina
- 2.3. Rest of South America
-
3. Europe
- 3.1. United Kingdom
- 3.2. Germany
- 3.3. France
- 3.4. Italy
- 3.5. Spain
- 3.6. Russia
- 3.7. Benelux
- 3.8. Nordics
- 3.9. Rest of Europe
-
4. Middle East & Africa
- 4.1. Turkey
- 4.2. Israel
- 4.3. GCC
- 4.4. North Africa
- 4.5. South Africa
- 4.6. Rest of Middle East & Africa
-
5. Asia Pacific
- 5.1. China
- 5.2. India
- 5.3. Japan
- 5.4. South Korea
- 5.5. ASEAN
- 5.6. Oceania
- 5.7. Rest of Asia Pacific
Advanced Planning and Scheduling Software Regional Market Share
Geographic Coverage of Advanced Planning and Scheduling Software
Advanced Planning and Scheduling Software REPORT HIGHLIGHTS
| Aspects | Details |
|---|---|
| Study Period | 2020-2034 |
| Base Year | 2025 |
| Estimated Year | 2026 |
| Forecast Period | 2026-2034 |
| Historical Period | 2020-2025 |
| Growth Rate | CAGR of 8.06% from 2020-2034 |
| Segmentation |
|
Table of Contents
- 1. Introduction
- 1.1. Research Scope
- 1.2. Market Segmentation
- 1.3. Research Methodology
- 1.4. Definitions and Assumptions
- 2. Executive Summary
- 2.1. Introduction
- 3. Market Dynamics
- 3.1. Introduction
- 3.2. Market Drivers
- 3.3. Market Restrains
- 3.4. Market Trends
- 4. Market Factor Analysis
- 4.1. Porters Five Forces
- 4.2. Supply/Value Chain
- 4.3. PESTEL analysis
- 4.4. Market Entropy
- 4.5. Patent/Trademark Analysis
- 5. Global Advanced Planning and Scheduling Software Analysis, Insights and Forecast, 2020-2032
- 5.1. Market Analysis, Insights and Forecast - by Application
- 5.1.1. Large Enterprises
- 5.1.2. SMEs
- 5.2. Market Analysis, Insights and Forecast - by Types
- 5.2.1. On-premises
- 5.2.2. Web Based
- 5.3. Market Analysis, Insights and Forecast - by Region
- 5.3.1. North America
- 5.3.2. South America
- 5.3.3. Europe
- 5.3.4. Middle East & Africa
- 5.3.5. Asia Pacific
- 5.1. Market Analysis, Insights and Forecast - by Application
- 6. North America Advanced Planning and Scheduling Software Analysis, Insights and Forecast, 2020-2032
- 6.1. Market Analysis, Insights and Forecast - by Application
- 6.1.1. Large Enterprises
- 6.1.2. SMEs
- 6.2. Market Analysis, Insights and Forecast - by Types
- 6.2.1. On-premises
- 6.2.2. Web Based
- 6.1. Market Analysis, Insights and Forecast - by Application
- 7. South America Advanced Planning and Scheduling Software Analysis, Insights and Forecast, 2020-2032
- 7.1. Market Analysis, Insights and Forecast - by Application
- 7.1.1. Large Enterprises
- 7.1.2. SMEs
- 7.2. Market Analysis, Insights and Forecast - by Types
- 7.2.1. On-premises
- 7.2.2. Web Based
- 7.1. Market Analysis, Insights and Forecast - by Application
- 8. Europe Advanced Planning and Scheduling Software Analysis, Insights and Forecast, 2020-2032
- 8.1. Market Analysis, Insights and Forecast - by Application
- 8.1.1. Large Enterprises
- 8.1.2. SMEs
- 8.2. Market Analysis, Insights and Forecast - by Types
- 8.2.1. On-premises
- 8.2.2. Web Based
- 8.1. Market Analysis, Insights and Forecast - by Application
- 9. Middle East & Africa Advanced Planning and Scheduling Software Analysis, Insights and Forecast, 2020-2032
- 9.1. Market Analysis, Insights and Forecast - by Application
- 9.1.1. Large Enterprises
- 9.1.2. SMEs
- 9.2. Market Analysis, Insights and Forecast - by Types
- 9.2.1. On-premises
- 9.2.2. Web Based
- 9.1. Market Analysis, Insights and Forecast - by Application
- 10. Asia Pacific Advanced Planning and Scheduling Software Analysis, Insights and Forecast, 2020-2032
- 10.1. Market Analysis, Insights and Forecast - by Application
- 10.1.1. Large Enterprises
- 10.1.2. SMEs
- 10.2. Market Analysis, Insights and Forecast - by Types
- 10.2.1. On-premises
- 10.2.2. Web Based
- 10.1. Market Analysis, Insights and Forecast - by Application
- 11. Competitive Analysis
- 11.1. Global Market Share Analysis 2025
- 11.2. Company Profiles
- 11.2.1 Acumatica
- 11.2.1.1. Overview
- 11.2.1.2. Products
- 11.2.1.3. SWOT Analysis
- 11.2.1.4. Recent Developments
- 11.2.1.5. Financials (Based on Availability)
- 11.2.2 AIMMS
- 11.2.2.1. Overview
- 11.2.2.2. Products
- 11.2.2.3. SWOT Analysis
- 11.2.2.4. Recent Developments
- 11.2.2.5. Financials (Based on Availability)
- 11.2.3 Asprova
- 11.2.3.1. Overview
- 11.2.3.2. Products
- 11.2.3.3. SWOT Analysis
- 11.2.3.4. Recent Developments
- 11.2.3.5. Financials (Based on Availability)
- 11.2.4 Capgemini
- 11.2.4.1. Overview
- 11.2.4.2. Products
- 11.2.4.3. SWOT Analysis
- 11.2.4.4. Recent Developments
- 11.2.4.5. Financials (Based on Availability)
- 11.2.5 CyberTec
- 11.2.5.1. Overview
- 11.2.5.2. Products
- 11.2.5.3. SWOT Analysis
- 11.2.5.4. Recent Developments
- 11.2.5.5. Financials (Based on Availability)
- 11.2.6 Dassault Systemes
- 11.2.6.1. Overview
- 11.2.6.2. Products
- 11.2.6.3. SWOT Analysis
- 11.2.6.4. Recent Developments
- 11.2.6.5. Financials (Based on Availability)
- 11.2.7 Global Shop Solutions
- 11.2.7.1. Overview
- 11.2.7.2. Products
- 11.2.7.3. SWOT Analysis
- 11.2.7.4. Recent Developments
- 11.2.7.5. Financials (Based on Availability)
- 11.2.8 INFORM
- 11.2.8.1. Overview
- 11.2.8.2. Products
- 11.2.8.3. SWOT Analysis
- 11.2.8.4. Recent Developments
- 11.2.8.5. Financials (Based on Availability)
- 11.2.9 MRPeasy
- 11.2.9.1. Overview
- 11.2.9.2. Products
- 11.2.9.3. SWOT Analysis
- 11.2.9.4. Recent Developments
- 11.2.9.5. Financials (Based on Availability)
- 11.2.10 Oracle
- 11.2.10.1. Overview
- 11.2.10.2. Products
- 11.2.10.3. SWOT Analysis
- 11.2.10.4. Recent Developments
- 11.2.10.5. Financials (Based on Availability)
- 11.2.11 ORTEC
- 11.2.11.1. Overview
- 11.2.11.2. Products
- 11.2.11.3. SWOT Analysis
- 11.2.11.4. Recent Developments
- 11.2.11.5. Financials (Based on Availability)
- 11.2.12 Plex Systems
- 11.2.12.1. Overview
- 11.2.12.2. Products
- 11.2.12.3. SWOT Analysis
- 11.2.12.4. Recent Developments
- 11.2.12.5. Financials (Based on Availability)
- 11.2.13 SAP
- 11.2.13.1. Overview
- 11.2.13.2. Products
- 11.2.13.3. SWOT Analysis
- 11.2.13.4. Recent Developments
- 11.2.13.5. Financials (Based on Availability)
- 11.2.14 Siemens
- 11.2.14.1. Overview
- 11.2.14.2. Products
- 11.2.14.3. SWOT Analysis
- 11.2.14.4. Recent Developments
- 11.2.14.5. Financials (Based on Availability)
- 11.2.15 Simio
- 11.2.15.1. Overview
- 11.2.15.2. Products
- 11.2.15.3. SWOT Analysis
- 11.2.15.4. Recent Developments
- 11.2.15.5. Financials (Based on Availability)
- 11.2.1 Acumatica
List of Figures
- Figure 1: Global Advanced Planning and Scheduling Software Revenue Breakdown (undefined, %) by Region 2025 & 2033
- Figure 2: North America Advanced Planning and Scheduling Software Revenue (undefined), by Application 2025 & 2033
- Figure 3: North America Advanced Planning and Scheduling Software Revenue Share (%), by Application 2025 & 2033
- Figure 4: North America Advanced Planning and Scheduling Software Revenue (undefined), by Types 2025 & 2033
- Figure 5: North America Advanced Planning and Scheduling Software Revenue Share (%), by Types 2025 & 2033
- Figure 6: North America Advanced Planning and Scheduling Software Revenue (undefined), by Country 2025 & 2033
- Figure 7: North America Advanced Planning and Scheduling Software Revenue Share (%), by Country 2025 & 2033
- Figure 8: South America Advanced Planning and Scheduling Software Revenue (undefined), by Application 2025 & 2033
- Figure 9: South America Advanced Planning and Scheduling Software Revenue Share (%), by Application 2025 & 2033
- Figure 10: South America Advanced Planning and Scheduling Software Revenue (undefined), by Types 2025 & 2033
- Figure 11: South America Advanced Planning and Scheduling Software Revenue Share (%), by Types 2025 & 2033
- Figure 12: South America Advanced Planning and Scheduling Software Revenue (undefined), by Country 2025 & 2033
- Figure 13: South America Advanced Planning and Scheduling Software Revenue Share (%), by Country 2025 & 2033
- Figure 14: Europe Advanced Planning and Scheduling Software Revenue (undefined), by Application 2025 & 2033
- Figure 15: Europe Advanced Planning and Scheduling Software Revenue Share (%), by Application 2025 & 2033
- Figure 16: Europe Advanced Planning and Scheduling Software Revenue (undefined), by Types 2025 & 2033
- Figure 17: Europe Advanced Planning and Scheduling Software Revenue Share (%), by Types 2025 & 2033
- Figure 18: Europe Advanced Planning and Scheduling Software Revenue (undefined), by Country 2025 & 2033
- Figure 19: Europe Advanced Planning and Scheduling Software Revenue Share (%), by Country 2025 & 2033
- Figure 20: Middle East & Africa Advanced Planning and Scheduling Software Revenue (undefined), by Application 2025 & 2033
- Figure 21: Middle East & Africa Advanced Planning and Scheduling Software Revenue Share (%), by Application 2025 & 2033
- Figure 22: Middle East & Africa Advanced Planning and Scheduling Software Revenue (undefined), by Types 2025 & 2033
- Figure 23: Middle East & Africa Advanced Planning and Scheduling Software Revenue Share (%), by Types 2025 & 2033
- Figure 24: Middle East & Africa Advanced Planning and Scheduling Software Revenue (undefined), by Country 2025 & 2033
- Figure 25: Middle East & Africa Advanced Planning and Scheduling Software Revenue Share (%), by Country 2025 & 2033
- Figure 26: Asia Pacific Advanced Planning and Scheduling Software Revenue (undefined), by Application 2025 & 2033
- Figure 27: Asia Pacific Advanced Planning and Scheduling Software Revenue Share (%), by Application 2025 & 2033
- Figure 28: Asia Pacific Advanced Planning and Scheduling Software Revenue (undefined), by Types 2025 & 2033
- Figure 29: Asia Pacific Advanced Planning and Scheduling Software Revenue Share (%), by Types 2025 & 2033
- Figure 30: Asia Pacific Advanced Planning and Scheduling Software Revenue (undefined), by Country 2025 & 2033
- Figure 31: Asia Pacific Advanced Planning and Scheduling Software Revenue Share (%), by Country 2025 & 2033
List of Tables
- Table 1: Global Advanced Planning and Scheduling Software Revenue undefined Forecast, by Application 2020 & 2033
- Table 2: Global Advanced Planning and Scheduling Software Revenue undefined Forecast, by Types 2020 & 2033
- Table 3: Global Advanced Planning and Scheduling Software Revenue undefined Forecast, by Region 2020 & 2033
- Table 4: Global Advanced Planning and Scheduling Software Revenue undefined Forecast, by Application 2020 & 2033
- Table 5: Global Advanced Planning and Scheduling Software Revenue undefined Forecast, by Types 2020 & 2033
- Table 6: Global Advanced Planning and Scheduling Software Revenue undefined Forecast, by Country 2020 & 2033
- Table 7: United States Advanced Planning and Scheduling Software Revenue (undefined) Forecast, by Application 2020 & 2033
- Table 8: Canada Advanced Planning and Scheduling Software Revenue (undefined) Forecast, by Application 2020 & 2033
- Table 9: Mexico Advanced Planning and Scheduling Software Revenue (undefined) Forecast, by Application 2020 & 2033
- Table 10: Global Advanced Planning and Scheduling Software Revenue undefined Forecast, by Application 2020 & 2033
- Table 11: Global Advanced Planning and Scheduling Software Revenue undefined Forecast, by Types 2020 & 2033
- Table 12: Global Advanced Planning and Scheduling Software Revenue undefined Forecast, by Country 2020 & 2033
- Table 13: Brazil Advanced Planning and Scheduling Software Revenue (undefined) Forecast, by Application 2020 & 2033
- Table 14: Argentina Advanced Planning and Scheduling Software Revenue (undefined) Forecast, by Application 2020 & 2033
- Table 15: Rest of South America Advanced Planning and Scheduling Software Revenue (undefined) Forecast, by Application 2020 & 2033
- Table 16: Global Advanced Planning and Scheduling Software Revenue undefined Forecast, by Application 2020 & 2033
- Table 17: Global Advanced Planning and Scheduling Software Revenue undefined Forecast, by Types 2020 & 2033
- Table 18: Global Advanced Planning and Scheduling Software Revenue undefined Forecast, by Country 2020 & 2033
- Table 19: United Kingdom Advanced Planning and Scheduling Software Revenue (undefined) Forecast, by Application 2020 & 2033
- Table 20: Germany Advanced Planning and Scheduling Software Revenue (undefined) Forecast, by Application 2020 & 2033
- Table 21: France Advanced Planning and Scheduling Software Revenue (undefined) Forecast, by Application 2020 & 2033
- Table 22: Italy Advanced Planning and Scheduling Software Revenue (undefined) Forecast, by Application 2020 & 2033
- Table 23: Spain Advanced Planning and Scheduling Software Revenue (undefined) Forecast, by Application 2020 & 2033
- Table 24: Russia Advanced Planning and Scheduling Software Revenue (undefined) Forecast, by Application 2020 & 2033
- Table 25: Benelux Advanced Planning and Scheduling Software Revenue (undefined) Forecast, by Application 2020 & 2033
- Table 26: Nordics Advanced Planning and Scheduling Software Revenue (undefined) Forecast, by Application 2020 & 2033
- Table 27: Rest of Europe Advanced Planning and Scheduling Software Revenue (undefined) Forecast, by Application 2020 & 2033
- Table 28: Global Advanced Planning and Scheduling Software Revenue undefined Forecast, by Application 2020 & 2033
- Table 29: Global Advanced Planning and Scheduling Software Revenue undefined Forecast, by Types 2020 & 2033
- Table 30: Global Advanced Planning and Scheduling Software Revenue undefined Forecast, by Country 2020 & 2033
- Table 31: Turkey Advanced Planning and Scheduling Software Revenue (undefined) Forecast, by Application 2020 & 2033
- Table 32: Israel Advanced Planning and Scheduling Software Revenue (undefined) Forecast, by Application 2020 & 2033
- Table 33: GCC Advanced Planning and Scheduling Software Revenue (undefined) Forecast, by Application 2020 & 2033
- Table 34: North Africa Advanced Planning and Scheduling Software Revenue (undefined) Forecast, by Application 2020 & 2033
- Table 35: South Africa Advanced Planning and Scheduling Software Revenue (undefined) Forecast, by Application 2020 & 2033
- Table 36: Rest of Middle East & Africa Advanced Planning and Scheduling Software Revenue (undefined) Forecast, by Application 2020 & 2033
- Table 37: Global Advanced Planning and Scheduling Software Revenue undefined Forecast, by Application 2020 & 2033
- Table 38: Global Advanced Planning and Scheduling Software Revenue undefined Forecast, by Types 2020 & 2033
- Table 39: Global Advanced Planning and Scheduling Software Revenue undefined Forecast, by Country 2020 & 2033
- Table 40: China Advanced Planning and Scheduling Software Revenue (undefined) Forecast, by Application 2020 & 2033
- Table 41: India Advanced Planning and Scheduling Software Revenue (undefined) Forecast, by Application 2020 & 2033
- Table 42: Japan Advanced Planning and Scheduling Software Revenue (undefined) Forecast, by Application 2020 & 2033
- Table 43: South Korea Advanced Planning and Scheduling Software Revenue (undefined) Forecast, by Application 2020 & 2033
- Table 44: ASEAN Advanced Planning and Scheduling Software Revenue (undefined) Forecast, by Application 2020 & 2033
- Table 45: Oceania Advanced Planning and Scheduling Software Revenue (undefined) Forecast, by Application 2020 & 2033
- Table 46: Rest of Asia Pacific Advanced Planning and Scheduling Software Revenue (undefined) Forecast, by Application 2020 & 2033
Frequently Asked Questions
1. What is the projected Compound Annual Growth Rate (CAGR) of the Advanced Planning and Scheduling Software?
The projected CAGR is approximately 8.06%.
2. Which companies are prominent players in the Advanced Planning and Scheduling Software?
Key companies in the market include Acumatica, AIMMS, Asprova, Capgemini, CyberTec, Dassault Systemes, Global Shop Solutions, INFORM, MRPeasy, Oracle, ORTEC, Plex Systems, SAP, Siemens, Simio.
3. What are the main segments of the Advanced Planning and Scheduling Software?
The market segments include Application, Types.
4. Can you provide details about the market size?
The market size is estimated to be USD XXX N/A as of 2022.
5. What are some drivers contributing to market growth?
N/A
6. What are the notable trends driving market growth?
N/A
7. Are there any restraints impacting market growth?
N/A
8. Can you provide examples of recent developments in the market?
N/A
9. What pricing options are available for accessing the report?
Pricing options include single-user, multi-user, and enterprise licenses priced at USD 3950.00, USD 5925.00, and USD 7900.00 respectively.
10. Is the market size provided in terms of value or volume?
The market size is provided in terms of value, measured in N/A.
11. Are there any specific market keywords associated with the report?
Yes, the market keyword associated with the report is "Advanced Planning and Scheduling Software," which aids in identifying and referencing the specific market segment covered.
12. How do I determine which pricing option suits my needs best?
The pricing options vary based on user requirements and access needs. Individual users may opt for single-user licenses, while businesses requiring broader access may choose multi-user or enterprise licenses for cost-effective access to the report.
13. Are there any additional resources or data provided in the Advanced Planning and Scheduling Software report?
While the report offers comprehensive insights, it's advisable to review the specific contents or supplementary materials provided to ascertain if additional resources or data are available.
14. How can I stay updated on further developments or reports in the Advanced Planning and Scheduling Software?
To stay informed about further developments, trends, and reports in the Advanced Planning and Scheduling Software, consider subscribing to industry newsletters, following relevant companies and organizations, or regularly checking reputable industry news sources and publications.
Methodology
Step 1 - Identification of Relevant Samples Size from Population Database


Step 2 - Approaches for Defining Global Market Size (Value, Volume* & Price*)

Note*: In applicable scenarios
Step 3 - Data Sources
Primary Research
- Web Analytics
- Survey Reports
- Research Institute
- Latest Research Reports
- Opinion Leaders
Secondary Research
- Annual Reports
- White Paper
- Latest Press Release
- Industry Association
- Paid Database
- Investor Presentations

Step 4 - Data Triangulation
Involves using different sources of information in order to increase the validity of a study
These sources are likely to be stakeholders in a program - participants, other researchers, program staff, other community members, and so on.
Then we put all data in single framework & apply various statistical tools to find out the dynamic on the market.
During the analysis stage, feedback from the stakeholder groups would be compared to determine areas of agreement as well as areas of divergence