

Key Insights
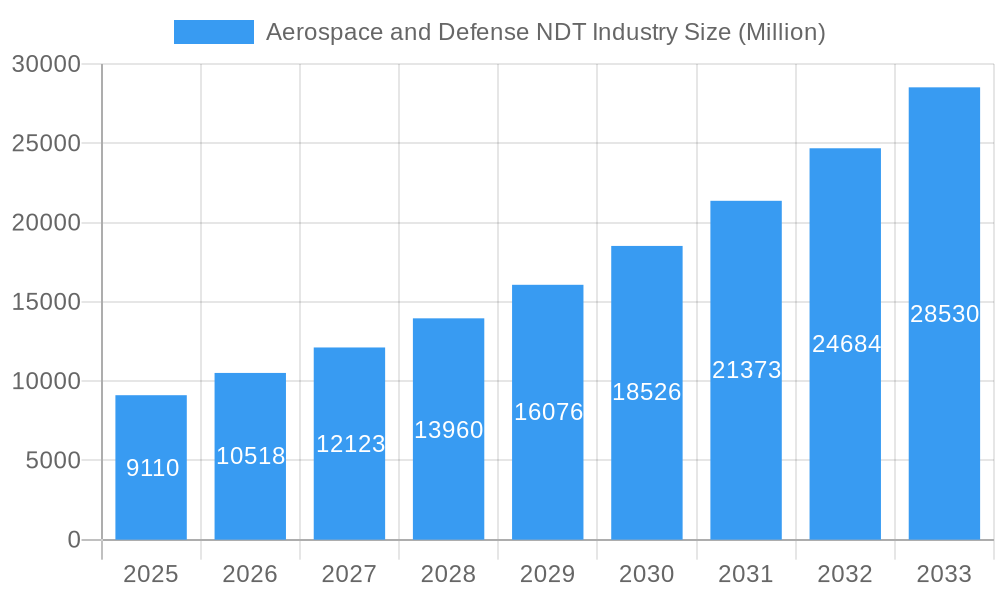
The Aerospace and Defense Non-Destructive Testing (NDT) market is experiencing robust growth, projected to reach a value of $9.11 billion in 2025 and maintain a Compound Annual Growth Rate (CAGR) of 15.74% from 2025 to 2033. This expansion is driven by several key factors. Firstly, the increasing demand for enhanced aircraft safety and reliability necessitates rigorous inspection and maintenance procedures, fueling the adoption of advanced NDT technologies. Secondly, the rise in defense spending globally, particularly in advanced weaponry and aerospace systems, directly correlates with higher NDT requirements throughout the manufacturing and operational lifecycles. Stringent regulatory frameworks mandating thorough inspections further contribute to market growth. Technological advancements, such as the development of portable and automated NDT equipment, improved image processing capabilities, and the integration of artificial intelligence for data analysis, are enhancing efficiency and accuracy, making NDT a more cost-effective solution. The market is segmented by type (service and equipment) and technology (radiography, ultrasonic, magnetic particle, electromagnetic, liquid penetrant, visual, and eddy current testing). While radiography and ultrasonic testing currently dominate, the adoption of other advanced techniques is accelerating, particularly those offering enhanced speed and sensitivity. Competition is robust with key players including Fujifilm, Intertek, Magnaflux, and others continually innovating and expanding their service offerings.
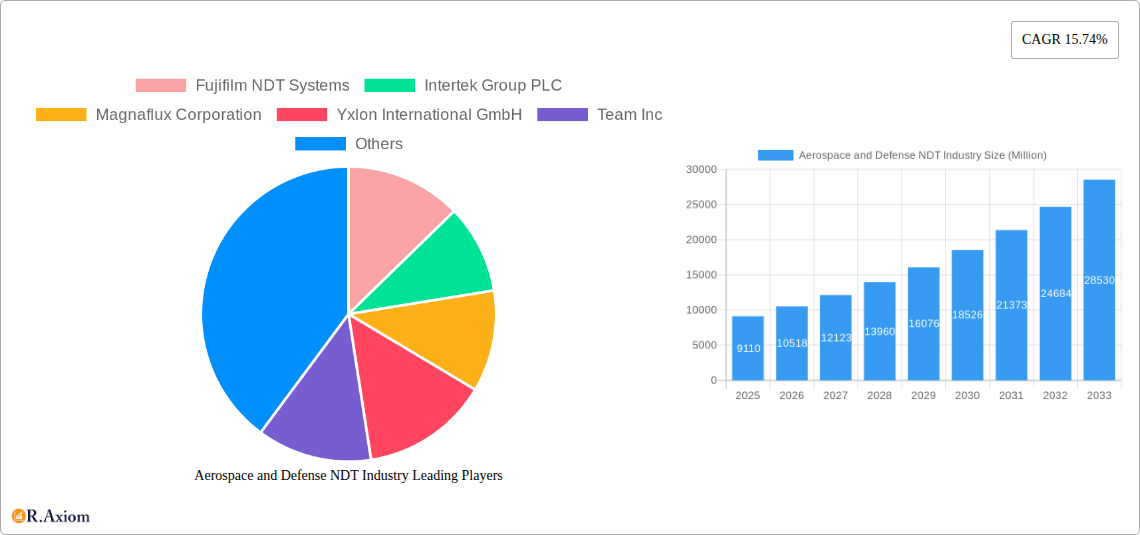
Aerospace and Defense NDT Industry Market Size (In Billion)
The geographical distribution of the market shows significant regional variations. North America and Europe are currently leading the market, primarily due to established aerospace and defense industries and stringent safety regulations. However, the Asia-Pacific region is exhibiting the fastest growth rate, driven by increasing investments in aerospace manufacturing and defense modernization programs within countries like China and India. The growth in this region is expected to continue to outpace other regions over the forecast period. While market restraints include high initial investment costs associated with advanced NDT technologies and a potential shortage of skilled NDT personnel, these challenges are being mitigated through technological advancements and the increasing availability of training programs. The overall outlook for the Aerospace and Defense NDT market remains exceptionally positive, fueled by continuous technological innovation and a sustained global demand for enhanced safety and operational reliability within the aerospace and defense sectors.
Aerospace and Defense NDT Industry Company Market Share
Aerospace and Defense NDT Industry Market Report: 2019-2033
This comprehensive report provides a detailed analysis of the Aerospace and Defense Non-Destructive Testing (NDT) industry, covering market size, growth drivers, key players, technological advancements, and future outlook. The study period spans from 2019 to 2033, with 2025 as the base and estimated year. The report is essential for industry stakeholders, investors, and researchers seeking actionable insights into this dynamic sector. The global market is projected to reach xx Million by 2033, exhibiting a CAGR of xx% during the forecast period (2025-2033).
Aerospace and Defense NDT Industry Market Concentration & Innovation
The Aerospace and Defense NDT market exhibits a moderately concentrated landscape, with several major players holding significant market share. Fujifilm NDT Systems, Intertek Group PLC, Magnaflux Corporation, and Yxlon International GmbH are among the leading companies, collectively accounting for an estimated xx% of the global market in 2025. Market concentration is influenced by factors such as technological expertise, global reach, and established customer relationships. Innovation is a key driver, with companies continually investing in R&D to develop advanced NDT technologies.
- Innovation Drivers: Stringent safety regulations, demand for improved inspection accuracy, and the need for faster, more efficient testing methods are driving innovation in NDT technologies.
- Regulatory Frameworks: Compliance with stringent aerospace and defense industry standards (e.g., ISO 9001, AS9100) is crucial and shapes the technological advancements within the market.
- Product Substitutes: While limited, advancements in other testing methodologies pose some level of substitution threat, but NDT remains critical.
- End-User Trends: Growing demand for lightweight, high-strength materials and complex aerospace components necessitates advanced NDT solutions.
- M&A Activities: The market has witnessed several mergers and acquisitions in recent years, with deal values exceeding xx Million in the period 2019-2024. These activities aim to enhance technological capabilities and expand market reach.
Aerospace and Defense NDT Industry Industry Trends & Insights
The Aerospace and Defense NDT market is experiencing robust growth, driven by factors such as increasing aircraft production, rising demand for defense equipment, and the growing adoption of advanced NDT technologies. The market is expected to witness significant growth over the next decade, fueled by technological advancements in areas such as AI-powered inspection systems and automated data analysis. The increasing focus on safety and quality control across the aerospace and defense sectors is further bolstering the demand for NDT services and equipment. Competitive dynamics are intensifying, with companies focusing on product differentiation, strategic partnerships, and geographic expansion. This competitive landscape fosters innovation and efficiency improvements within the industry.
Dominant Markets & Segments in Aerospace and Defense NDT Industry
The North American region holds a dominant position in the Aerospace and Defense NDT market, driven by robust aerospace and defense industries, high technological advancements, and stringent quality control standards. Within the segment breakdown:
- By Type: The Equipment segment holds a larger market share compared to the Service segment due to the high capital expenditure involved in purchasing advanced NDT equipment. However, the Service segment is expected to witness faster growth due to the increasing outsourcing of NDT services.
- By Technology: Radiography testing and Ultrasonic testing represent the largest segments, driven by their wide applicability and reliability in various aerospace and defense applications. However, advanced technologies like Eddy current and Electromagnetic testing are rapidly gaining traction due to their superior capabilities in certain applications.
Key Drivers for Dominant Regions:
- North America: Strong domestic aerospace and defense industries, significant R&D investments, and stringent regulatory frameworks.
- Europe: Presence of major aerospace manufacturers and a well-established NDT infrastructure.
- Asia-Pacific: Rapid growth in aerospace and defense spending, coupled with increasing adoption of advanced NDT technologies.
Aerospace and Defense NDT Industry Product Developments
Recent product innovations include advanced software solutions like Eddyfi Technologies' TubePro 6 for efficient pre-inspection and reporting, and Rad Source NDT's NDT 1000 X-ray Inspection System for high-precision material inspection. These developments highlight the ongoing trend towards automation, enhanced accuracy, and improved data analysis capabilities. The market is witnessing a shift towards portable, user-friendly equipment for improved on-site inspections. This improves efficiency and reduces downtime.
Report Scope & Segmentation Analysis
This report segments the Aerospace and Defense NDT market by Type (Service, Equipment) and by Technology (Radiography Testing, Ultrasonic Testing, Magnetic Particle Testing and Electromagnetic Testing, Liquid Penetrant Testing, Visual Inspection, Eddy Current).
- By Type (Service, Equipment): Both segments are expected to witness significant growth, with the Equipment segment projected to hold a larger market share.
- By Technology: Each technology segment presents distinct growth trajectories based on specific applications, technological advancements, and industry trends. Radiography and ultrasonic testing currently dominate, but other technologies are seeing growth.
Key Drivers of Aerospace and Defense NDT Industry Growth
Key growth drivers include:
- Technological advancements: Development of advanced NDT technologies like AI-powered systems and automated data analysis.
- Stringent safety regulations: Increasing emphasis on safety and quality control in the aerospace and defense industries.
- Rising demand for high-performance materials: The need for advanced NDT solutions for inspecting lightweight, high-strength materials.
- Increased outsourcing of NDT services: Growth in the NDT services market due to companies focusing on core competencies.
Challenges in the Aerospace and Defense NDT Industry Sector
Challenges include:
- High initial investment costs: The high cost of purchasing and maintaining advanced NDT equipment can be a barrier to entry for smaller companies.
- Skilled labor shortages: The need for highly skilled NDT technicians poses a challenge in some regions.
- Regulatory compliance: Meeting stringent regulatory standards requires significant investment and expertise.
Emerging Opportunities in Aerospace and Defense NDT Industry
Emerging opportunities include:
- Development of AI-powered NDT systems: Automated inspection and data analysis offer significant potential for efficiency gains.
- Growth of the NDT services market: Outsourcing NDT services presents significant opportunities for specialized service providers.
- Expansion into new applications: The application of NDT technologies is expanding into various industries, offering new market opportunities.
Leading Players in the Aerospace and Defense NDT Industry Market
- Fujifilm NDT Systems https://www.fujifilm.com/products/industrial-products/ndt/
- Intertek Group PLC https://www.intertek.com/
- Magnaflux Corporation https://www.magnaflux.com/
- Yxlon International GmbH https://www.yxlon.com/
- Team Inc
- SGS Group https://www.sgs.com/
- TUV Rheinland Ag https://www.tuv.com/
- Nikon Metrology Inc https://www.nikonmetrology.com/
- Mistras Group https://www.mistrasgroup.com/
- Olympus Corporation https://www.olympus-global.com/en/
- GE Measurement and Control
- Applus Services S.A https://www.applus.com/
- FLIR Systems Inc https://www.flir.com/
- Gould-Bass Co
Key Developments in Aerospace and Defense NDT Industry Industry
- March 2024: Eddyfi Technologies unveils TubePro 6, enhancing pre-inspection and reporting capabilities, particularly beneficial for heat exchanger inspections. This improves efficiency and data analysis within the industry.
- February 2024: Rad Source NDT launches the NDT 1000 X-ray Inspection System, offering high-precision and versatile material inspection, particularly for steel up to 0.5 inches thick. This advancement expands the capabilities of X-ray inspection techniques.
Strategic Outlook for Aerospace and Defense NDT Industry Market
The Aerospace and Defense NDT market is poised for continued growth, driven by technological innovation, increasing demand for advanced inspection solutions, and stringent regulatory requirements. The focus on automation, AI integration, and improved data analysis will shape future market trends. The adoption of advanced NDT technologies will continue to drive market expansion across various aerospace and defense applications, leading to increased efficiency and improved safety standards.
Aerospace and Defense NDT Industry Segmentation
-
1. Type
- 1.1. Service
- 1.2. Equipment
-
2. Technology
- 2.1. Radiography Testing
- 2.2. Ultrasonic Testing
- 2.3. Magnetic
- 2.4. Liquid Penetrant Testing
- 2.5. Visual Inspection
- 2.6. Eddy Current
Aerospace and Defense NDT Industry Segmentation By Geography
- 1. North America
- 2. Europe
- 3. Asia
- 4. Australia and New Zealand
- 5. Latin America
- 6. Middle East and Africa
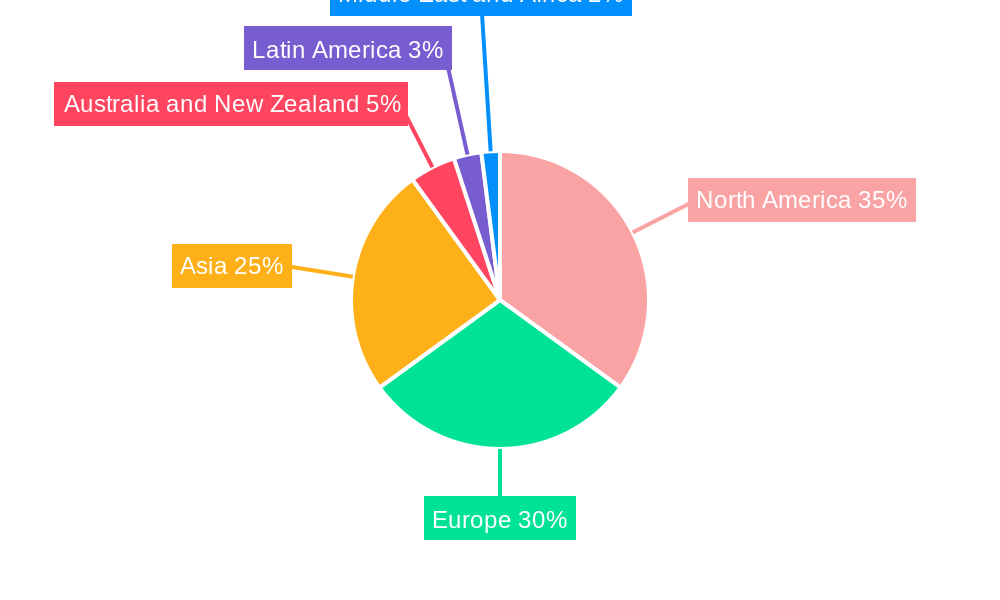
Aerospace and Defense NDT Industry Regional Market Share
Geographic Coverage of Aerospace and Defense NDT Industry
Aerospace and Defense NDT Industry REPORT HIGHLIGHTS
| Aspects | Details |
|---|---|
| Study Period | 2020-2034 |
| Base Year | 2025 |
| Estimated Year | 2026 |
| Forecast Period | 2026-2034 |
| Historical Period | 2020-2025 |
| Growth Rate | CAGR of 15.74% from 2020-2034 |
| Segmentation |
|
Table of Contents
- 1. Introduction
- 1.1. Research Scope
- 1.2. Market Segmentation
- 1.3. Research Objective
- 1.4. Definitions and Assumptions
- 2. Executive Summary
- 2.1. Market Snapshot
- 3. Market Dynamics
- 3.1. Market Drivers
- 3.2. Market Restrains
- 3.3. Market Trends
- 3.4. Market Opportunities
- 4. Market Factor Analysis
- 4.1. Porters Five Forces
- 4.1.1. Bargaining Power of Suppliers
- 4.1.2. Bargaining Power of Buyers
- 4.1.3. Threat of New Entrants
- 4.1.4. Threat of Substitutes
- 4.1.5. Competitive Rivalry
- 4.2. PESTEL analysis
- 4.3. BCG Analysis
- 4.3.1. Stars (High Growth, High Market Share)
- 4.3.2. Cash Cows (Low Growth, High Market Share)
- 4.3.3. Question Mark (High Growth, Low Market Share)
- 4.3.4. Dogs (Low Growth, Low Market Share)
- 4.4. Ansoff Matrix Analysis
- 4.5. Supply Chain Analysis
- 4.6. Regulatory Landscape
- 4.7. Current Market Potential and Opportunity Assessment (TAM–SAM–SOM Framework)
- 4.8. RAX Analyst Note
- 4.1. Porters Five Forces
- 5. Market Analysis, Insights and Forecast 2021-2033
- 5.1. Market Analysis, Insights and Forecast - by Type
- 5.1.1. Service
- 5.1.2. Equipment
- 5.2. Market Analysis, Insights and Forecast - by Technology
- 5.2.1. Radiography Testing
- 5.2.2. Ultrasonic Testing
- 5.2.3. Magnetic
- 5.2.4. Liquid Penetrant Testing
- 5.2.5. Visual Inspection
- 5.2.6. Eddy Current
- 5.3. Market Analysis, Insights and Forecast - by Region
- 5.3.1. North America
- 5.3.2. Europe
- 5.3.3. Asia
- 5.3.4. Australia and New Zealand
- 5.3.5. Latin America
- 5.3.6. Middle East and Africa
- 5.1. Market Analysis, Insights and Forecast - by Type
- 6. Global Aerospace and Defense NDT Industry Analysis, Insights and Forecast, 2021-2033
- 6.1. Market Analysis, Insights and Forecast - by Type
- 6.1.1. Service
- 6.1.2. Equipment
- 6.2. Market Analysis, Insights and Forecast - by Technology
- 6.2.1. Radiography Testing
- 6.2.2. Ultrasonic Testing
- 6.2.3. Magnetic
- 6.2.4. Liquid Penetrant Testing
- 6.2.5. Visual Inspection
- 6.2.6. Eddy Current
- 6.1. Market Analysis, Insights and Forecast - by Type
- 7. North America Aerospace and Defense NDT Industry Analysis, Insights and Forecast, 2020-2032
- 7.1. Market Analysis, Insights and Forecast - by Type
- 7.1.1. Service
- 7.1.2. Equipment
- 7.2. Market Analysis, Insights and Forecast - by Technology
- 7.2.1. Radiography Testing
- 7.2.2. Ultrasonic Testing
- 7.2.3. Magnetic
- 7.2.4. Liquid Penetrant Testing
- 7.2.5. Visual Inspection
- 7.2.6. Eddy Current
- 7.1. Market Analysis, Insights and Forecast - by Type
- 8. Europe Aerospace and Defense NDT Industry Analysis, Insights and Forecast, 2020-2032
- 8.1. Market Analysis, Insights and Forecast - by Type
- 8.1.1. Service
- 8.1.2. Equipment
- 8.2. Market Analysis, Insights and Forecast - by Technology
- 8.2.1. Radiography Testing
- 8.2.2. Ultrasonic Testing
- 8.2.3. Magnetic
- 8.2.4. Liquid Penetrant Testing
- 8.2.5. Visual Inspection
- 8.2.6. Eddy Current
- 8.1. Market Analysis, Insights and Forecast - by Type
- 9. Asia Aerospace and Defense NDT Industry Analysis, Insights and Forecast, 2020-2032
- 9.1. Market Analysis, Insights and Forecast - by Type
- 9.1.1. Service
- 9.1.2. Equipment
- 9.2. Market Analysis, Insights and Forecast - by Technology
- 9.2.1. Radiography Testing
- 9.2.2. Ultrasonic Testing
- 9.2.3. Magnetic
- 9.2.4. Liquid Penetrant Testing
- 9.2.5. Visual Inspection
- 9.2.6. Eddy Current
- 9.1. Market Analysis, Insights and Forecast - by Type
- 10. Australia and New Zealand Aerospace and Defense NDT Industry Analysis, Insights and Forecast, 2020-2032
- 10.1. Market Analysis, Insights and Forecast - by Type
- 10.1.1. Service
- 10.1.2. Equipment
- 10.2. Market Analysis, Insights and Forecast - by Technology
- 10.2.1. Radiography Testing
- 10.2.2. Ultrasonic Testing
- 10.2.3. Magnetic
- 10.2.4. Liquid Penetrant Testing
- 10.2.5. Visual Inspection
- 10.2.6. Eddy Current
- 10.1. Market Analysis, Insights and Forecast - by Type
- 11. Latin America Aerospace and Defense NDT Industry Analysis, Insights and Forecast, 2020-2032
- 11.1. Market Analysis, Insights and Forecast - by Type
- 11.1.1. Service
- 11.1.2. Equipment
- 11.2. Market Analysis, Insights and Forecast - by Technology
- 11.2.1. Radiography Testing
- 11.2.2. Ultrasonic Testing
- 11.2.3. Magnetic
- 11.2.4. Liquid Penetrant Testing
- 11.2.5. Visual Inspection
- 11.2.6. Eddy Current
- 11.1. Market Analysis, Insights and Forecast - by Type
- 12. Middle East and Africa Aerospace and Defense NDT Industry Analysis, Insights and Forecast, 2020-2032
- 12.1. Market Analysis, Insights and Forecast - by Type
- 12.1.1. Service
- 12.1.2. Equipment
- 12.2. Market Analysis, Insights and Forecast - by Technology
- 12.2.1. Radiography Testing
- 12.2.2. Ultrasonic Testing
- 12.2.3. Magnetic
- 12.2.4. Liquid Penetrant Testing
- 12.2.5. Visual Inspection
- 12.2.6. Eddy Current
- 12.1. Market Analysis, Insights and Forecast - by Type
- 13. Competitive Analysis
- 13.1. Company Profiles
- 13.1.1 Fujifilm NDT Systems
- 13.1.1.1. Company Overview
- 13.1.1.2. Products
- 13.1.1.3. Company Financials
- 13.1.1.4. SWOT Analysis
- 13.1.2 Intertek Group PLC
- 13.1.2.1. Company Overview
- 13.1.2.2. Products
- 13.1.2.3. Company Financials
- 13.1.2.4. SWOT Analysis
- 13.1.3 Magnaflux Corporation
- 13.1.3.1. Company Overview
- 13.1.3.2. Products
- 13.1.3.3. Company Financials
- 13.1.3.4. SWOT Analysis
- 13.1.4 Yxlon International GmbH
- 13.1.4.1. Company Overview
- 13.1.4.2. Products
- 13.1.4.3. Company Financials
- 13.1.4.4. SWOT Analysis
- 13.1.5 Team Inc
- 13.1.5.1. Company Overview
- 13.1.5.2. Products
- 13.1.5.3. Company Financials
- 13.1.5.4. SWOT Analysis
- 13.1.6 SGS Group
- 13.1.6.1. Company Overview
- 13.1.6.2. Products
- 13.1.6.3. Company Financials
- 13.1.6.4. SWOT Analysis
- 13.1.7 TUV Rheinland Ag
- 13.1.7.1. Company Overview
- 13.1.7.2. Products
- 13.1.7.3. Company Financials
- 13.1.7.4. SWOT Analysis
- 13.1.8 NikonMetrology Inc
- 13.1.8.1. Company Overview
- 13.1.8.2. Products
- 13.1.8.3. Company Financials
- 13.1.8.4. SWOT Analysis
- 13.1.9 Mistras Group
- 13.1.9.1. Company Overview
- 13.1.9.2. Products
- 13.1.9.3. Company Financials
- 13.1.9.4. SWOT Analysis
- 13.1.10 Olympus Corporation
- 13.1.10.1. Company Overview
- 13.1.10.2. Products
- 13.1.10.3. Company Financials
- 13.1.10.4. SWOT Analysis
- 13.1.11 GE Measurement and Control
- 13.1.11.1. Company Overview
- 13.1.11.2. Products
- 13.1.11.3. Company Financials
- 13.1.11.4. SWOT Analysis
- 13.1.12 Applus Services S A
- 13.1.12.1. Company Overview
- 13.1.12.2. Products
- 13.1.12.3. Company Financials
- 13.1.12.4. SWOT Analysis
- 13.1.13 FLIR Systems Inc *List Not Exhaustive
- 13.1.13.1. Company Overview
- 13.1.13.2. Products
- 13.1.13.3. Company Financials
- 13.1.13.4. SWOT Analysis
- 13.1.14 Gould-Bass Co
- 13.1.14.1. Company Overview
- 13.1.14.2. Products
- 13.1.14.3. Company Financials
- 13.1.14.4. SWOT Analysis
- 13.1.1 Fujifilm NDT Systems
- 13.2. Market Entropy
- 13.2.1 Company's Key Areas Served
- 13.2.2 Recent Developments
- 13.3. Company Market Share Analysis 2025
- 13.3.1 Top 5 Companies Market Share Analysis
- 13.3.2 Top 3 Companies Market Share Analysis
- 13.4. List of Potential Customers
- 14. Research Methodology
List of Figures
- Figure 1: Global Aerospace and Defense NDT Industry Revenue Breakdown (Million, %) by Region 2025 & 2033
- Figure 2: North America Aerospace and Defense NDT Industry Revenue (Million), by Type 2025 & 2033
- Figure 3: North America Aerospace and Defense NDT Industry Revenue Share (%), by Type 2025 & 2033
- Figure 4: North America Aerospace and Defense NDT Industry Revenue (Million), by Technology 2025 & 2033
- Figure 5: North America Aerospace and Defense NDT Industry Revenue Share (%), by Technology 2025 & 2033
- Figure 6: North America Aerospace and Defense NDT Industry Revenue (Million), by Country 2025 & 2033
- Figure 7: North America Aerospace and Defense NDT Industry Revenue Share (%), by Country 2025 & 2033
- Figure 8: Europe Aerospace and Defense NDT Industry Revenue (Million), by Type 2025 & 2033
- Figure 9: Europe Aerospace and Defense NDT Industry Revenue Share (%), by Type 2025 & 2033
- Figure 10: Europe Aerospace and Defense NDT Industry Revenue (Million), by Technology 2025 & 2033
- Figure 11: Europe Aerospace and Defense NDT Industry Revenue Share (%), by Technology 2025 & 2033
- Figure 12: Europe Aerospace and Defense NDT Industry Revenue (Million), by Country 2025 & 2033
- Figure 13: Europe Aerospace and Defense NDT Industry Revenue Share (%), by Country 2025 & 2033
- Figure 14: Asia Aerospace and Defense NDT Industry Revenue (Million), by Type 2025 & 2033
- Figure 15: Asia Aerospace and Defense NDT Industry Revenue Share (%), by Type 2025 & 2033
- Figure 16: Asia Aerospace and Defense NDT Industry Revenue (Million), by Technology 2025 & 2033
- Figure 17: Asia Aerospace and Defense NDT Industry Revenue Share (%), by Technology 2025 & 2033
- Figure 18: Asia Aerospace and Defense NDT Industry Revenue (Million), by Country 2025 & 2033
- Figure 19: Asia Aerospace and Defense NDT Industry Revenue Share (%), by Country 2025 & 2033
- Figure 20: Australia and New Zealand Aerospace and Defense NDT Industry Revenue (Million), by Type 2025 & 2033
- Figure 21: Australia and New Zealand Aerospace and Defense NDT Industry Revenue Share (%), by Type 2025 & 2033
- Figure 22: Australia and New Zealand Aerospace and Defense NDT Industry Revenue (Million), by Technology 2025 & 2033
- Figure 23: Australia and New Zealand Aerospace and Defense NDT Industry Revenue Share (%), by Technology 2025 & 2033
- Figure 24: Australia and New Zealand Aerospace and Defense NDT Industry Revenue (Million), by Country 2025 & 2033
- Figure 25: Australia and New Zealand Aerospace and Defense NDT Industry Revenue Share (%), by Country 2025 & 2033
- Figure 26: Latin America Aerospace and Defense NDT Industry Revenue (Million), by Type 2025 & 2033
- Figure 27: Latin America Aerospace and Defense NDT Industry Revenue Share (%), by Type 2025 & 2033
- Figure 28: Latin America Aerospace and Defense NDT Industry Revenue (Million), by Technology 2025 & 2033
- Figure 29: Latin America Aerospace and Defense NDT Industry Revenue Share (%), by Technology 2025 & 2033
- Figure 30: Latin America Aerospace and Defense NDT Industry Revenue (Million), by Country 2025 & 2033
- Figure 31: Latin America Aerospace and Defense NDT Industry Revenue Share (%), by Country 2025 & 2033
- Figure 32: Middle East and Africa Aerospace and Defense NDT Industry Revenue (Million), by Type 2025 & 2033
- Figure 33: Middle East and Africa Aerospace and Defense NDT Industry Revenue Share (%), by Type 2025 & 2033
- Figure 34: Middle East and Africa Aerospace and Defense NDT Industry Revenue (Million), by Technology 2025 & 2033
- Figure 35: Middle East and Africa Aerospace and Defense NDT Industry Revenue Share (%), by Technology 2025 & 2033
- Figure 36: Middle East and Africa Aerospace and Defense NDT Industry Revenue (Million), by Country 2025 & 2033
- Figure 37: Middle East and Africa Aerospace and Defense NDT Industry Revenue Share (%), by Country 2025 & 2033
List of Tables
- Table 1: Global Aerospace and Defense NDT Industry Revenue Million Forecast, by Type 2020 & 2033
- Table 2: Global Aerospace and Defense NDT Industry Revenue Million Forecast, by Technology 2020 & 2033
- Table 3: Global Aerospace and Defense NDT Industry Revenue Million Forecast, by Region 2020 & 2033
- Table 4: Global Aerospace and Defense NDT Industry Revenue Million Forecast, by Type 2020 & 2033
- Table 5: Global Aerospace and Defense NDT Industry Revenue Million Forecast, by Technology 2020 & 2033
- Table 6: Global Aerospace and Defense NDT Industry Revenue Million Forecast, by Country 2020 & 2033
- Table 7: Global Aerospace and Defense NDT Industry Revenue Million Forecast, by Type 2020 & 2033
- Table 8: Global Aerospace and Defense NDT Industry Revenue Million Forecast, by Technology 2020 & 2033
- Table 9: Global Aerospace and Defense NDT Industry Revenue Million Forecast, by Country 2020 & 2033
- Table 10: Global Aerospace and Defense NDT Industry Revenue Million Forecast, by Type 2020 & 2033
- Table 11: Global Aerospace and Defense NDT Industry Revenue Million Forecast, by Technology 2020 & 2033
- Table 12: Global Aerospace and Defense NDT Industry Revenue Million Forecast, by Country 2020 & 2033
- Table 13: Global Aerospace and Defense NDT Industry Revenue Million Forecast, by Type 2020 & 2033
- Table 14: Global Aerospace and Defense NDT Industry Revenue Million Forecast, by Technology 2020 & 2033
- Table 15: Global Aerospace and Defense NDT Industry Revenue Million Forecast, by Country 2020 & 2033
- Table 16: Global Aerospace and Defense NDT Industry Revenue Million Forecast, by Type 2020 & 2033
- Table 17: Global Aerospace and Defense NDT Industry Revenue Million Forecast, by Technology 2020 & 2033
- Table 18: Global Aerospace and Defense NDT Industry Revenue Million Forecast, by Country 2020 & 2033
- Table 19: Global Aerospace and Defense NDT Industry Revenue Million Forecast, by Type 2020 & 2033
- Table 20: Global Aerospace and Defense NDT Industry Revenue Million Forecast, by Technology 2020 & 2033
- Table 21: Global Aerospace and Defense NDT Industry Revenue Million Forecast, by Country 2020 & 2033
Frequently Asked Questions
1. What is the projected Compound Annual Growth Rate (CAGR) of the Aerospace and Defense NDT Industry?
The projected CAGR is approximately 15.74%.
2. Which companies are prominent players in the Aerospace and Defense NDT Industry?
Key companies in the market include Fujifilm NDT Systems, Intertek Group PLC, Magnaflux Corporation, Yxlon International GmbH, Team Inc, SGS Group, TUV Rheinland Ag, NikonMetrology Inc, Mistras Group, Olympus Corporation, GE Measurement and Control, Applus Services S A, FLIR Systems Inc *List Not Exhaustive, Gould-Bass Co.
3. What are the main segments of the Aerospace and Defense NDT Industry?
The market segments include Type, Technology.
4. Can you provide details about the market size?
The market size is estimated to be USD 9.11 Million as of 2022.
5. What are some drivers contributing to market growth?
Increasing Investments in Aerospace & Defense; Increasing Complexity of Machine and Infrastructure.
6. What are the notable trends driving market growth?
Radiography Testing Technology to Account for the Largest Share.
7. Are there any restraints impacting market growth?
Lack Of Technical Workforce; Relative Lack of Awareness.
8. Can you provide examples of recent developments in the market?
March 2024 – Eddyfi Technologies, a player in the global non-destructive testing (NDT) solutions market, unveils TubePro 6, its advanced pre-inspection and reporting software. TubePro 6 is equipping organizations with advanced tools. These features promise unmatched insights and operational efficiency, particularly in heat exchanger inspections.
9. What pricing options are available for accessing the report?
Pricing options include single-user, multi-user, and enterprise licenses priced at USD 4750, USD 5250, and USD 8750 respectively.
10. Is the market size provided in terms of value or volume?
The market size is provided in terms of value, measured in Million.
11. Are there any specific market keywords associated with the report?
Yes, the market keyword associated with the report is "Aerospace and Defense NDT Industry," which aids in identifying and referencing the specific market segment covered.
12. How do I determine which pricing option suits my needs best?
The pricing options vary based on user requirements and access needs. Individual users may opt for single-user licenses, while businesses requiring broader access may choose multi-user or enterprise licenses for cost-effective access to the report.
13. Are there any additional resources or data provided in the Aerospace and Defense NDT Industry report?
While the report offers comprehensive insights, it's advisable to review the specific contents or supplementary materials provided to ascertain if additional resources or data are available.
14. How can I stay updated on further developments or reports in the Aerospace and Defense NDT Industry?
To stay informed about further developments, trends, and reports in the Aerospace and Defense NDT Industry, consider subscribing to industry newsletters, following relevant companies and organizations, or regularly checking reputable industry news sources and publications.
Methodology
Step 1 - Identification of Relevant Samples Size from Population Database


Step 2 - Approaches for Defining Global Market Size (Value, Volume* & Price*)

Note*: In applicable scenarios
Step 3 - Data Sources
Primary Research
- Web Analytics
- Survey Reports
- Research Institute
- Latest Research Reports
- Opinion Leaders
Secondary Research
- Annual Reports
- White Paper
- Latest Press Release
- Industry Association
- Paid Database
- Investor Presentations

Step 4 - Data Triangulation
Involves using different sources of information in order to increase the validity of a study
These sources are likely to be stakeholders in a program - participants, other researchers, program staff, other community members, and so on.
Then we put all data in single framework & apply various statistical tools to find out the dynamic on the market.
During the analysis stage, feedback from the stakeholder groups would be compared to determine areas of agreement as well as areas of divergence