

Key Insights
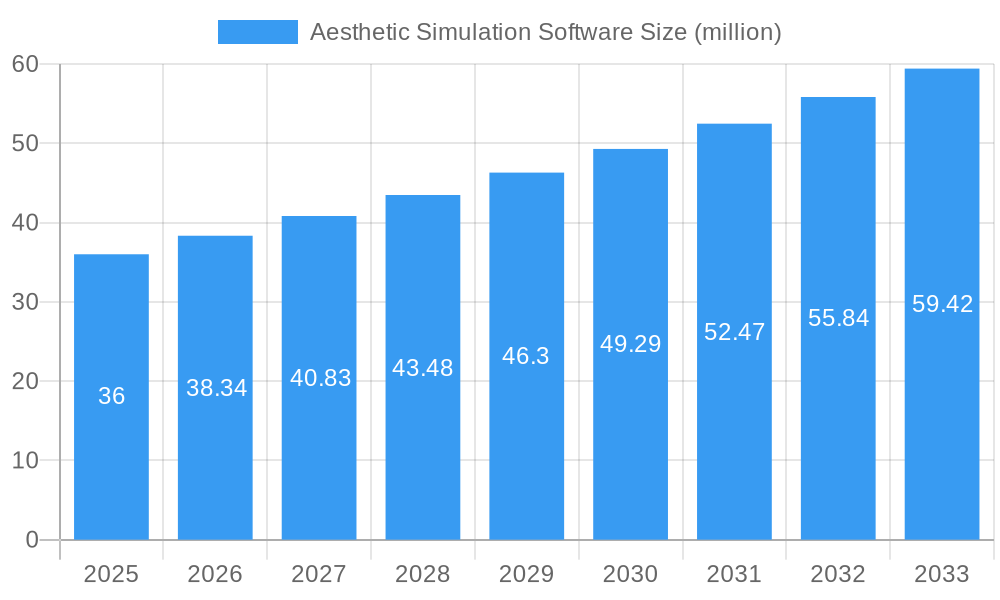
The global aesthetic simulation software market, valued at $36 million in 2025, is projected to experience robust growth, driven by a Compound Annual Growth Rate (CAGR) of 6.5% from 2025 to 2033. This expansion is fueled by several key factors. Firstly, the increasing demand for minimally invasive cosmetic procedures and the rising adoption of digital technologies within the healthcare sector are significantly impacting market growth. Aesthetic simulation software allows surgeons and patients to visualize potential outcomes before surgery, reducing anxiety and improving patient satisfaction, thus driving demand. Secondly, technological advancements leading to more realistic and accurate simulations are enhancing the software's appeal. Features such as improved 3D modeling, realistic skin rendering, and integration with imaging technologies contribute to this enhanced accuracy and realism. Finally, the increasing availability of affordable and user-friendly software solutions is making the technology accessible to a wider range of clinics and practices, further fueling market expansion. Competition among established players like AlterImage, Crisalix, and Canfield Scientific, along with emerging innovative companies, contributes to a dynamic market landscape and the ongoing development of enhanced features.
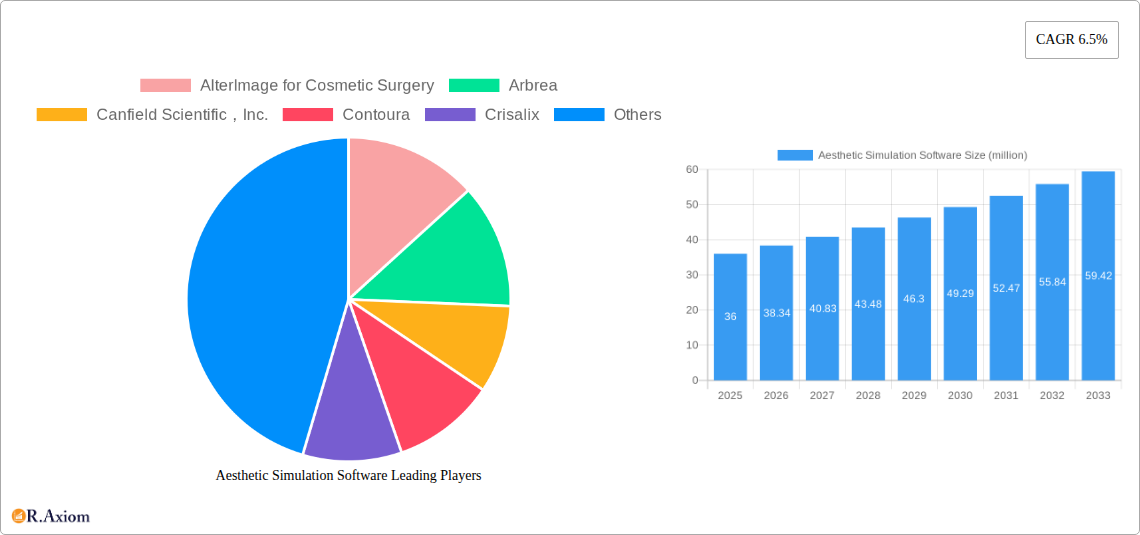
Aesthetic Simulation Software Market Size (In Million)
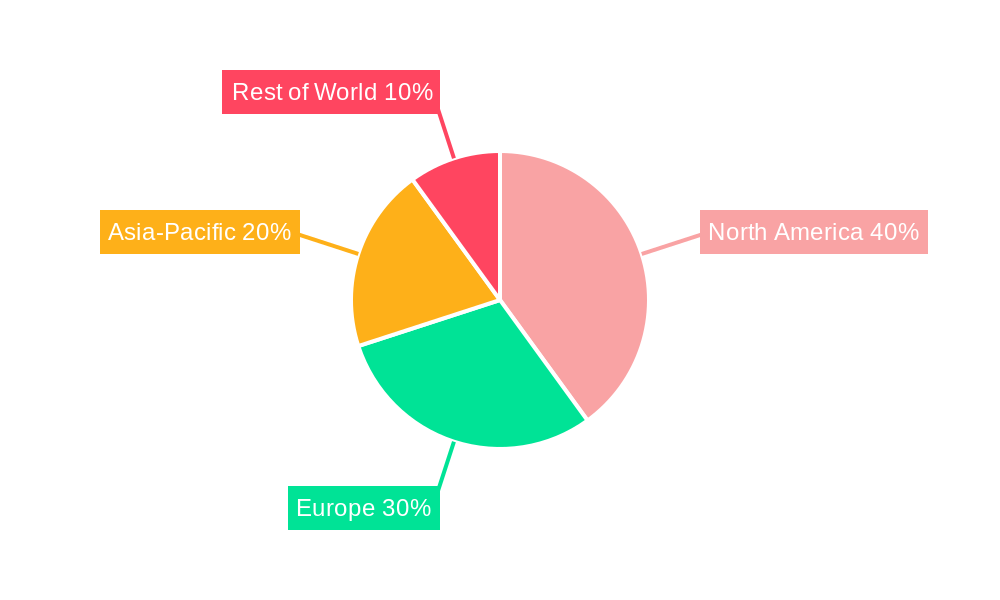
The market's segmentation likely includes categories based on software type (e.g., 2D vs. 3D, specialized vs. general), application (e.g., facial surgery, body contouring, breast augmentation), and end-user (e.g., hospitals, clinics, individual practitioners). Geographical segmentation would likely show strong growth in North America and Europe, followed by Asia-Pacific, driven by increasing disposable incomes and a higher awareness of cosmetic procedures in these regions. However, regulatory hurdles and the need for extensive training to effectively utilize the software could act as potential restraints on market growth. Despite these limitations, the overall outlook for the aesthetic simulation software market remains positive, with considerable potential for growth over the forecast period driven by technological advancement and increasing adoption within the cosmetic surgery industry.
Aesthetic Simulation Software Company Market Share
This comprehensive report provides an in-depth analysis of the global aesthetic simulation software market, covering the period from 2019 to 2033. The report offers invaluable insights for industry stakeholders, investors, and market participants seeking to understand the market dynamics, growth drivers, and future opportunities. The market is valued at $XX million in 2025 and is projected to reach $XX million by 2033, exhibiting a CAGR of XX% during the forecast period (2025-2033). The study incorporates data from the historical period (2019-2024) and uses 2025 as the base year.
Aesthetic Simulation Software Market Concentration & Innovation
The aesthetic simulation software market exhibits a moderately concentrated landscape, with several key players holding significant market share. AlterImage for Cosmetic Surgery, Arbrea, Canfield Scientific, Inc., Contoura, Crisalix, Paul Harris, PreVu, QuantifiCare, SNAP, and X-MOL are some of the prominent companies shaping the market. Precise market share figures for individual companies are not publicly available but are estimated to be highly varied, ranging from a few percentage points for some smaller players to a significant double-digit percentage for the leading players. M&A activity has been relatively low in recent years, with only a few notable transactions valued at less than $XX million each, indicating a focus on organic growth and innovation.
- Innovation Drivers: The market is driven by advancements in 3D imaging technology, artificial intelligence (AI), and augmented reality (AR), enhancing the accuracy and realism of simulations.
- Regulatory Frameworks: Regulatory bodies globally are increasingly focusing on the safety and efficacy of aesthetic procedures, influencing software development and adoption.
- Product Substitutes: While no direct substitutes exist, traditional methods like physical modeling and manual estimations remain relevant, though less efficient.
- End-User Trends: Growing demand for minimally invasive procedures and personalized treatments is a major factor driving market growth.
- M&A Activities: Limited M&A activity reflects a stable market with strong organic growth potential. Future consolidation may occur as companies seek to expand their product portfolios and market reach.
Aesthetic Simulation Software Industry Trends & Insights
The global aesthetic simulation software market is witnessing robust growth fueled by several key factors. The rising adoption of minimally invasive cosmetic procedures, increasing demand for personalized treatments, and technological advancements in 3D imaging and AI are significantly contributing to market expansion. The market's expansion is further fueled by the increasing accessibility and affordability of aesthetic procedures. The global adoption of telehealth and virtual consultations has also played a significant role in market growth, as patients and surgeons can leverage aesthetic simulation software for virtual consultations and planning, especially in geographically remote regions. This trend has expanded the market's potential beyond traditional clinical settings. The competitive landscape is dynamic, with existing players continuously innovating and introducing new features while new entrants emerge, potentially disrupting the market. The market exhibits a significant growth trajectory, with a projected compound annual growth rate (CAGR) of XX% from 2025 to 2033, and a market penetration rate in major markets exceeding XX%.
Dominant Markets & Segments in Aesthetic Simulation Software
The North American market currently dominates the aesthetic simulation software market, driven by high disposable incomes, increased awareness about cosmetic procedures, and strong regulatory frameworks. This region accounts for a significant portion of the total market revenue. Other developed regions, such as Europe and Asia-Pacific, are also experiencing robust growth, indicating a global expansion of the market. The largest segment is the cosmetic surgery segment, representing an estimated XX% of the market revenue due to the extensive use of simulation software in planning and visualization of complex procedures.
- Key Drivers in North America:
- Strong regulatory frameworks ensuring software quality and patient safety.
- High adoption rates of advanced technologies in the healthcare sector.
- High disposable incomes leading to increased spending on aesthetic procedures.
- Dominance Analysis: North America’s dominance is attributed to factors including the high concentration of leading aesthetic surgery clinics and cosmetic dermatology practices. The relatively high awareness and acceptance of minimally-invasive procedures further contribute to the region’s leading position.
Aesthetic Simulation Software Product Developments
Recent product innovations include enhanced 3D modeling capabilities, integration of AI for automated analysis and personalized recommendations, and the development of augmented reality (AR) features for more engaging patient consultations. These advancements improve the accuracy, efficiency, and overall user experience of the software, leading to increased adoption. The software’s application spans a wide range of cosmetic procedures, including facelifts, breast augmentation, rhinoplasty, and liposuction, offering surgeons a valuable tool for pre-operative planning and patient communication. The competitive advantage lies in the precision and realism of the simulations, along with the ease of use and integration with existing clinical workflows.
Report Scope & Segmentation Analysis
This report segments the aesthetic simulation software market by type (2D, 3D), application (face, breast, body), end-user (hospitals, clinics), and region (North America, Europe, Asia-Pacific, Rest of World). Each segment offers varying growth potentials. The 3D simulation segment, for instance, is projected to experience the fastest growth due to its ability to offer a more realistic visualization. Likewise, the breast augmentation application is expected to show significant market size owing to its high demand globally. Competitive dynamics within each segment vary based on the presence of major players and the level of technological innovation. All segments exhibit substantial growth potential throughout the forecast period.
Key Drivers of Aesthetic Simulation Software Growth
Technological advancements in 3D imaging, AI, and AR are significant drivers, enabling more accurate and realistic simulations. The rising demand for minimally invasive procedures and personalized treatments further boosts market growth. Favorable regulatory environments in certain regions and increasing patient awareness also contribute to wider adoption. Economic growth and rising disposable incomes, especially in developing countries, are expanding the target market significantly.
Challenges in the Aesthetic Simulation Software Sector
High initial investment costs for software and hardware can pose a barrier to entry for smaller clinics and practices. Competition among existing players is intense, requiring continuous innovation to maintain a competitive edge. Regulatory approvals and compliance requirements can be complex and time-consuming. The accuracy and reliability of simulations remain a critical aspect, as the outcome heavily impacts patient expectations and surgeon decisions.
Emerging Opportunities in Aesthetic Simulation Software
Integration of AI and machine learning for more sophisticated simulations, combined with AR/VR integration for immersive patient experiences, presents significant opportunities. Expansion into new geographic markets, particularly in developing economies, and the development of software tailored to specific procedures or ethnicities offer growth prospects. The potential for mobile applications and cloud-based solutions to improve accessibility and affordability of the software is also substantial.
Leading Players in the Aesthetic Simulation Software Market
- AlterImage for Cosmetic Surgery
- Arbrea
- Canfield Scientific,Inc.
- Contoura
- Crisalix
- Paul Harris
- PreVu
- QuantifiCare
- SNAP
- X-MOL
Key Developments in Aesthetic Simulation Software Industry
- 2022 Q4: Crisalix launched an updated version of its software with enhanced AR capabilities.
- 2023 Q1: Canfield Scientific, Inc. acquired a smaller competitor, expanding its market share.
- 2023 Q3: Arbrea announced a partnership with a major medical device manufacturer for broader distribution.
- 2024 Q2: A new player entered the market with AI-powered simulation software. (Further specific details are not publicly available for most company activities.)
Strategic Outlook for Aesthetic Simulation Software Market
The aesthetic simulation software market is poised for significant growth, driven by continuous technological advancements, increasing demand for minimally invasive procedures, and the rising adoption of telehealth. The market will witness increased consolidation through mergers and acquisitions as companies strive to enhance their market position and product offerings. Innovation focused on AI, AR, and VR technologies will remain key to future success. Expansion into emerging markets, combined with strategic partnerships and collaborations, will further unlock significant growth opportunities.
Aesthetic Simulation Software Segmentation
-
1. Application
- 1.1. Plastic Surgery
- 1.2. Beauty Salon
- 1.3. Research Center
- 1.4. Other
-
2. Types
- 2.1. 2D Imaging
- 2.2. 3D Imaging
Aesthetic Simulation Software Segmentation By Geography
-
1. North America
- 1.1. United States
- 1.2. Canada
- 1.3. Mexico
-
2. South America
- 2.1. Brazil
- 2.2. Argentina
- 2.3. Rest of South America
-
3. Europe
- 3.1. United Kingdom
- 3.2. Germany
- 3.3. France
- 3.4. Italy
- 3.5. Spain
- 3.6. Russia
- 3.7. Benelux
- 3.8. Nordics
- 3.9. Rest of Europe
-
4. Middle East & Africa
- 4.1. Turkey
- 4.2. Israel
- 4.3. GCC
- 4.4. North Africa
- 4.5. South Africa
- 4.6. Rest of Middle East & Africa
-
5. Asia Pacific
- 5.1. China
- 5.2. India
- 5.3. Japan
- 5.4. South Korea
- 5.5. ASEAN
- 5.6. Oceania
- 5.7. Rest of Asia Pacific
Aesthetic Simulation Software Regional Market Share
Geographic Coverage of Aesthetic Simulation Software
Aesthetic Simulation Software REPORT HIGHLIGHTS
| Aspects | Details |
|---|---|
| Study Period | 2020-2034 |
| Base Year | 2025 |
| Estimated Year | 2026 |
| Forecast Period | 2026-2034 |
| Historical Period | 2020-2025 |
| Growth Rate | CAGR of 11.74% from 2020-2034 |
| Segmentation |
|
Table of Contents
- 1. Introduction
- 1.1. Research Scope
- 1.2. Market Segmentation
- 1.3. Research Objective
- 1.4. Definitions and Assumptions
- 2. Executive Summary
- 2.1. Market Snapshot
- 3. Market Dynamics
- 3.1. Market Drivers
- 3.2. Market Restrains
- 3.3. Market Trends
- 3.4. Market Opportunities
- 4. Market Factor Analysis
- 4.1. Porters Five Forces
- 4.1.1. Bargaining Power of Suppliers
- 4.1.2. Bargaining Power of Buyers
- 4.1.3. Threat of New Entrants
- 4.1.4. Threat of Substitutes
- 4.1.5. Competitive Rivalry
- 4.2. PESTEL analysis
- 4.3. BCG Analysis
- 4.3.1. Stars (High Growth, High Market Share)
- 4.3.2. Cash Cows (Low Growth, High Market Share)
- 4.3.3. Question Mark (High Growth, Low Market Share)
- 4.3.4. Dogs (Low Growth, Low Market Share)
- 4.4. Ansoff Matrix Analysis
- 4.5. Supply Chain Analysis
- 4.6. Regulatory Landscape
- 4.7. Current Market Potential and Opportunity Assessment (TAM–SAM–SOM Framework)
- 4.8. RAX Analyst Note
- 4.1. Porters Five Forces
- 5. Market Analysis, Insights and Forecast 2021-2033
- 5.1. Market Analysis, Insights and Forecast - by Application
- 5.1.1. Plastic Surgery
- 5.1.2. Beauty Salon
- 5.1.3. Research Center
- 5.1.4. Other
- 5.2. Market Analysis, Insights and Forecast - by Types
- 5.2.1. 2D Imaging
- 5.2.2. 3D Imaging
- 5.3. Market Analysis, Insights and Forecast - by Region
- 5.3.1. North America
- 5.3.2. South America
- 5.3.3. Europe
- 5.3.4. Middle East & Africa
- 5.3.5. Asia Pacific
- 5.1. Market Analysis, Insights and Forecast - by Application
- 6. Global Aesthetic Simulation Software Analysis, Insights and Forecast, 2021-2033
- 6.1. Market Analysis, Insights and Forecast - by Application
- 6.1.1. Plastic Surgery
- 6.1.2. Beauty Salon
- 6.1.3. Research Center
- 6.1.4. Other
- 6.2. Market Analysis, Insights and Forecast - by Types
- 6.2.1. 2D Imaging
- 6.2.2. 3D Imaging
- 6.1. Market Analysis, Insights and Forecast - by Application
- 7. North America Aesthetic Simulation Software Analysis, Insights and Forecast, 2020-2032
- 7.1. Market Analysis, Insights and Forecast - by Application
- 7.1.1. Plastic Surgery
- 7.1.2. Beauty Salon
- 7.1.3. Research Center
- 7.1.4. Other
- 7.2. Market Analysis, Insights and Forecast - by Types
- 7.2.1. 2D Imaging
- 7.2.2. 3D Imaging
- 7.1. Market Analysis, Insights and Forecast - by Application
- 8. South America Aesthetic Simulation Software Analysis, Insights and Forecast, 2020-2032
- 8.1. Market Analysis, Insights and Forecast - by Application
- 8.1.1. Plastic Surgery
- 8.1.2. Beauty Salon
- 8.1.3. Research Center
- 8.1.4. Other
- 8.2. Market Analysis, Insights and Forecast - by Types
- 8.2.1. 2D Imaging
- 8.2.2. 3D Imaging
- 8.1. Market Analysis, Insights and Forecast - by Application
- 9. Europe Aesthetic Simulation Software Analysis, Insights and Forecast, 2020-2032
- 9.1. Market Analysis, Insights and Forecast - by Application
- 9.1.1. Plastic Surgery
- 9.1.2. Beauty Salon
- 9.1.3. Research Center
- 9.1.4. Other
- 9.2. Market Analysis, Insights and Forecast - by Types
- 9.2.1. 2D Imaging
- 9.2.2. 3D Imaging
- 9.1. Market Analysis, Insights and Forecast - by Application
- 10. Middle East & Africa Aesthetic Simulation Software Analysis, Insights and Forecast, 2020-2032
- 10.1. Market Analysis, Insights and Forecast - by Application
- 10.1.1. Plastic Surgery
- 10.1.2. Beauty Salon
- 10.1.3. Research Center
- 10.1.4. Other
- 10.2. Market Analysis, Insights and Forecast - by Types
- 10.2.1. 2D Imaging
- 10.2.2. 3D Imaging
- 10.1. Market Analysis, Insights and Forecast - by Application
- 11. Asia Pacific Aesthetic Simulation Software Analysis, Insights and Forecast, 2020-2032
- 11.1. Market Analysis, Insights and Forecast - by Application
- 11.1.1. Plastic Surgery
- 11.1.2. Beauty Salon
- 11.1.3. Research Center
- 11.1.4. Other
- 11.2. Market Analysis, Insights and Forecast - by Types
- 11.2.1. 2D Imaging
- 11.2.2. 3D Imaging
- 11.1. Market Analysis, Insights and Forecast - by Application
- 12. Competitive Analysis
- 12.1. Company Profiles
- 12.1.1 AlterImage for Cosmetic Surgery
- 12.1.1.1. Company Overview
- 12.1.1.2. Products
- 12.1.1.3. Company Financials
- 12.1.1.4. SWOT Analysis
- 12.1.2 Arbrea
- 12.1.2.1. Company Overview
- 12.1.2.2. Products
- 12.1.2.3. Company Financials
- 12.1.2.4. SWOT Analysis
- 12.1.3 Canfield Scientific,Inc.
- 12.1.3.1. Company Overview
- 12.1.3.2. Products
- 12.1.3.3. Company Financials
- 12.1.3.4. SWOT Analysis
- 12.1.4 Contoura
- 12.1.4.1. Company Overview
- 12.1.4.2. Products
- 12.1.4.3. Company Financials
- 12.1.4.4. SWOT Analysis
- 12.1.5 Crisalix
- 12.1.5.1. Company Overview
- 12.1.5.2. Products
- 12.1.5.3. Company Financials
- 12.1.5.4. SWOT Analysis
- 12.1.6 Paul Harris
- 12.1.6.1. Company Overview
- 12.1.6.2. Products
- 12.1.6.3. Company Financials
- 12.1.6.4. SWOT Analysis
- 12.1.7 PreVu
- 12.1.7.1. Company Overview
- 12.1.7.2. Products
- 12.1.7.3. Company Financials
- 12.1.7.4. SWOT Analysis
- 12.1.8 QuantifiCare
- 12.1.8.1. Company Overview
- 12.1.8.2. Products
- 12.1.8.3. Company Financials
- 12.1.8.4. SWOT Analysis
- 12.1.9 SNAP
- 12.1.9.1. Company Overview
- 12.1.9.2. Products
- 12.1.9.3. Company Financials
- 12.1.9.4. SWOT Analysis
- 12.1.10 X-MOL
- 12.1.10.1. Company Overview
- 12.1.10.2. Products
- 12.1.10.3. Company Financials
- 12.1.10.4. SWOT Analysis
- 12.1.1 AlterImage for Cosmetic Surgery
- 12.2. Market Entropy
- 12.2.1 Company's Key Areas Served
- 12.2.2 Recent Developments
- 12.3. Company Market Share Analysis 2025
- 12.3.1 Top 5 Companies Market Share Analysis
- 12.3.2 Top 3 Companies Market Share Analysis
- 12.4. List of Potential Customers
- 13. Research Methodology
List of Figures
- Figure 1: Global Aesthetic Simulation Software Revenue Breakdown (undefined, %) by Region 2025 & 2033
- Figure 2: North America Aesthetic Simulation Software Revenue (undefined), by Application 2025 & 2033
- Figure 3: North America Aesthetic Simulation Software Revenue Share (%), by Application 2025 & 2033
- Figure 4: North America Aesthetic Simulation Software Revenue (undefined), by Types 2025 & 2033
- Figure 5: North America Aesthetic Simulation Software Revenue Share (%), by Types 2025 & 2033
- Figure 6: North America Aesthetic Simulation Software Revenue (undefined), by Country 2025 & 2033
- Figure 7: North America Aesthetic Simulation Software Revenue Share (%), by Country 2025 & 2033
- Figure 8: South America Aesthetic Simulation Software Revenue (undefined), by Application 2025 & 2033
- Figure 9: South America Aesthetic Simulation Software Revenue Share (%), by Application 2025 & 2033
- Figure 10: South America Aesthetic Simulation Software Revenue (undefined), by Types 2025 & 2033
- Figure 11: South America Aesthetic Simulation Software Revenue Share (%), by Types 2025 & 2033
- Figure 12: South America Aesthetic Simulation Software Revenue (undefined), by Country 2025 & 2033
- Figure 13: South America Aesthetic Simulation Software Revenue Share (%), by Country 2025 & 2033
- Figure 14: Europe Aesthetic Simulation Software Revenue (undefined), by Application 2025 & 2033
- Figure 15: Europe Aesthetic Simulation Software Revenue Share (%), by Application 2025 & 2033
- Figure 16: Europe Aesthetic Simulation Software Revenue (undefined), by Types 2025 & 2033
- Figure 17: Europe Aesthetic Simulation Software Revenue Share (%), by Types 2025 & 2033
- Figure 18: Europe Aesthetic Simulation Software Revenue (undefined), by Country 2025 & 2033
- Figure 19: Europe Aesthetic Simulation Software Revenue Share (%), by Country 2025 & 2033
- Figure 20: Middle East & Africa Aesthetic Simulation Software Revenue (undefined), by Application 2025 & 2033
- Figure 21: Middle East & Africa Aesthetic Simulation Software Revenue Share (%), by Application 2025 & 2033
- Figure 22: Middle East & Africa Aesthetic Simulation Software Revenue (undefined), by Types 2025 & 2033
- Figure 23: Middle East & Africa Aesthetic Simulation Software Revenue Share (%), by Types 2025 & 2033
- Figure 24: Middle East & Africa Aesthetic Simulation Software Revenue (undefined), by Country 2025 & 2033
- Figure 25: Middle East & Africa Aesthetic Simulation Software Revenue Share (%), by Country 2025 & 2033
- Figure 26: Asia Pacific Aesthetic Simulation Software Revenue (undefined), by Application 2025 & 2033
- Figure 27: Asia Pacific Aesthetic Simulation Software Revenue Share (%), by Application 2025 & 2033
- Figure 28: Asia Pacific Aesthetic Simulation Software Revenue (undefined), by Types 2025 & 2033
- Figure 29: Asia Pacific Aesthetic Simulation Software Revenue Share (%), by Types 2025 & 2033
- Figure 30: Asia Pacific Aesthetic Simulation Software Revenue (undefined), by Country 2025 & 2033
- Figure 31: Asia Pacific Aesthetic Simulation Software Revenue Share (%), by Country 2025 & 2033
List of Tables
- Table 1: Global Aesthetic Simulation Software Revenue undefined Forecast, by Application 2020 & 2033
- Table 2: Global Aesthetic Simulation Software Revenue undefined Forecast, by Types 2020 & 2033
- Table 3: Global Aesthetic Simulation Software Revenue undefined Forecast, by Region 2020 & 2033
- Table 4: Global Aesthetic Simulation Software Revenue undefined Forecast, by Application 2020 & 2033
- Table 5: Global Aesthetic Simulation Software Revenue undefined Forecast, by Types 2020 & 2033
- Table 6: Global Aesthetic Simulation Software Revenue undefined Forecast, by Country 2020 & 2033
- Table 7: United States Aesthetic Simulation Software Revenue (undefined) Forecast, by Application 2020 & 2033
- Table 8: Canada Aesthetic Simulation Software Revenue (undefined) Forecast, by Application 2020 & 2033
- Table 9: Mexico Aesthetic Simulation Software Revenue (undefined) Forecast, by Application 2020 & 2033
- Table 10: Global Aesthetic Simulation Software Revenue undefined Forecast, by Application 2020 & 2033
- Table 11: Global Aesthetic Simulation Software Revenue undefined Forecast, by Types 2020 & 2033
- Table 12: Global Aesthetic Simulation Software Revenue undefined Forecast, by Country 2020 & 2033
- Table 13: Brazil Aesthetic Simulation Software Revenue (undefined) Forecast, by Application 2020 & 2033
- Table 14: Argentina Aesthetic Simulation Software Revenue (undefined) Forecast, by Application 2020 & 2033
- Table 15: Rest of South America Aesthetic Simulation Software Revenue (undefined) Forecast, by Application 2020 & 2033
- Table 16: Global Aesthetic Simulation Software Revenue undefined Forecast, by Application 2020 & 2033
- Table 17: Global Aesthetic Simulation Software Revenue undefined Forecast, by Types 2020 & 2033
- Table 18: Global Aesthetic Simulation Software Revenue undefined Forecast, by Country 2020 & 2033
- Table 19: United Kingdom Aesthetic Simulation Software Revenue (undefined) Forecast, by Application 2020 & 2033
- Table 20: Germany Aesthetic Simulation Software Revenue (undefined) Forecast, by Application 2020 & 2033
- Table 21: France Aesthetic Simulation Software Revenue (undefined) Forecast, by Application 2020 & 2033
- Table 22: Italy Aesthetic Simulation Software Revenue (undefined) Forecast, by Application 2020 & 2033
- Table 23: Spain Aesthetic Simulation Software Revenue (undefined) Forecast, by Application 2020 & 2033
- Table 24: Russia Aesthetic Simulation Software Revenue (undefined) Forecast, by Application 2020 & 2033
- Table 25: Benelux Aesthetic Simulation Software Revenue (undefined) Forecast, by Application 2020 & 2033
- Table 26: Nordics Aesthetic Simulation Software Revenue (undefined) Forecast, by Application 2020 & 2033
- Table 27: Rest of Europe Aesthetic Simulation Software Revenue (undefined) Forecast, by Application 2020 & 2033
- Table 28: Global Aesthetic Simulation Software Revenue undefined Forecast, by Application 2020 & 2033
- Table 29: Global Aesthetic Simulation Software Revenue undefined Forecast, by Types 2020 & 2033
- Table 30: Global Aesthetic Simulation Software Revenue undefined Forecast, by Country 2020 & 2033
- Table 31: Turkey Aesthetic Simulation Software Revenue (undefined) Forecast, by Application 2020 & 2033
- Table 32: Israel Aesthetic Simulation Software Revenue (undefined) Forecast, by Application 2020 & 2033
- Table 33: GCC Aesthetic Simulation Software Revenue (undefined) Forecast, by Application 2020 & 2033
- Table 34: North Africa Aesthetic Simulation Software Revenue (undefined) Forecast, by Application 2020 & 2033
- Table 35: South Africa Aesthetic Simulation Software Revenue (undefined) Forecast, by Application 2020 & 2033
- Table 36: Rest of Middle East & Africa Aesthetic Simulation Software Revenue (undefined) Forecast, by Application 2020 & 2033
- Table 37: Global Aesthetic Simulation Software Revenue undefined Forecast, by Application 2020 & 2033
- Table 38: Global Aesthetic Simulation Software Revenue undefined Forecast, by Types 2020 & 2033
- Table 39: Global Aesthetic Simulation Software Revenue undefined Forecast, by Country 2020 & 2033
- Table 40: China Aesthetic Simulation Software Revenue (undefined) Forecast, by Application 2020 & 2033
- Table 41: India Aesthetic Simulation Software Revenue (undefined) Forecast, by Application 2020 & 2033
- Table 42: Japan Aesthetic Simulation Software Revenue (undefined) Forecast, by Application 2020 & 2033
- Table 43: South Korea Aesthetic Simulation Software Revenue (undefined) Forecast, by Application 2020 & 2033
- Table 44: ASEAN Aesthetic Simulation Software Revenue (undefined) Forecast, by Application 2020 & 2033
- Table 45: Oceania Aesthetic Simulation Software Revenue (undefined) Forecast, by Application 2020 & 2033
- Table 46: Rest of Asia Pacific Aesthetic Simulation Software Revenue (undefined) Forecast, by Application 2020 & 2033
Frequently Asked Questions
1. What is the projected Compound Annual Growth Rate (CAGR) of the Aesthetic Simulation Software?
The projected CAGR is approximately 11.74%.
2. Which companies are prominent players in the Aesthetic Simulation Software?
Key companies in the market include AlterImage for Cosmetic Surgery, Arbrea, Canfield Scientific,Inc., Contoura, Crisalix, Paul Harris, PreVu, QuantifiCare, SNAP, X-MOL.
3. What are the main segments of the Aesthetic Simulation Software?
The market segments include Application, Types.
4. Can you provide details about the market size?
The market size is estimated to be USD XXX N/A as of 2022.
5. What are some drivers contributing to market growth?
N/A
6. What are the notable trends driving market growth?
N/A
7. Are there any restraints impacting market growth?
N/A
8. Can you provide examples of recent developments in the market?
N/A
9. What pricing options are available for accessing the report?
Pricing options include single-user, multi-user, and enterprise licenses priced at USD 3350.00, USD 5025.00, and USD 6700.00 respectively.
10. Is the market size provided in terms of value or volume?
The market size is provided in terms of value, measured in N/A.
11. Are there any specific market keywords associated with the report?
Yes, the market keyword associated with the report is "Aesthetic Simulation Software," which aids in identifying and referencing the specific market segment covered.
12. How do I determine which pricing option suits my needs best?
The pricing options vary based on user requirements and access needs. Individual users may opt for single-user licenses, while businesses requiring broader access may choose multi-user or enterprise licenses for cost-effective access to the report.
13. Are there any additional resources or data provided in the Aesthetic Simulation Software report?
While the report offers comprehensive insights, it's advisable to review the specific contents or supplementary materials provided to ascertain if additional resources or data are available.
14. How can I stay updated on further developments or reports in the Aesthetic Simulation Software?
To stay informed about further developments, trends, and reports in the Aesthetic Simulation Software, consider subscribing to industry newsletters, following relevant companies and organizations, or regularly checking reputable industry news sources and publications.
Methodology
Step 1 - Identification of Relevant Samples Size from Population Database


Step 2 - Approaches for Defining Global Market Size (Value, Volume* & Price*)

Note*: In applicable scenarios
Step 3 - Data Sources
Primary Research
- Web Analytics
- Survey Reports
- Research Institute
- Latest Research Reports
- Opinion Leaders
Secondary Research
- Annual Reports
- White Paper
- Latest Press Release
- Industry Association
- Paid Database
- Investor Presentations

Step 4 - Data Triangulation
Involves using different sources of information in order to increase the validity of a study
These sources are likely to be stakeholders in a program - participants, other researchers, program staff, other community members, and so on.
Then we put all data in single framework & apply various statistical tools to find out the dynamic on the market.
During the analysis stage, feedback from the stakeholder groups would be compared to determine areas of agreement as well as areas of divergence