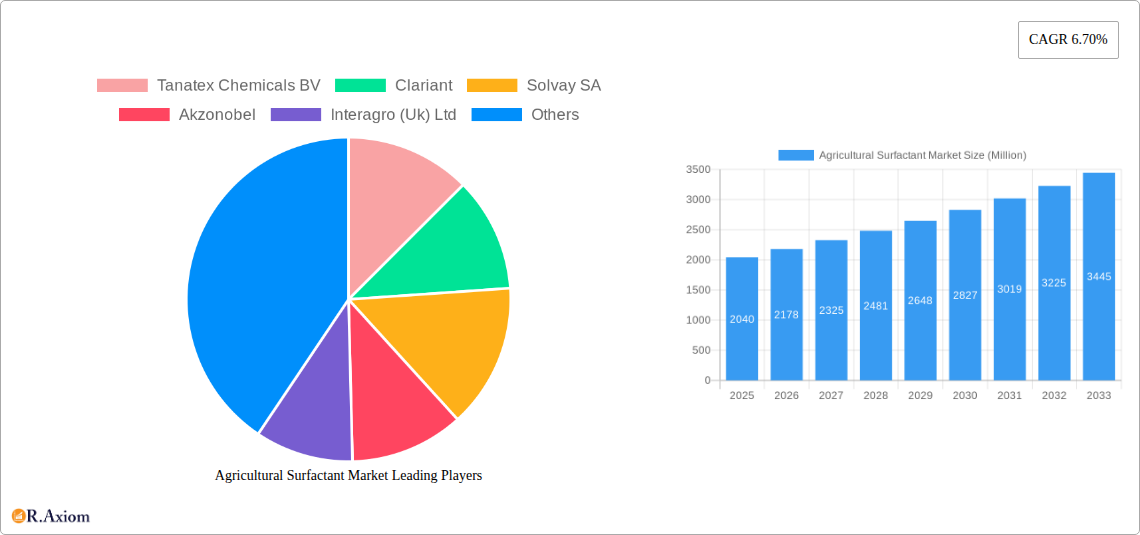
Key Insights
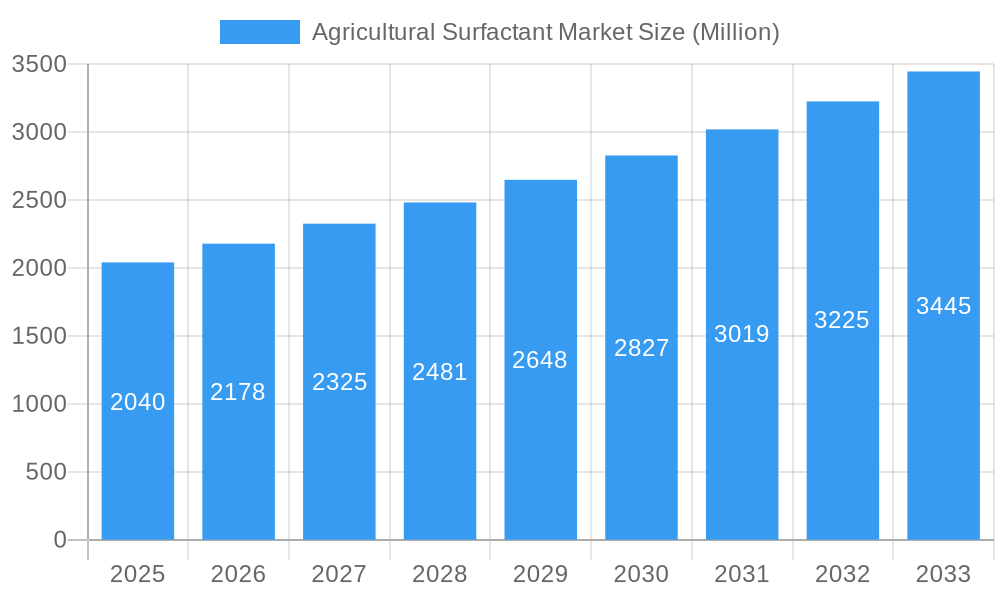
The global Agricultural Surfactant Market is poised for substantial expansion, projected to reach a valuation of $2.04 billion. This growth trajectory is fueled by a compelling compound annual growth rate (CAGR) of 6.70% from 2025 through 2033. Surfactants are indispensable in modern agriculture, acting as crucial adjuvants that enhance the efficacy of pesticides, herbicides, and fertilizers. Their ability to improve wetting, spreading, and penetration on plant surfaces, as well as increase the solubility and stability of active ingredients, directly contributes to improved crop yields and reduced application rates. This heightened efficiency translates to more sustainable farming practices, aligning with the growing global demand for food production while minimizing environmental impact. The increasing adoption of precision agriculture techniques, which rely on optimized application of crop inputs, further amplifies the need for high-performance surfactants.
Agricultural Surfactant Market Market Size (In Billion)
Several key drivers are propelling this market forward. The escalating global population necessitates increased food production, placing immense pressure on agricultural output and driving the demand for advanced crop protection and nutrient delivery systems. Furthermore, the growing awareness and adoption of sustainable agricultural practices are encouraging the use of surfactants that enable more targeted and efficient application of agrochemicals, thereby reducing waste and environmental pollution. Technological advancements in surfactant formulations, leading to more biodegradable and environmentally friendly options, are also contributing to market growth. Despite these positive trends, challenges such as fluctuating raw material prices, stringent regulatory landscapes in certain regions, and the development of pest resistance to existing agrochemicals could present moderate restraints. However, the overarching need for enhanced agricultural productivity and resource efficiency ensures a robust and upward market trajectory.
Agricultural Surfactant Market Company Market Share
Agricultural Surfactant Market Market Concentration & Innovation
The global agricultural surfactant market exhibits a moderate to high level of concentration, with several multinational chemical giants holding significant market share. Key players such as BASF SE, Clariant, and Evonik Industries lead the pack through extensive R&D investments and broad product portfolios. Innovation is a critical differentiator, driven by the demand for more effective, environmentally friendly, and cost-efficient crop protection solutions. Companies are focusing on developing bio-based and biodegradable surfactants, alongside formulations that enhance pesticide efficacy and reduce drift. Regulatory frameworks, particularly concerning environmental impact and safety, play a crucial role in shaping product development and market access. The increasing scrutiny on chemical inputs in agriculture is pushing manufacturers towards sustainable alternatives. Product substitutes, primarily other adjuvants and formulation enhancers, are present but often lack the specific performance benefits offered by tailored surfactants. End-user trends highlight a growing preference for integrated pest management (IPM) strategies, where surfactants are crucial for optimizing the performance of biological and reduced-chemical inputs. Merger and acquisition (M&A) activities are selective, often targeting smaller, innovative companies with specialized technologies or niche market access. For instance, a hypothetical M&A deal in the past year might have been valued at around $50 million, aimed at acquiring a company with a patented bio-surfactant technology. The market share of top players can range from 10% to 15% individually, with the top 5-7 companies collectively holding over 50% of the global market.
Agricultural Surfactant Market Industry Trends & Insights
The agricultural surfactant market is experiencing robust growth, fueled by the escalating global demand for food and the continuous need to enhance crop yields and quality. The CAGR for this sector is projected to be approximately 5.5% over the forecast period of 2025–2033. This sustained expansion is largely driven by the increasing adoption of advanced agricultural practices, including precision agriculture and the use of more sophisticated crop protection products. Surfactants, as essential adjuvants, are instrumental in improving the efficacy of pesticides, herbicides, and fertilizers by enhancing their spreading, wetting, and penetration properties on plant surfaces. This leads to reduced application rates of active ingredients, translating into both economic benefits for farmers and a lower environmental footprint. The rising global population, expected to reach over 9 billion by 2050, necessitates increased food production, thereby boosting the demand for agricultural inputs, including surfactants. Furthermore, the growing awareness among farmers about sustainable agriculture and the need to optimize resource utilization – such as water and chemical inputs – further propels the market. Technological advancements are constantly introducing novel surfactant chemistries, including low-foaming, drift-reduction, and water-saving formulations, catering to these evolving demands. The market penetration of surfactants in developed agricultural economies is already high, with a focus now shifting towards emerging markets in Asia-Pacific and Latin America, where agricultural modernization is rapidly underway. Consumer preferences, influenced by food safety concerns and a demand for sustainably produced food, are indirectly driving the adoption of more effective and environmentally benign crop management solutions, where surfactants play a pivotal role. Competitive dynamics are characterized by intense innovation, strategic partnerships, and a focus on cost-competitiveness. Companies are investing heavily in R&D to develop bio-based and biodegradable surfactants that meet stringent environmental regulations and consumer expectations. The shift towards digital agriculture also presents opportunities, with smart formulations and application technologies integrating surfactants for optimal performance.
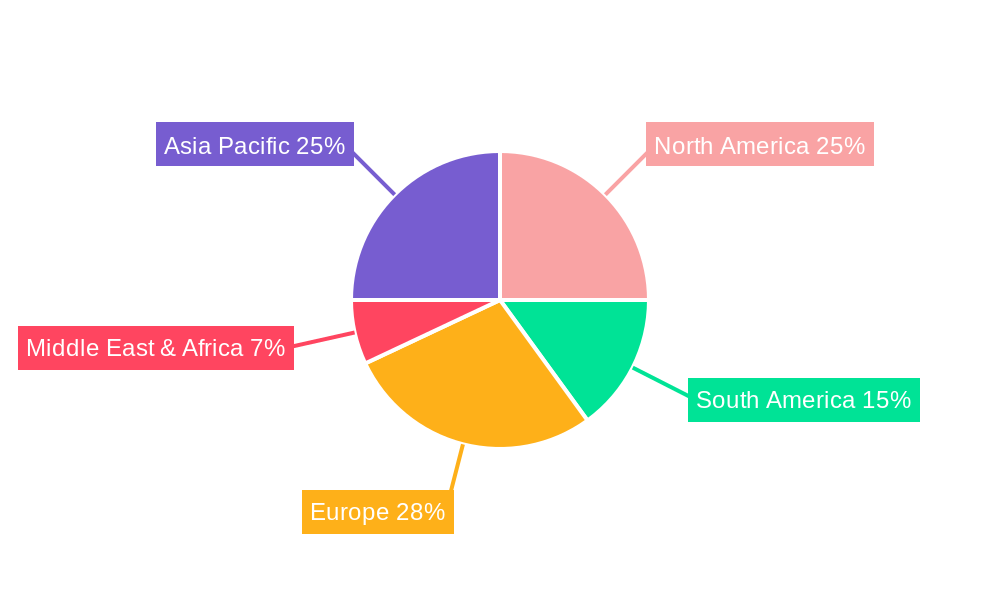
Dominant Markets & Segments in Agricultural Surfactant Market
The North America region currently dominates the agricultural surfactant market, driven by its advanced agricultural infrastructure, high adoption rates of modern farming techniques, and significant investments in crop protection research and development. Within North America, the United States stands out as the largest individual market, accounting for approximately 30% of the global consumption volume. Key drivers for this dominance include the extensive use of genetically modified crops requiring specific adjuvant technologies, a strong emphasis on crop yield optimization, and supportive government policies promoting agricultural innovation.
Production Analysis: The production landscape is characterized by significant capacity in North America and Europe, with major chemical manufacturers operating large-scale facilities. Asia-Pacific, particularly China and India, is emerging as a key production hub due to lower manufacturing costs and increasing domestic demand. The production of non-ionic surfactants represents a substantial portion of the overall market, driven by their broad applicability and efficacy across various agrochemical formulations.
Consumption Analysis: Consumption is closely aligned with agricultural output and the intensity of crop protection practices. North America leads due to its large-scale farming operations and the widespread use of pesticides and herbicides. Europe follows, with a strong focus on sustainable agriculture and integrated pest management, driving the demand for specialized surfactants. The Asia-Pacific region is the fastest-growing consumer market, fueled by agricultural intensification and the expansion of cultivation areas.
Import Market Analysis (Value & Volume): North America and Europe are significant importers, seeking specialized surfactant technologies and raw materials. The value of imports is often higher in these regions due to the premium placed on advanced formulations. Asia-Pacific countries are increasingly importing both finished surfactant products and raw materials to meet their rapidly growing domestic demand, with import volumes showing a significant upward trend.
Export Market Analysis (Value & Volume): Major chemical-producing nations like Germany, the United States, and China are key exporters of agricultural surfactants. Their competitive advantage lies in economies of scale, technological expertise, and established distribution networks. Exports are often directed towards regions with developing agricultural sectors that require accessible and effective crop protection solutions.
Price Trend Analysis: Price trends are influenced by raw material costs (primarily petrochemical derivatives), energy prices, and the supply-demand balance. The price of non-ionic surfactants, for instance, has seen upward pressure in recent years due to increasing demand in the agricultural input sector and rising feedstock costs, as evidenced by BASF's price increase in September 2021. Specialized and bio-based surfactants command higher prices due to their advanced properties and sustainable attributes.
Agricultural Surfactant Market Product Developments
Recent product developments in the agricultural surfactant market focus on enhancing the performance and sustainability of agrochemical applications. Innovations are centered on creating surfactants that improve the deposition and retention of pesticides, reduce spray drift, and increase the rainfastness of formulations. A significant trend is the development of bio-based and biodegradable surfactants derived from renewable resources, aligning with the global push for environmentally friendly agricultural practices. Companies are also introducing novel silicone-based surfactants, like Dow's VORASURF™ series, which offer unique properties for enhanced energy efficiency in applications like rigid polyurethane foam, highlighting a cross-industry application of surfactant technology. These advancements aim to provide farmers with more effective, safer, and sustainable solutions for crop protection and yield enhancement.
Report Scope & Segmentation Analysis
The agricultural surfactant market is segmented based on product type, including non-ionic, anionic, cationic, and amphoteric surfactants. The market is also analyzed by application, such as herbicides, insecticides, fungicides, and fertilizers. Geographically, the report covers key regions like North America, Europe, Asia-Pacific, Latin America, and the Middle East & Africa. Production analysis tracks manufacturing capacities and output across different segments. Consumption analysis delves into the usage patterns by crop type and application area. Import and export market analyses provide insights into global trade flows, valuing both the volume and monetary aspects of international trade. Price trend analysis examines historical and projected price fluctuations for key surfactant types and their impact on market dynamics. Growth projections for each segment are meticulously detailed, offering a comprehensive understanding of market sizes and competitive landscapes.
Key Drivers of Agricultural Surfactant Market Growth
Several key drivers are propelling the growth of the agricultural surfactant market. The escalating global food demand, necessitating increased agricultural productivity, is a primary catalyst. Advancements in agrochemical formulations, where surfactants are vital for optimizing the efficacy of pesticides and herbicides, further fuel demand. The growing adoption of precision agriculture and integrated pest management strategies relies heavily on sophisticated adjuvant technologies, including surfactants, to ensure targeted and efficient application of inputs. Furthermore, increasing environmental awareness and stricter regulations are driving the development and adoption of more sustainable, bio-based, and biodegradable surfactant solutions. Government initiatives supporting agricultural modernization and research also contribute to market expansion.
Challenges in the Agricultural Surfactant Market Sector
The agricultural surfactant market faces several challenges that can hinder its growth trajectory. Stringent regulatory hurdles and evolving environmental standards across different regions require continuous product reformulation and compliance testing, increasing R&D costs. Fluctuations in the prices of petrochemical feedstocks, which are primary raw materials for many surfactants, can lead to price volatility and impact profit margins. Supply chain disruptions, exacerbated by geopolitical events and logistics challenges, can affect the availability and cost of raw materials and finished products. Intense competition among established players and new entrants, particularly in the generic agrochemical segment, can lead to price pressures. Furthermore, the slow adoption of new technologies and products in some traditional farming communities can limit market penetration.
Emerging Opportunities in Agricultural Surfactant Market
Emerging opportunities in the agricultural surfactant market are largely driven by the growing demand for sustainable and bio-based solutions. The development of novel surfactant chemistries that enhance the efficacy of biological pesticides and biostimulants presents a significant opportunity. The expansion of precision agriculture technologies, requiring advanced adjuvant formulations for targeted application, also opens new avenues. Emerging economies in Asia-Pacific and Latin America, with their rapidly modernizing agricultural sectors, offer substantial untapped market potential. Innovations in smart packaging and delivery systems for agrochemicals, incorporating optimized surfactant formulations, also represent a promising area. Furthermore, the increasing focus on crop health and soil microbiome management may lead to new applications for specialized surfactants.
Leading Players in the Agricultural Surfactant Market Market
- Tanatex Chemicals BV
- Clariant
- Solvay SA
- Akzonobel
- Interagro (Uk) Ltd
- Brandt Consolidated Inc
- Garrco Products Inc
- Lamberti SPA
- Kao Corporation
- Helena Chemical Company
- Air Products and Chemicals
- Nufarm Limited
- Wilbur-Ellis Company
- Huntsman
- Corteva Agriscience
- Croda International PLC
- Evonik Industries
- BASF SE
Key Developments in Agricultural Surfactant Market Industry
- March 2022: Dow announced a new product extension of VORASURF™ Silicone Surfactants to support the growing demand for enhanced energy efficiency and sustainable solutions in the rigid polyurethane foam market, with a specific focus on spray and construction applications.
- September 2021: BASF increased prices for non-ionic surfactants due to increasing demand in the agricultural input sector, including herbicides and insecticides.
- March 2021: BASF signed two distinct partnership agreements to expand its leading position in the bio-based surfactants and actives market.
Strategic Outlook for Agricultural Surfactant Market Market
The strategic outlook for the agricultural surfactant market remains optimistic, driven by sustained global food demand and the imperative for more efficient and sustainable agricultural practices. Growth catalysts include ongoing innovation in bio-based and high-performance surfactants, catering to the increasing demand for environmentally friendly solutions. The expansion of precision agriculture, coupled with the adoption of advanced crop protection technologies, will continue to drive demand for specialized adjuvants. Emerging markets in Asia-Pacific and Latin America represent significant opportunities for market penetration, owing to their developing agricultural sectors and increasing investments in modernization. Strategic collaborations, product portfolio expansions, and a focus on regulatory compliance will be key for companies to maintain and enhance their competitive positions in this dynamic market.
Agricultural Surfactant Market Segmentation
- 1. Production Analysis
- 2. Consumption Analysis
- 3. Import Market Analysis (Value & Volume)
- 4. Export Market Analysis (Value & Volume)
- 5. Price Trend Analysis
Agricultural Surfactant Market Segmentation By Geography
-
1. North America
- 1.1. United States
- 1.2. Canada
- 1.3. Mexico
-
2. South America
- 2.1. Brazil
- 2.2. Argentina
- 2.3. Rest of South America
-
3. Europe
- 3.1. United Kingdom
- 3.2. Germany
- 3.3. France
- 3.4. Italy
- 3.5. Spain
- 3.6. Russia
- 3.7. Benelux
- 3.8. Nordics
- 3.9. Rest of Europe
-
4. Middle East & Africa
- 4.1. Turkey
- 4.2. Israel
- 4.3. GCC
- 4.4. North Africa
- 4.5. South Africa
- 4.6. Rest of Middle East & Africa
-
5. Asia Pacific
- 5.1. China
- 5.2. India
- 5.3. Japan
- 5.4. South Korea
- 5.5. ASEAN
- 5.6. Oceania
- 5.7. Rest of Asia Pacific
Agricultural Surfactant Market Regional Market Share
Geographic Coverage of Agricultural Surfactant Market
Agricultural Surfactant Market REPORT HIGHLIGHTS
| Aspects | Details |
|---|---|
| Study Period | 2020-2034 |
| Base Year | 2025 |
| Estimated Year | 2026 |
| Forecast Period | 2026-2034 |
| Historical Period | 2020-2025 |
| Growth Rate | CAGR of 6.70% from 2020-2034 |
| Segmentation |
|
Table of Contents
- 1. Introduction
- 1.1. Research Scope
- 1.2. Market Segmentation
- 1.3. Research Objective
- 1.4. Definitions and Assumptions
- 2. Executive Summary
- 2.1. Market Snapshot
- 3. Market Dynamics
- 3.1. Market Drivers
- 3.2. Market Restrains
- 3.3. Market Trends
- 3.4. Market Opportunities
- 4. Market Factor Analysis
- 4.1. Porters Five Forces
- 4.1.1. Bargaining Power of Suppliers
- 4.1.2. Bargaining Power of Buyers
- 4.1.3. Threat of New Entrants
- 4.1.4. Threat of Substitutes
- 4.1.5. Competitive Rivalry
- 4.2. PESTEL analysis
- 4.3. BCG Analysis
- 4.3.1. Stars (High Growth, High Market Share)
- 4.3.2. Cash Cows (Low Growth, High Market Share)
- 4.3.3. Question Mark (High Growth, Low Market Share)
- 4.3.4. Dogs (Low Growth, Low Market Share)
- 4.4. Ansoff Matrix Analysis
- 4.5. Supply Chain Analysis
- 4.6. Regulatory Landscape
- 4.7. Current Market Potential and Opportunity Assessment (TAM–SAM–SOM Framework)
- 4.8. RAX Analyst Note
- 4.1. Porters Five Forces
- 5. Market Analysis, Insights and Forecast 2021-2033
- 5.1. Market Analysis, Insights and Forecast - by Production Analysis
- 5.2. Market Analysis, Insights and Forecast - by Consumption Analysis
- 5.3. Market Analysis, Insights and Forecast - by Import Market Analysis (Value & Volume)
- 5.4. Market Analysis, Insights and Forecast - by Export Market Analysis (Value & Volume)
- 5.5. Market Analysis, Insights and Forecast - by Price Trend Analysis
- 5.6. Market Analysis, Insights and Forecast - by Region
- 5.6.1. North America
- 5.6.2. South America
- 5.6.3. Europe
- 5.6.4. Middle East & Africa
- 5.6.5. Asia Pacific
- 6. Global Agricultural Surfactant Market Analysis, Insights and Forecast, 2021-2033
- 6.1. Market Analysis, Insights and Forecast - by Production Analysis
- 6.2. Market Analysis, Insights and Forecast - by Consumption Analysis
- 6.3. Market Analysis, Insights and Forecast - by Import Market Analysis (Value & Volume)
- 6.4. Market Analysis, Insights and Forecast - by Export Market Analysis (Value & Volume)
- 6.5. Market Analysis, Insights and Forecast - by Price Trend Analysis
- 7. North America Agricultural Surfactant Market Analysis, Insights and Forecast, 2020-2032
- 7.1. Market Analysis, Insights and Forecast - by Production Analysis
- 7.2. Market Analysis, Insights and Forecast - by Consumption Analysis
- 7.3. Market Analysis, Insights and Forecast - by Import Market Analysis (Value & Volume)
- 7.4. Market Analysis, Insights and Forecast - by Export Market Analysis (Value & Volume)
- 7.5. Market Analysis, Insights and Forecast - by Price Trend Analysis
- 8. South America Agricultural Surfactant Market Analysis, Insights and Forecast, 2020-2032
- 8.1. Market Analysis, Insights and Forecast - by Production Analysis
- 8.2. Market Analysis, Insights and Forecast - by Consumption Analysis
- 8.3. Market Analysis, Insights and Forecast - by Import Market Analysis (Value & Volume)
- 8.4. Market Analysis, Insights and Forecast - by Export Market Analysis (Value & Volume)
- 8.5. Market Analysis, Insights and Forecast - by Price Trend Analysis
- 9. Europe Agricultural Surfactant Market Analysis, Insights and Forecast, 2020-2032
- 9.1. Market Analysis, Insights and Forecast - by Production Analysis
- 9.2. Market Analysis, Insights and Forecast - by Consumption Analysis
- 9.3. Market Analysis, Insights and Forecast - by Import Market Analysis (Value & Volume)
- 9.4. Market Analysis, Insights and Forecast - by Export Market Analysis (Value & Volume)
- 9.5. Market Analysis, Insights and Forecast - by Price Trend Analysis
- 10. Middle East & Africa Agricultural Surfactant Market Analysis, Insights and Forecast, 2020-2032
- 10.1. Market Analysis, Insights and Forecast - by Production Analysis
- 10.2. Market Analysis, Insights and Forecast - by Consumption Analysis
- 10.3. Market Analysis, Insights and Forecast - by Import Market Analysis (Value & Volume)
- 10.4. Market Analysis, Insights and Forecast - by Export Market Analysis (Value & Volume)
- 10.5. Market Analysis, Insights and Forecast - by Price Trend Analysis
- 11. Asia Pacific Agricultural Surfactant Market Analysis, Insights and Forecast, 2020-2032
- 11.1. Market Analysis, Insights and Forecast - by Production Analysis
- 11.2. Market Analysis, Insights and Forecast - by Consumption Analysis
- 11.3. Market Analysis, Insights and Forecast - by Import Market Analysis (Value & Volume)
- 11.4. Market Analysis, Insights and Forecast - by Export Market Analysis (Value & Volume)
- 11.5. Market Analysis, Insights and Forecast - by Price Trend Analysis
- 12. Competitive Analysis
- 12.1. Company Profiles
- 12.1.1 Tanatex Chemicals BV
- 12.1.1.1. Company Overview
- 12.1.1.2. Products
- 12.1.1.3. Company Financials
- 12.1.1.4. SWOT Analysis
- 12.1.2 Clariant
- 12.1.2.1. Company Overview
- 12.1.2.2. Products
- 12.1.2.3. Company Financials
- 12.1.2.4. SWOT Analysis
- 12.1.3 Solvay SA
- 12.1.3.1. Company Overview
- 12.1.3.2. Products
- 12.1.3.3. Company Financials
- 12.1.3.4. SWOT Analysis
- 12.1.4 Akzonobel
- 12.1.4.1. Company Overview
- 12.1.4.2. Products
- 12.1.4.3. Company Financials
- 12.1.4.4. SWOT Analysis
- 12.1.5 Interagro (Uk) Ltd
- 12.1.5.1. Company Overview
- 12.1.5.2. Products
- 12.1.5.3. Company Financials
- 12.1.5.4. SWOT Analysis
- 12.1.6 Brandt Consolidated Inc
- 12.1.6.1. Company Overview
- 12.1.6.2. Products
- 12.1.6.3. Company Financials
- 12.1.6.4. SWOT Analysis
- 12.1.7 Garrco Products Inc
- 12.1.7.1. Company Overview
- 12.1.7.2. Products
- 12.1.7.3. Company Financials
- 12.1.7.4. SWOT Analysis
- 12.1.8 Lamberti SPA
- 12.1.8.1. Company Overview
- 12.1.8.2. Products
- 12.1.8.3. Company Financials
- 12.1.8.4. SWOT Analysis
- 12.1.9 Kao Corporation
- 12.1.9.1. Company Overview
- 12.1.9.2. Products
- 12.1.9.3. Company Financials
- 12.1.9.4. SWOT Analysis
- 12.1.10 Helena Chemical Company
- 12.1.10.1. Company Overview
- 12.1.10.2. Products
- 12.1.10.3. Company Financials
- 12.1.10.4. SWOT Analysis
- 12.1.11 Air Products and Chemicals
- 12.1.11.1. Company Overview
- 12.1.11.2. Products
- 12.1.11.3. Company Financials
- 12.1.11.4. SWOT Analysis
- 12.1.12 Nufarm Limited
- 12.1.12.1. Company Overview
- 12.1.12.2. Products
- 12.1.12.3. Company Financials
- 12.1.12.4. SWOT Analysis
- 12.1.13 Wilbur-Ellis Company
- 12.1.13.1. Company Overview
- 12.1.13.2. Products
- 12.1.13.3. Company Financials
- 12.1.13.4. SWOT Analysis
- 12.1.14 Huntsman
- 12.1.14.1. Company Overview
- 12.1.14.2. Products
- 12.1.14.3. Company Financials
- 12.1.14.4. SWOT Analysis
- 12.1.15 Corteva Agriscience
- 12.1.15.1. Company Overview
- 12.1.15.2. Products
- 12.1.15.3. Company Financials
- 12.1.15.4. SWOT Analysis
- 12.1.16 Croda International PLC
- 12.1.16.1. Company Overview
- 12.1.16.2. Products
- 12.1.16.3. Company Financials
- 12.1.16.4. SWOT Analysis
- 12.1.17 Evonik Industries
- 12.1.17.1. Company Overview
- 12.1.17.2. Products
- 12.1.17.3. Company Financials
- 12.1.17.4. SWOT Analysis
- 12.1.18 BASF SE
- 12.1.18.1. Company Overview
- 12.1.18.2. Products
- 12.1.18.3. Company Financials
- 12.1.18.4. SWOT Analysis
- 12.1.1 Tanatex Chemicals BV
- 12.2. Market Entropy
- 12.2.1 Company's Key Areas Served
- 12.2.2 Recent Developments
- 12.3. Company Market Share Analysis 2025
- 12.3.1 Top 5 Companies Market Share Analysis
- 12.3.2 Top 3 Companies Market Share Analysis
- 12.4. List of Potential Customers
- 13. Research Methodology
List of Figures
- Figure 1: Global Agricultural Surfactant Market Revenue Breakdown (Million, %) by Region 2025 & 2033
- Figure 2: North America Agricultural Surfactant Market Revenue (Million), by Production Analysis 2025 & 2033
- Figure 3: North America Agricultural Surfactant Market Revenue Share (%), by Production Analysis 2025 & 2033
- Figure 4: North America Agricultural Surfactant Market Revenue (Million), by Consumption Analysis 2025 & 2033
- Figure 5: North America Agricultural Surfactant Market Revenue Share (%), by Consumption Analysis 2025 & 2033
- Figure 6: North America Agricultural Surfactant Market Revenue (Million), by Import Market Analysis (Value & Volume) 2025 & 2033
- Figure 7: North America Agricultural Surfactant Market Revenue Share (%), by Import Market Analysis (Value & Volume) 2025 & 2033
- Figure 8: North America Agricultural Surfactant Market Revenue (Million), by Export Market Analysis (Value & Volume) 2025 & 2033
- Figure 9: North America Agricultural Surfactant Market Revenue Share (%), by Export Market Analysis (Value & Volume) 2025 & 2033
- Figure 10: North America Agricultural Surfactant Market Revenue (Million), by Price Trend Analysis 2025 & 2033
- Figure 11: North America Agricultural Surfactant Market Revenue Share (%), by Price Trend Analysis 2025 & 2033
- Figure 12: North America Agricultural Surfactant Market Revenue (Million), by Country 2025 & 2033
- Figure 13: North America Agricultural Surfactant Market Revenue Share (%), by Country 2025 & 2033
- Figure 14: South America Agricultural Surfactant Market Revenue (Million), by Production Analysis 2025 & 2033
- Figure 15: South America Agricultural Surfactant Market Revenue Share (%), by Production Analysis 2025 & 2033
- Figure 16: South America Agricultural Surfactant Market Revenue (Million), by Consumption Analysis 2025 & 2033
- Figure 17: South America Agricultural Surfactant Market Revenue Share (%), by Consumption Analysis 2025 & 2033
- Figure 18: South America Agricultural Surfactant Market Revenue (Million), by Import Market Analysis (Value & Volume) 2025 & 2033
- Figure 19: South America Agricultural Surfactant Market Revenue Share (%), by Import Market Analysis (Value & Volume) 2025 & 2033
- Figure 20: South America Agricultural Surfactant Market Revenue (Million), by Export Market Analysis (Value & Volume) 2025 & 2033
- Figure 21: South America Agricultural Surfactant Market Revenue Share (%), by Export Market Analysis (Value & Volume) 2025 & 2033
- Figure 22: South America Agricultural Surfactant Market Revenue (Million), by Price Trend Analysis 2025 & 2033
- Figure 23: South America Agricultural Surfactant Market Revenue Share (%), by Price Trend Analysis 2025 & 2033
- Figure 24: South America Agricultural Surfactant Market Revenue (Million), by Country 2025 & 2033
- Figure 25: South America Agricultural Surfactant Market Revenue Share (%), by Country 2025 & 2033
- Figure 26: Europe Agricultural Surfactant Market Revenue (Million), by Production Analysis 2025 & 2033
- Figure 27: Europe Agricultural Surfactant Market Revenue Share (%), by Production Analysis 2025 & 2033
- Figure 28: Europe Agricultural Surfactant Market Revenue (Million), by Consumption Analysis 2025 & 2033
- Figure 29: Europe Agricultural Surfactant Market Revenue Share (%), by Consumption Analysis 2025 & 2033
- Figure 30: Europe Agricultural Surfactant Market Revenue (Million), by Import Market Analysis (Value & Volume) 2025 & 2033
- Figure 31: Europe Agricultural Surfactant Market Revenue Share (%), by Import Market Analysis (Value & Volume) 2025 & 2033
- Figure 32: Europe Agricultural Surfactant Market Revenue (Million), by Export Market Analysis (Value & Volume) 2025 & 2033
- Figure 33: Europe Agricultural Surfactant Market Revenue Share (%), by Export Market Analysis (Value & Volume) 2025 & 2033
- Figure 34: Europe Agricultural Surfactant Market Revenue (Million), by Price Trend Analysis 2025 & 2033
- Figure 35: Europe Agricultural Surfactant Market Revenue Share (%), by Price Trend Analysis 2025 & 2033
- Figure 36: Europe Agricultural Surfactant Market Revenue (Million), by Country 2025 & 2033
- Figure 37: Europe Agricultural Surfactant Market Revenue Share (%), by Country 2025 & 2033
- Figure 38: Middle East & Africa Agricultural Surfactant Market Revenue (Million), by Production Analysis 2025 & 2033
- Figure 39: Middle East & Africa Agricultural Surfactant Market Revenue Share (%), by Production Analysis 2025 & 2033
- Figure 40: Middle East & Africa Agricultural Surfactant Market Revenue (Million), by Consumption Analysis 2025 & 2033
- Figure 41: Middle East & Africa Agricultural Surfactant Market Revenue Share (%), by Consumption Analysis 2025 & 2033
- Figure 42: Middle East & Africa Agricultural Surfactant Market Revenue (Million), by Import Market Analysis (Value & Volume) 2025 & 2033
- Figure 43: Middle East & Africa Agricultural Surfactant Market Revenue Share (%), by Import Market Analysis (Value & Volume) 2025 & 2033
- Figure 44: Middle East & Africa Agricultural Surfactant Market Revenue (Million), by Export Market Analysis (Value & Volume) 2025 & 2033
- Figure 45: Middle East & Africa Agricultural Surfactant Market Revenue Share (%), by Export Market Analysis (Value & Volume) 2025 & 2033
- Figure 46: Middle East & Africa Agricultural Surfactant Market Revenue (Million), by Price Trend Analysis 2025 & 2033
- Figure 47: Middle East & Africa Agricultural Surfactant Market Revenue Share (%), by Price Trend Analysis 2025 & 2033
- Figure 48: Middle East & Africa Agricultural Surfactant Market Revenue (Million), by Country 2025 & 2033
- Figure 49: Middle East & Africa Agricultural Surfactant Market Revenue Share (%), by Country 2025 & 2033
- Figure 50: Asia Pacific Agricultural Surfactant Market Revenue (Million), by Production Analysis 2025 & 2033
- Figure 51: Asia Pacific Agricultural Surfactant Market Revenue Share (%), by Production Analysis 2025 & 2033
- Figure 52: Asia Pacific Agricultural Surfactant Market Revenue (Million), by Consumption Analysis 2025 & 2033
- Figure 53: Asia Pacific Agricultural Surfactant Market Revenue Share (%), by Consumption Analysis 2025 & 2033
- Figure 54: Asia Pacific Agricultural Surfactant Market Revenue (Million), by Import Market Analysis (Value & Volume) 2025 & 2033
- Figure 55: Asia Pacific Agricultural Surfactant Market Revenue Share (%), by Import Market Analysis (Value & Volume) 2025 & 2033
- Figure 56: Asia Pacific Agricultural Surfactant Market Revenue (Million), by Export Market Analysis (Value & Volume) 2025 & 2033
- Figure 57: Asia Pacific Agricultural Surfactant Market Revenue Share (%), by Export Market Analysis (Value & Volume) 2025 & 2033
- Figure 58: Asia Pacific Agricultural Surfactant Market Revenue (Million), by Price Trend Analysis 2025 & 2033
- Figure 59: Asia Pacific Agricultural Surfactant Market Revenue Share (%), by Price Trend Analysis 2025 & 2033
- Figure 60: Asia Pacific Agricultural Surfactant Market Revenue (Million), by Country 2025 & 2033
- Figure 61: Asia Pacific Agricultural Surfactant Market Revenue Share (%), by Country 2025 & 2033
List of Tables
- Table 1: Global Agricultural Surfactant Market Revenue Million Forecast, by Production Analysis 2020 & 2033
- Table 2: Global Agricultural Surfactant Market Revenue Million Forecast, by Consumption Analysis 2020 & 2033
- Table 3: Global Agricultural Surfactant Market Revenue Million Forecast, by Import Market Analysis (Value & Volume) 2020 & 2033
- Table 4: Global Agricultural Surfactant Market Revenue Million Forecast, by Export Market Analysis (Value & Volume) 2020 & 2033
- Table 5: Global Agricultural Surfactant Market Revenue Million Forecast, by Price Trend Analysis 2020 & 2033
- Table 6: Global Agricultural Surfactant Market Revenue Million Forecast, by Region 2020 & 2033
- Table 7: Global Agricultural Surfactant Market Revenue Million Forecast, by Production Analysis 2020 & 2033
- Table 8: Global Agricultural Surfactant Market Revenue Million Forecast, by Consumption Analysis 2020 & 2033
- Table 9: Global Agricultural Surfactant Market Revenue Million Forecast, by Import Market Analysis (Value & Volume) 2020 & 2033
- Table 10: Global Agricultural Surfactant Market Revenue Million Forecast, by Export Market Analysis (Value & Volume) 2020 & 2033
- Table 11: Global Agricultural Surfactant Market Revenue Million Forecast, by Price Trend Analysis 2020 & 2033
- Table 12: Global Agricultural Surfactant Market Revenue Million Forecast, by Country 2020 & 2033
- Table 13: United States Agricultural Surfactant Market Revenue (Million) Forecast, by Application 2020 & 2033
- Table 14: Canada Agricultural Surfactant Market Revenue (Million) Forecast, by Application 2020 & 2033
- Table 15: Mexico Agricultural Surfactant Market Revenue (Million) Forecast, by Application 2020 & 2033
- Table 16: Global Agricultural Surfactant Market Revenue Million Forecast, by Production Analysis 2020 & 2033
- Table 17: Global Agricultural Surfactant Market Revenue Million Forecast, by Consumption Analysis 2020 & 2033
- Table 18: Global Agricultural Surfactant Market Revenue Million Forecast, by Import Market Analysis (Value & Volume) 2020 & 2033
- Table 19: Global Agricultural Surfactant Market Revenue Million Forecast, by Export Market Analysis (Value & Volume) 2020 & 2033
- Table 20: Global Agricultural Surfactant Market Revenue Million Forecast, by Price Trend Analysis 2020 & 2033
- Table 21: Global Agricultural Surfactant Market Revenue Million Forecast, by Country 2020 & 2033
- Table 22: Brazil Agricultural Surfactant Market Revenue (Million) Forecast, by Application 2020 & 2033
- Table 23: Argentina Agricultural Surfactant Market Revenue (Million) Forecast, by Application 2020 & 2033
- Table 24: Rest of South America Agricultural Surfactant Market Revenue (Million) Forecast, by Application 2020 & 2033
- Table 25: Global Agricultural Surfactant Market Revenue Million Forecast, by Production Analysis 2020 & 2033
- Table 26: Global Agricultural Surfactant Market Revenue Million Forecast, by Consumption Analysis 2020 & 2033
- Table 27: Global Agricultural Surfactant Market Revenue Million Forecast, by Import Market Analysis (Value & Volume) 2020 & 2033
- Table 28: Global Agricultural Surfactant Market Revenue Million Forecast, by Export Market Analysis (Value & Volume) 2020 & 2033
- Table 29: Global Agricultural Surfactant Market Revenue Million Forecast, by Price Trend Analysis 2020 & 2033
- Table 30: Global Agricultural Surfactant Market Revenue Million Forecast, by Country 2020 & 2033
- Table 31: United Kingdom Agricultural Surfactant Market Revenue (Million) Forecast, by Application 2020 & 2033
- Table 32: Germany Agricultural Surfactant Market Revenue (Million) Forecast, by Application 2020 & 2033
- Table 33: France Agricultural Surfactant Market Revenue (Million) Forecast, by Application 2020 & 2033
- Table 34: Italy Agricultural Surfactant Market Revenue (Million) Forecast, by Application 2020 & 2033
- Table 35: Spain Agricultural Surfactant Market Revenue (Million) Forecast, by Application 2020 & 2033
- Table 36: Russia Agricultural Surfactant Market Revenue (Million) Forecast, by Application 2020 & 2033
- Table 37: Benelux Agricultural Surfactant Market Revenue (Million) Forecast, by Application 2020 & 2033
- Table 38: Nordics Agricultural Surfactant Market Revenue (Million) Forecast, by Application 2020 & 2033
- Table 39: Rest of Europe Agricultural Surfactant Market Revenue (Million) Forecast, by Application 2020 & 2033
- Table 40: Global Agricultural Surfactant Market Revenue Million Forecast, by Production Analysis 2020 & 2033
- Table 41: Global Agricultural Surfactant Market Revenue Million Forecast, by Consumption Analysis 2020 & 2033
- Table 42: Global Agricultural Surfactant Market Revenue Million Forecast, by Import Market Analysis (Value & Volume) 2020 & 2033
- Table 43: Global Agricultural Surfactant Market Revenue Million Forecast, by Export Market Analysis (Value & Volume) 2020 & 2033
- Table 44: Global Agricultural Surfactant Market Revenue Million Forecast, by Price Trend Analysis 2020 & 2033
- Table 45: Global Agricultural Surfactant Market Revenue Million Forecast, by Country 2020 & 2033
- Table 46: Turkey Agricultural Surfactant Market Revenue (Million) Forecast, by Application 2020 & 2033
- Table 47: Israel Agricultural Surfactant Market Revenue (Million) Forecast, by Application 2020 & 2033
- Table 48: GCC Agricultural Surfactant Market Revenue (Million) Forecast, by Application 2020 & 2033
- Table 49: North Africa Agricultural Surfactant Market Revenue (Million) Forecast, by Application 2020 & 2033
- Table 50: South Africa Agricultural Surfactant Market Revenue (Million) Forecast, by Application 2020 & 2033
- Table 51: Rest of Middle East & Africa Agricultural Surfactant Market Revenue (Million) Forecast, by Application 2020 & 2033
- Table 52: Global Agricultural Surfactant Market Revenue Million Forecast, by Production Analysis 2020 & 2033
- Table 53: Global Agricultural Surfactant Market Revenue Million Forecast, by Consumption Analysis 2020 & 2033
- Table 54: Global Agricultural Surfactant Market Revenue Million Forecast, by Import Market Analysis (Value & Volume) 2020 & 2033
- Table 55: Global Agricultural Surfactant Market Revenue Million Forecast, by Export Market Analysis (Value & Volume) 2020 & 2033
- Table 56: Global Agricultural Surfactant Market Revenue Million Forecast, by Price Trend Analysis 2020 & 2033
- Table 57: Global Agricultural Surfactant Market Revenue Million Forecast, by Country 2020 & 2033
- Table 58: China Agricultural Surfactant Market Revenue (Million) Forecast, by Application 2020 & 2033
- Table 59: India Agricultural Surfactant Market Revenue (Million) Forecast, by Application 2020 & 2033
- Table 60: Japan Agricultural Surfactant Market Revenue (Million) Forecast, by Application 2020 & 2033
- Table 61: South Korea Agricultural Surfactant Market Revenue (Million) Forecast, by Application 2020 & 2033
- Table 62: ASEAN Agricultural Surfactant Market Revenue (Million) Forecast, by Application 2020 & 2033
- Table 63: Oceania Agricultural Surfactant Market Revenue (Million) Forecast, by Application 2020 & 2033
- Table 64: Rest of Asia Pacific Agricultural Surfactant Market Revenue (Million) Forecast, by Application 2020 & 2033
Frequently Asked Questions
1. What is the projected Compound Annual Growth Rate (CAGR) of the Agricultural Surfactant Market?
The projected CAGR is approximately 6.70%.
2. Which companies are prominent players in the Agricultural Surfactant Market?
Key companies in the market include Tanatex Chemicals BV, Clariant, Solvay SA, Akzonobel, Interagro (Uk) Ltd, Brandt Consolidated Inc, Garrco Products Inc, Lamberti SPA, Kao Corporation, Helena Chemical Company, Air Products and Chemicals, Nufarm Limited, Wilbur-Ellis Company, Huntsman, Corteva Agriscience, Croda International PLC, Evonik Industries, BASF SE.
3. What are the main segments of the Agricultural Surfactant Market?
The market segments include Production Analysis, Consumption Analysis, Import Market Analysis (Value & Volume), Export Market Analysis (Value & Volume), Price Trend Analysis.
4. Can you provide details about the market size?
The market size is estimated to be USD 2.04 Million as of 2022.
5. What are some drivers contributing to market growth?
Shortage of Skilled Labor; Government Support to Enhance Farm Mechanization.
6. What are the notable trends driving market growth?
Rising Demand for Food and Shrinking Land Driving the Market.
7. Are there any restraints impacting market growth?
Heavy Initial Procurement Cost and High Expenditure on Maintenance.
8. Can you provide examples of recent developments in the market?
March 2022 - Dow announced a new product extension of VORASURF™ Silicone Surfactants to support the growing demand for enhanced energy efficiency and sustainable solutions in the rigid polyurethane foam market, with a specific focus on spray and construction applications.
9. What pricing options are available for accessing the report?
Pricing options include single-user, multi-user, and enterprise licenses priced at USD 4750, USD 5250, and USD 8750 respectively.
10. Is the market size provided in terms of value or volume?
The market size is provided in terms of value, measured in Million.
11. Are there any specific market keywords associated with the report?
Yes, the market keyword associated with the report is "Agricultural Surfactant Market," which aids in identifying and referencing the specific market segment covered.
12. How do I determine which pricing option suits my needs best?
The pricing options vary based on user requirements and access needs. Individual users may opt for single-user licenses, while businesses requiring broader access may choose multi-user or enterprise licenses for cost-effective access to the report.
13. Are there any additional resources or data provided in the Agricultural Surfactant Market report?
While the report offers comprehensive insights, it's advisable to review the specific contents or supplementary materials provided to ascertain if additional resources or data are available.
14. How can I stay updated on further developments or reports in the Agricultural Surfactant Market?
To stay informed about further developments, trends, and reports in the Agricultural Surfactant Market, consider subscribing to industry newsletters, following relevant companies and organizations, or regularly checking reputable industry news sources and publications.
Methodology
Step 1 - Identification of Relevant Samples Size from Population Database


Step 2 - Approaches for Defining Global Market Size (Value, Volume* & Price*)

Note*: In applicable scenarios
Step 3 - Data Sources
Primary Research
- Web Analytics
- Survey Reports
- Research Institute
- Latest Research Reports
- Opinion Leaders
Secondary Research
- Annual Reports
- White Paper
- Latest Press Release
- Industry Association
- Paid Database
- Investor Presentations

Step 4 - Data Triangulation
Involves using different sources of information in order to increase the validity of a study
These sources are likely to be stakeholders in a program - participants, other researchers, program staff, other community members, and so on.
Then we put all data in single framework & apply various statistical tools to find out the dynamic on the market.
During the analysis stage, feedback from the stakeholder groups would be compared to determine areas of agreement as well as areas of divergence

