

Key Insights
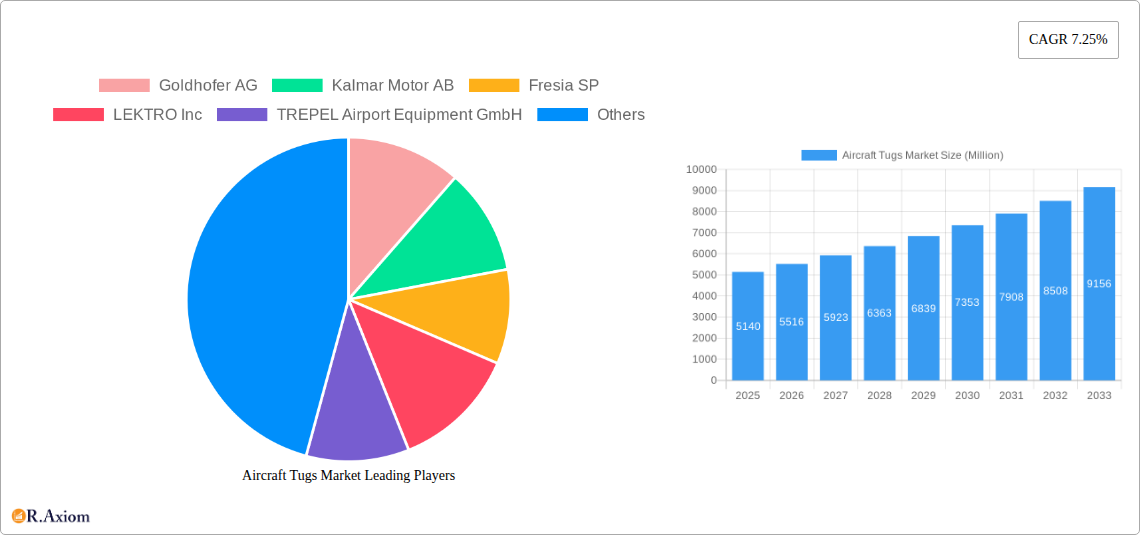
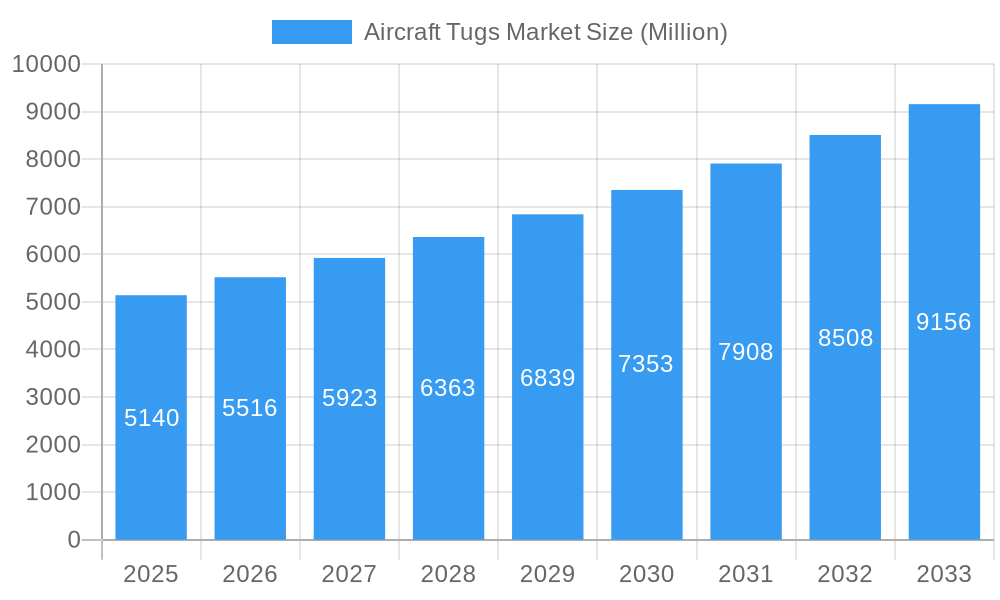
The global aircraft tugs market, valued at $5.14 billion in 2025, is projected to experience robust growth, driven by a Compound Annual Growth Rate (CAGR) of 7.25% from 2025 to 2033. This expansion is fueled by several key factors. The increasing air passenger traffic globally necessitates efficient ground handling solutions, boosting demand for aircraft tugs. Furthermore, the aviation industry's focus on optimizing operational efficiency and reducing turnaround times is driving adoption of advanced, high-performance tugs. Technological advancements, such as the introduction of electric and towbarless tugs, are contributing to improved fuel efficiency, reduced emissions, and enhanced safety, further stimulating market growth. The rising preference for electric aircraft tugs, particularly at major airports striving for sustainability goals, is a significant trend shaping the market. However, the high initial investment cost associated with these advanced tugs and potential regulatory hurdles related to their integration could act as restraining factors to some extent. Segment-wise, the diesel-powered conventional tugs currently dominate the market, although the electric segment is rapidly gaining traction. Geographically, North America and Europe are presently the largest markets, owing to well-established aviation infrastructure and strong air traffic. However, rapid growth in air travel within the Asia-Pacific region is expected to drive significant market expansion in this area in the coming years.
Aircraft Tugs Market Market Size (In Billion)
The competitive landscape is marked by the presence of both established players and new entrants, reflecting the market's dynamism. Key players are focusing on strategic collaborations, product innovation, and geographic expansion to maintain a strong market position. Future growth will be influenced by factors such as technological advancements in tug design, the implementation of stricter emission regulations, and the overall growth trajectory of the global aviation industry. The increasing focus on sustainability and the growing adoption of electric and hybrid technologies will likely reshape the market dynamics in the long term, favoring companies that effectively integrate these innovations into their product offerings. The market is expected to witness significant consolidation as larger players acquire smaller companies to leverage their technology and market reach.
Aircraft Tugs Market Company Market Share
This comprehensive report provides an in-depth analysis of the Aircraft Tugs Market, covering historical data (2019-2024), the base year (2025), and a detailed forecast (2025-2033). It offers actionable insights for industry stakeholders, investors, and businesses looking to navigate this dynamic market. The report meticulously examines market segmentation by type (Conventional, Towbarless), power source (Diesel, Gas, Electric), and key geographical regions, providing granular data and insightful analysis. The study period is 2019-2033, with 2025 as the base and estimated year.
Aircraft Tugs Market Concentration & Innovation
The Aircraft Tugs Market exhibits a moderately concentrated landscape, with a few key players holding significant market share. Goldhofer AG, Kalmar Motor AB, and Textron Inc (Ground Support Equipment Inc) are among the leading companies, collectively accounting for an estimated xx% of the global market in 2025. Market concentration is influenced by factors such as economies of scale, technological advancements, and brand recognition.
Innovation is a critical driver, with ongoing efforts focused on enhancing efficiency, reducing emissions, and improving safety. The shift towards electric and hybrid power sources is a prominent trend, driven by stringent environmental regulations and growing sustainability concerns within the aviation industry. Regulatory frameworks, particularly concerning emissions and safety standards, play a crucial role in shaping market dynamics. The emergence of advanced features such as automated steering and remote control systems further fuels innovation. Product substitutes, while limited, include specialized ground handling vehicles with overlapping functionalities. End-user trends point towards a preference for efficient, eco-friendly, and technologically advanced tugs. Mergers and acquisitions (M&A) activity has been moderate, with deal values averaging approximately xx Million in recent years, indicating strategic consolidation within the market.
Aircraft Tugs Market Industry Trends & Insights
The global Aircraft Tugs Market is projected to experience a robust Compound Annual Growth Rate (CAGR) of approximately 6.5% - 7.5% during the forecast period (2025-2033). This significant growth is primarily fueled by the escalating volume of global air passenger traffic and freight movement, directly translating to a heightened demand for efficient and sophisticated ground handling equipment.
The landscape of the aircraft tugs market is undergoing a significant transformation driven by rapid technological advancements. The emergence of highly efficient electric tugs and increasingly sophisticated autonomous tug solutions is actively disrupting traditional market dynamics. Consumer preferences are visibly shifting towards environmentally conscious operations and technologically superior solutions, exerting considerable pressure on manufacturers to accelerate their innovation cycles.
The competitive environment is characterized by intense rivalry among well-established industry veterans and the dynamic entry of new players, who are consistently introducing innovative products and service models. The market penetration of electric tugs, while currently at a nascent stage (estimated at around 10% - 15% in 2025), is poised for substantial expansion in the coming years. This growth is further propelled by supportive government incentives aimed at promoting sustainability and increasing global awareness of environmental concerns.
Dominant Markets & Segments in Aircraft Tugs Market
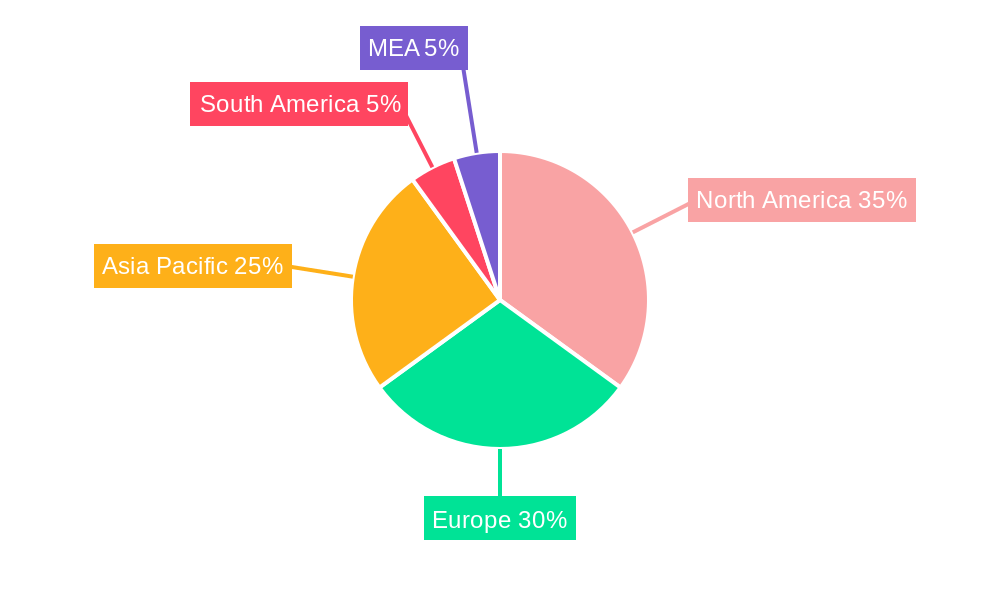
Currently, the North American region commands the largest market share in aircraft tugs. This dominance is attributable to its well-developed aviation infrastructure, consistently high aircraft traffic volumes, and substantial investments in airport modernization initiatives.
However, the Asia-Pacific region is strategically positioned for substantial growth in the upcoming years. This surge is expected to be driven by rapid economic expansion, increasing disposable incomes, and significant government-led investments in expanding and upgrading airport infrastructure to accommodate rising air travel demand.
- Key Drivers for North America: A mature and extensive aviation ecosystem, consistently high aircraft movements, stringent safety and emission regulations fostering advanced equipment adoption, and continuous airport infrastructure upgrades.
- Key Drivers for Asia-Pacific: Explosive growth in air passenger and cargo traffic, ambitious airport expansion and new airport development projects, proactive government support for aviation infrastructure enhancement, and a burgeoning focus on adopting eco-friendly and sustainable ground handling solutions.
Segment Analysis:
- Type: The conventional towbar tug segment presently holds a dominant position due to its long-standing technological maturity and comparatively lower initial acquisition cost. Nevertheless, the towbarless tug segment is rapidly gaining prominence, driven by its superior safety features, enhanced operational efficiency, and reduced risk of aircraft damage. Its market share is anticipated to accelerate significantly over the forecast period.
- Power: Diesel-powered tugs continue to capture a substantial market share, owing to their proven reliability, robust power output, and widespread availability. However, the electric and gas-powered segments are projected to witness notable and accelerating growth. This trend is primarily fueled by increasingly stringent emission norms globally and a strategic focus on long-term operational cost optimization.
Aircraft Tugs Market Product Developments
Recent product innovations focus on enhancing fuel efficiency, reducing emissions, and improving safety features. Electric and hybrid-electric tugs are gaining prominence, offering significant environmental benefits and reduced operational costs. Advanced features like automated steering systems and remote control capabilities are also being incorporated to optimize efficiency and safety. These advancements cater to the increasing demand for sustainable and technologically advanced solutions within the aviation industry. The market fit of these new products is strong due to rising environmental concerns and the need for efficient ground handling operations.
Report Scope & Segmentation Analysis
This comprehensive report meticulously segments the Aircraft Tugs Market based on the following key parameters:
-
Type:
- Conventional Tugs: Expected to witness a CAGR of approximately 5.0% - 6.0%, driven by its established market presence and cost-effectiveness for certain operations.
- Towbarless Tugs: Anticipated to grow at a more accelerated rate of approximately 8.0% - 9.0%, propelled by increasing demands for enhanced safety, improved operational efficiency, and reduced turnaround times. Competitive dynamics are intensely fought in both segments.
-
Power:
- Diesel: While currently dominating due to cost-effectiveness and established reliability, this segment is projected to show a slower CAGR of approximately 4.0% - 5.0%.
- Gas: Expected to exhibit a healthy growth rate of approximately 6.0% - 7.0%, offering a balance between power and emissions.
- Electric: Poised for the highest growth rates, estimated at approximately 10.0% - 12.0%, driven by aggressive sustainability initiatives, government mandates, declining battery costs, and substantial technological advancements. Competition is particularly fierce and dynamic within the electric tug segment, with new, innovative entrants continually emerging.
Key Drivers of Aircraft Tugs Market Growth
The growth of the Aircraft Tugs Market is primarily fueled by the surge in global air passenger traffic, necessitating efficient ground handling solutions. Technological advancements such as the development of electric and autonomous tugs significantly enhance efficiency and reduce environmental impact. Stringent environmental regulations, such as emissions standards, are driving the adoption of cleaner and more sustainable technologies. Growing investments in airport infrastructure and modernization projects across various regions create significant opportunities for market expansion.
Challenges in the Aircraft Tugs Market Sector
The Aircraft Tugs Market is navigating a complex landscape of challenges that impact its growth trajectory and operational dynamics.
- Stringent Regulatory Compliance: Adhering to evolving and often rigorous safety, emission, and operational regulations can significantly increase manufacturing costs and extend production lead times, posing a hurdle for faster market penetration.
- Supply Chain Volatility: Global supply chain disruptions and unpredictable fluctuations in the prices of essential raw materials can directly impact production costs, affecting profit margins and the overall financial viability of manufacturing operations.
- Intense Competition and Pricing Pressure: The crowded market, characterized by the presence of established global players and agile new entrants, leads to fierce competition. This dynamic often exerts significant pressure on pricing strategies and overall profit margins.
- High Initial Investment for Electric Tugs: The upfront capital expenditure required for advanced electric tugs can be a barrier to widespread adoption, particularly for smaller operators. However, this initial cost is increasingly offset by substantial long-term savings in fuel consumption, reduced maintenance requirements, and lower operational expenses.
Emerging Opportunities in Aircraft Tugs Market
The increasing demand for sustainable aviation fuels (SAFs) and electric-powered aircraft offers significant opportunities for manufacturers to develop compatible tugs. The expansion of low-cost carrier (LCC) operations globally presents significant opportunities for growth, as LCCs are price sensitive but still require efficient ground handling equipment. The development of autonomous and remotely operated tugs offers increased safety and efficiency, creating new avenues for growth. Expanding into emerging markets with growing air travel sectors presents immense potential for market penetration.
Leading Players in the Aircraft Tugs Market Market
- Goldhofer AG
- Kalmar Motor AB
- Fresia SP
- LEKTRO Inc
- TREPEL Airport Equipment GmbH
- Tronair Inc
- John Bean Technologies Corp
- Tinka Resources Limited
- Textron Inc (Ground Support Equipment Inc)
- Airtug LLC
- MULAG
- MOTOTOK
Key Developments in Aircraft Tugs Market Industry
June 2023: Lokpriyo Gopinath Bordoloi International Airport launched its first electric vehicle tug, signifying a growing adoption of sustainable ground handling technologies.
April 2023: Air India's announcement of pilot-controlled tow tractors for Airbus A320 maneuvering at Delhi and Bengaluru airports highlights a trend toward enhanced safety and efficiency in ground operations. This also indicates a focus on emissions reduction.
Strategic Outlook for Aircraft Tugs Market Market
The Aircraft Tugs Market is poised for sustained growth, driven by factors such as increasing air passenger traffic, technological advancements, and a growing focus on sustainability. The adoption of electric and autonomous tugs is expected to accelerate, creating significant opportunities for market players. Expanding into emerging markets and focusing on innovative product development will be crucial for securing a competitive advantage in the years to come. The market's future growth depends significantly on the continued expansion of the aviation industry and the successful integration of sustainable and efficient ground handling solutions.
Aircraft Tugs Market Segmentation
- 1. Production Analysis
- 2. Consumption Analysis
- 3. Import Market Analysis (Value & Volume)
- 4. Export Market Analysis (Value & Volume)
- 5. Price Trend Analysis
Aircraft Tugs Market Segmentation By Geography
-
1. North America
- 1.1. United States
- 1.2. Canada
- 1.3. Mexico
-
2. South America
- 2.1. Brazil
- 2.2. Argentina
- 2.3. Rest of South America
-
3. Europe
- 3.1. United Kingdom
- 3.2. Germany
- 3.3. France
- 3.4. Italy
- 3.5. Spain
- 3.6. Russia
- 3.7. Benelux
- 3.8. Nordics
- 3.9. Rest of Europe
-
4. Middle East & Africa
- 4.1. Turkey
- 4.2. Israel
- 4.3. GCC
- 4.4. North Africa
- 4.5. South Africa
- 4.6. Rest of Middle East & Africa
-
5. Asia Pacific
- 5.1. China
- 5.2. India
- 5.3. Japan
- 5.4. South Korea
- 5.5. ASEAN
- 5.6. Oceania
- 5.7. Rest of Asia Pacific
Aircraft Tugs Market Regional Market Share
Geographic Coverage of Aircraft Tugs Market
Aircraft Tugs Market REPORT HIGHLIGHTS
| Aspects | Details |
|---|---|
| Study Period | 2020-2034 |
| Base Year | 2025 |
| Estimated Year | 2026 |
| Forecast Period | 2026-2034 |
| Historical Period | 2020-2025 |
| Growth Rate | CAGR of 7.25% from 2020-2034 |
| Segmentation |
|
Table of Contents
- 1. Introduction
- 1.1. Research Scope
- 1.2. Market Segmentation
- 1.3. Research Objective
- 1.4. Definitions and Assumptions
- 2. Executive Summary
- 2.1. Market Snapshot
- 3. Market Dynamics
- 3.1. Market Drivers
- 3.2. Market Restrains
- 3.3. Market Trends
- 3.4. Market Opportunities
- 4. Market Factor Analysis
- 4.1. Porters Five Forces
- 4.1.1. Bargaining Power of Suppliers
- 4.1.2. Bargaining Power of Buyers
- 4.1.3. Threat of New Entrants
- 4.1.4. Threat of Substitutes
- 4.1.5. Competitive Rivalry
- 4.2. PESTEL analysis
- 4.3. BCG Analysis
- 4.3.1. Stars (High Growth, High Market Share)
- 4.3.2. Cash Cows (Low Growth, High Market Share)
- 4.3.3. Question Mark (High Growth, Low Market Share)
- 4.3.4. Dogs (Low Growth, Low Market Share)
- 4.4. Ansoff Matrix Analysis
- 4.5. Supply Chain Analysis
- 4.6. Regulatory Landscape
- 4.7. Current Market Potential and Opportunity Assessment (TAM–SAM–SOM Framework)
- 4.8. RAX Analyst Note
- 4.1. Porters Five Forces
- 5. Market Analysis, Insights and Forecast 2021-2033
- 5.1. Market Analysis, Insights and Forecast - by Production Analysis
- 5.2. Market Analysis, Insights and Forecast - by Consumption Analysis
- 5.3. Market Analysis, Insights and Forecast - by Import Market Analysis (Value & Volume)
- 5.4. Market Analysis, Insights and Forecast - by Export Market Analysis (Value & Volume)
- 5.5. Market Analysis, Insights and Forecast - by Price Trend Analysis
- 5.6. Market Analysis, Insights and Forecast - by Region
- 5.6.1. North America
- 5.6.2. South America
- 5.6.3. Europe
- 5.6.4. Middle East & Africa
- 5.6.5. Asia Pacific
- 6. Global Aircraft Tugs Market Analysis, Insights and Forecast, 2021-2033
- 6.1. Market Analysis, Insights and Forecast - by Production Analysis
- 6.2. Market Analysis, Insights and Forecast - by Consumption Analysis
- 6.3. Market Analysis, Insights and Forecast - by Import Market Analysis (Value & Volume)
- 6.4. Market Analysis, Insights and Forecast - by Export Market Analysis (Value & Volume)
- 6.5. Market Analysis, Insights and Forecast - by Price Trend Analysis
- 7. North America Aircraft Tugs Market Analysis, Insights and Forecast, 2020-2032
- 7.1. Market Analysis, Insights and Forecast - by Production Analysis
- 7.2. Market Analysis, Insights and Forecast - by Consumption Analysis
- 7.3. Market Analysis, Insights and Forecast - by Import Market Analysis (Value & Volume)
- 7.4. Market Analysis, Insights and Forecast - by Export Market Analysis (Value & Volume)
- 7.5. Market Analysis, Insights and Forecast - by Price Trend Analysis
- 8. South America Aircraft Tugs Market Analysis, Insights and Forecast, 2020-2032
- 8.1. Market Analysis, Insights and Forecast - by Production Analysis
- 8.2. Market Analysis, Insights and Forecast - by Consumption Analysis
- 8.3. Market Analysis, Insights and Forecast - by Import Market Analysis (Value & Volume)
- 8.4. Market Analysis, Insights and Forecast - by Export Market Analysis (Value & Volume)
- 8.5. Market Analysis, Insights and Forecast - by Price Trend Analysis
- 9. Europe Aircraft Tugs Market Analysis, Insights and Forecast, 2020-2032
- 9.1. Market Analysis, Insights and Forecast - by Production Analysis
- 9.2. Market Analysis, Insights and Forecast - by Consumption Analysis
- 9.3. Market Analysis, Insights and Forecast - by Import Market Analysis (Value & Volume)
- 9.4. Market Analysis, Insights and Forecast - by Export Market Analysis (Value & Volume)
- 9.5. Market Analysis, Insights and Forecast - by Price Trend Analysis
- 10. Middle East & Africa Aircraft Tugs Market Analysis, Insights and Forecast, 2020-2032
- 10.1. Market Analysis, Insights and Forecast - by Production Analysis
- 10.2. Market Analysis, Insights and Forecast - by Consumption Analysis
- 10.3. Market Analysis, Insights and Forecast - by Import Market Analysis (Value & Volume)
- 10.4. Market Analysis, Insights and Forecast - by Export Market Analysis (Value & Volume)
- 10.5. Market Analysis, Insights and Forecast - by Price Trend Analysis
- 11. Asia Pacific Aircraft Tugs Market Analysis, Insights and Forecast, 2020-2032
- 11.1. Market Analysis, Insights and Forecast - by Production Analysis
- 11.2. Market Analysis, Insights and Forecast - by Consumption Analysis
- 11.3. Market Analysis, Insights and Forecast - by Import Market Analysis (Value & Volume)
- 11.4. Market Analysis, Insights and Forecast - by Export Market Analysis (Value & Volume)
- 11.5. Market Analysis, Insights and Forecast - by Price Trend Analysis
- 12. Competitive Analysis
- 12.1. Company Profiles
- 12.1.1 Goldhofer AG
- 12.1.1.1. Company Overview
- 12.1.1.2. Products
- 12.1.1.3. Company Financials
- 12.1.1.4. SWOT Analysis
- 12.1.2 Kalmar Motor AB
- 12.1.2.1. Company Overview
- 12.1.2.2. Products
- 12.1.2.3. Company Financials
- 12.1.2.4. SWOT Analysis
- 12.1.3 Fresia SP
- 12.1.3.1. Company Overview
- 12.1.3.2. Products
- 12.1.3.3. Company Financials
- 12.1.3.4. SWOT Analysis
- 12.1.4 LEKTRO Inc
- 12.1.4.1. Company Overview
- 12.1.4.2. Products
- 12.1.4.3. Company Financials
- 12.1.4.4. SWOT Analysis
- 12.1.5 TREPEL Airport Equipment GmbH
- 12.1.5.1. Company Overview
- 12.1.5.2. Products
- 12.1.5.3. Company Financials
- 12.1.5.4. SWOT Analysis
- 12.1.6 Tronair Inc
- 12.1.6.1. Company Overview
- 12.1.6.2. Products
- 12.1.6.3. Company Financials
- 12.1.6.4. SWOT Analysis
- 12.1.7 John Bean Technologies Corp
- 12.1.7.1. Company Overview
- 12.1.7.2. Products
- 12.1.7.3. Company Financials
- 12.1.7.4. SWOT Analysis
- 12.1.8 Tinka Resources Limited
- 12.1.8.1. Company Overview
- 12.1.8.2. Products
- 12.1.8.3. Company Financials
- 12.1.8.4. SWOT Analysis
- 12.1.9 Textron Inc (Ground Support Equipment Inc )
- 12.1.9.1. Company Overview
- 12.1.9.2. Products
- 12.1.9.3. Company Financials
- 12.1.9.4. SWOT Analysis
- 12.1.10 Airtug LLC
- 12.1.10.1. Company Overview
- 12.1.10.2. Products
- 12.1.10.3. Company Financials
- 12.1.10.4. SWOT Analysis
- 12.1.11 MULAG
- 12.1.11.1. Company Overview
- 12.1.11.2. Products
- 12.1.11.3. Company Financials
- 12.1.11.4. SWOT Analysis
- 12.1.12 MOTOTOK
- 12.1.12.1. Company Overview
- 12.1.12.2. Products
- 12.1.12.3. Company Financials
- 12.1.12.4. SWOT Analysis
- 12.1.1 Goldhofer AG
- 12.2. Market Entropy
- 12.2.1 Company's Key Areas Served
- 12.2.2 Recent Developments
- 12.3. Company Market Share Analysis 2025
- 12.3.1 Top 5 Companies Market Share Analysis
- 12.3.2 Top 3 Companies Market Share Analysis
- 12.4. List of Potential Customers
- 13. Research Methodology
List of Figures
- Figure 1: Global Aircraft Tugs Market Revenue Breakdown (billion, %) by Region 2025 & 2033
- Figure 2: North America Aircraft Tugs Market Revenue (billion), by Production Analysis 2025 & 2033
- Figure 3: North America Aircraft Tugs Market Revenue Share (%), by Production Analysis 2025 & 2033
- Figure 4: North America Aircraft Tugs Market Revenue (billion), by Consumption Analysis 2025 & 2033
- Figure 5: North America Aircraft Tugs Market Revenue Share (%), by Consumption Analysis 2025 & 2033
- Figure 6: North America Aircraft Tugs Market Revenue (billion), by Import Market Analysis (Value & Volume) 2025 & 2033
- Figure 7: North America Aircraft Tugs Market Revenue Share (%), by Import Market Analysis (Value & Volume) 2025 & 2033
- Figure 8: North America Aircraft Tugs Market Revenue (billion), by Export Market Analysis (Value & Volume) 2025 & 2033
- Figure 9: North America Aircraft Tugs Market Revenue Share (%), by Export Market Analysis (Value & Volume) 2025 & 2033
- Figure 10: North America Aircraft Tugs Market Revenue (billion), by Price Trend Analysis 2025 & 2033
- Figure 11: North America Aircraft Tugs Market Revenue Share (%), by Price Trend Analysis 2025 & 2033
- Figure 12: North America Aircraft Tugs Market Revenue (billion), by Country 2025 & 2033
- Figure 13: North America Aircraft Tugs Market Revenue Share (%), by Country 2025 & 2033
- Figure 14: South America Aircraft Tugs Market Revenue (billion), by Production Analysis 2025 & 2033
- Figure 15: South America Aircraft Tugs Market Revenue Share (%), by Production Analysis 2025 & 2033
- Figure 16: South America Aircraft Tugs Market Revenue (billion), by Consumption Analysis 2025 & 2033
- Figure 17: South America Aircraft Tugs Market Revenue Share (%), by Consumption Analysis 2025 & 2033
- Figure 18: South America Aircraft Tugs Market Revenue (billion), by Import Market Analysis (Value & Volume) 2025 & 2033
- Figure 19: South America Aircraft Tugs Market Revenue Share (%), by Import Market Analysis (Value & Volume) 2025 & 2033
- Figure 20: South America Aircraft Tugs Market Revenue (billion), by Export Market Analysis (Value & Volume) 2025 & 2033
- Figure 21: South America Aircraft Tugs Market Revenue Share (%), by Export Market Analysis (Value & Volume) 2025 & 2033
- Figure 22: South America Aircraft Tugs Market Revenue (billion), by Price Trend Analysis 2025 & 2033
- Figure 23: South America Aircraft Tugs Market Revenue Share (%), by Price Trend Analysis 2025 & 2033
- Figure 24: South America Aircraft Tugs Market Revenue (billion), by Country 2025 & 2033
- Figure 25: South America Aircraft Tugs Market Revenue Share (%), by Country 2025 & 2033
- Figure 26: Europe Aircraft Tugs Market Revenue (billion), by Production Analysis 2025 & 2033
- Figure 27: Europe Aircraft Tugs Market Revenue Share (%), by Production Analysis 2025 & 2033
- Figure 28: Europe Aircraft Tugs Market Revenue (billion), by Consumption Analysis 2025 & 2033
- Figure 29: Europe Aircraft Tugs Market Revenue Share (%), by Consumption Analysis 2025 & 2033
- Figure 30: Europe Aircraft Tugs Market Revenue (billion), by Import Market Analysis (Value & Volume) 2025 & 2033
- Figure 31: Europe Aircraft Tugs Market Revenue Share (%), by Import Market Analysis (Value & Volume) 2025 & 2033
- Figure 32: Europe Aircraft Tugs Market Revenue (billion), by Export Market Analysis (Value & Volume) 2025 & 2033
- Figure 33: Europe Aircraft Tugs Market Revenue Share (%), by Export Market Analysis (Value & Volume) 2025 & 2033
- Figure 34: Europe Aircraft Tugs Market Revenue (billion), by Price Trend Analysis 2025 & 2033
- Figure 35: Europe Aircraft Tugs Market Revenue Share (%), by Price Trend Analysis 2025 & 2033
- Figure 36: Europe Aircraft Tugs Market Revenue (billion), by Country 2025 & 2033
- Figure 37: Europe Aircraft Tugs Market Revenue Share (%), by Country 2025 & 2033
- Figure 38: Middle East & Africa Aircraft Tugs Market Revenue (billion), by Production Analysis 2025 & 2033
- Figure 39: Middle East & Africa Aircraft Tugs Market Revenue Share (%), by Production Analysis 2025 & 2033
- Figure 40: Middle East & Africa Aircraft Tugs Market Revenue (billion), by Consumption Analysis 2025 & 2033
- Figure 41: Middle East & Africa Aircraft Tugs Market Revenue Share (%), by Consumption Analysis 2025 & 2033
- Figure 42: Middle East & Africa Aircraft Tugs Market Revenue (billion), by Import Market Analysis (Value & Volume) 2025 & 2033
- Figure 43: Middle East & Africa Aircraft Tugs Market Revenue Share (%), by Import Market Analysis (Value & Volume) 2025 & 2033
- Figure 44: Middle East & Africa Aircraft Tugs Market Revenue (billion), by Export Market Analysis (Value & Volume) 2025 & 2033
- Figure 45: Middle East & Africa Aircraft Tugs Market Revenue Share (%), by Export Market Analysis (Value & Volume) 2025 & 2033
- Figure 46: Middle East & Africa Aircraft Tugs Market Revenue (billion), by Price Trend Analysis 2025 & 2033
- Figure 47: Middle East & Africa Aircraft Tugs Market Revenue Share (%), by Price Trend Analysis 2025 & 2033
- Figure 48: Middle East & Africa Aircraft Tugs Market Revenue (billion), by Country 2025 & 2033
- Figure 49: Middle East & Africa Aircraft Tugs Market Revenue Share (%), by Country 2025 & 2033
- Figure 50: Asia Pacific Aircraft Tugs Market Revenue (billion), by Production Analysis 2025 & 2033
- Figure 51: Asia Pacific Aircraft Tugs Market Revenue Share (%), by Production Analysis 2025 & 2033
- Figure 52: Asia Pacific Aircraft Tugs Market Revenue (billion), by Consumption Analysis 2025 & 2033
- Figure 53: Asia Pacific Aircraft Tugs Market Revenue Share (%), by Consumption Analysis 2025 & 2033
- Figure 54: Asia Pacific Aircraft Tugs Market Revenue (billion), by Import Market Analysis (Value & Volume) 2025 & 2033
- Figure 55: Asia Pacific Aircraft Tugs Market Revenue Share (%), by Import Market Analysis (Value & Volume) 2025 & 2033
- Figure 56: Asia Pacific Aircraft Tugs Market Revenue (billion), by Export Market Analysis (Value & Volume) 2025 & 2033
- Figure 57: Asia Pacific Aircraft Tugs Market Revenue Share (%), by Export Market Analysis (Value & Volume) 2025 & 2033
- Figure 58: Asia Pacific Aircraft Tugs Market Revenue (billion), by Price Trend Analysis 2025 & 2033
- Figure 59: Asia Pacific Aircraft Tugs Market Revenue Share (%), by Price Trend Analysis 2025 & 2033
- Figure 60: Asia Pacific Aircraft Tugs Market Revenue (billion), by Country 2025 & 2033
- Figure 61: Asia Pacific Aircraft Tugs Market Revenue Share (%), by Country 2025 & 2033
List of Tables
- Table 1: Global Aircraft Tugs Market Revenue billion Forecast, by Production Analysis 2020 & 2033
- Table 2: Global Aircraft Tugs Market Revenue billion Forecast, by Consumption Analysis 2020 & 2033
- Table 3: Global Aircraft Tugs Market Revenue billion Forecast, by Import Market Analysis (Value & Volume) 2020 & 2033
- Table 4: Global Aircraft Tugs Market Revenue billion Forecast, by Export Market Analysis (Value & Volume) 2020 & 2033
- Table 5: Global Aircraft Tugs Market Revenue billion Forecast, by Price Trend Analysis 2020 & 2033
- Table 6: Global Aircraft Tugs Market Revenue billion Forecast, by Region 2020 & 2033
- Table 7: Global Aircraft Tugs Market Revenue billion Forecast, by Production Analysis 2020 & 2033
- Table 8: Global Aircraft Tugs Market Revenue billion Forecast, by Consumption Analysis 2020 & 2033
- Table 9: Global Aircraft Tugs Market Revenue billion Forecast, by Import Market Analysis (Value & Volume) 2020 & 2033
- Table 10: Global Aircraft Tugs Market Revenue billion Forecast, by Export Market Analysis (Value & Volume) 2020 & 2033
- Table 11: Global Aircraft Tugs Market Revenue billion Forecast, by Price Trend Analysis 2020 & 2033
- Table 12: Global Aircraft Tugs Market Revenue billion Forecast, by Country 2020 & 2033
- Table 13: United States Aircraft Tugs Market Revenue (billion) Forecast, by Application 2020 & 2033
- Table 14: Canada Aircraft Tugs Market Revenue (billion) Forecast, by Application 2020 & 2033
- Table 15: Mexico Aircraft Tugs Market Revenue (billion) Forecast, by Application 2020 & 2033
- Table 16: Global Aircraft Tugs Market Revenue billion Forecast, by Production Analysis 2020 & 2033
- Table 17: Global Aircraft Tugs Market Revenue billion Forecast, by Consumption Analysis 2020 & 2033
- Table 18: Global Aircraft Tugs Market Revenue billion Forecast, by Import Market Analysis (Value & Volume) 2020 & 2033
- Table 19: Global Aircraft Tugs Market Revenue billion Forecast, by Export Market Analysis (Value & Volume) 2020 & 2033
- Table 20: Global Aircraft Tugs Market Revenue billion Forecast, by Price Trend Analysis 2020 & 2033
- Table 21: Global Aircraft Tugs Market Revenue billion Forecast, by Country 2020 & 2033
- Table 22: Brazil Aircraft Tugs Market Revenue (billion) Forecast, by Application 2020 & 2033
- Table 23: Argentina Aircraft Tugs Market Revenue (billion) Forecast, by Application 2020 & 2033
- Table 24: Rest of South America Aircraft Tugs Market Revenue (billion) Forecast, by Application 2020 & 2033
- Table 25: Global Aircraft Tugs Market Revenue billion Forecast, by Production Analysis 2020 & 2033
- Table 26: Global Aircraft Tugs Market Revenue billion Forecast, by Consumption Analysis 2020 & 2033
- Table 27: Global Aircraft Tugs Market Revenue billion Forecast, by Import Market Analysis (Value & Volume) 2020 & 2033
- Table 28: Global Aircraft Tugs Market Revenue billion Forecast, by Export Market Analysis (Value & Volume) 2020 & 2033
- Table 29: Global Aircraft Tugs Market Revenue billion Forecast, by Price Trend Analysis 2020 & 2033
- Table 30: Global Aircraft Tugs Market Revenue billion Forecast, by Country 2020 & 2033
- Table 31: United Kingdom Aircraft Tugs Market Revenue (billion) Forecast, by Application 2020 & 2033
- Table 32: Germany Aircraft Tugs Market Revenue (billion) Forecast, by Application 2020 & 2033
- Table 33: France Aircraft Tugs Market Revenue (billion) Forecast, by Application 2020 & 2033
- Table 34: Italy Aircraft Tugs Market Revenue (billion) Forecast, by Application 2020 & 2033
- Table 35: Spain Aircraft Tugs Market Revenue (billion) Forecast, by Application 2020 & 2033
- Table 36: Russia Aircraft Tugs Market Revenue (billion) Forecast, by Application 2020 & 2033
- Table 37: Benelux Aircraft Tugs Market Revenue (billion) Forecast, by Application 2020 & 2033
- Table 38: Nordics Aircraft Tugs Market Revenue (billion) Forecast, by Application 2020 & 2033
- Table 39: Rest of Europe Aircraft Tugs Market Revenue (billion) Forecast, by Application 2020 & 2033
- Table 40: Global Aircraft Tugs Market Revenue billion Forecast, by Production Analysis 2020 & 2033
- Table 41: Global Aircraft Tugs Market Revenue billion Forecast, by Consumption Analysis 2020 & 2033
- Table 42: Global Aircraft Tugs Market Revenue billion Forecast, by Import Market Analysis (Value & Volume) 2020 & 2033
- Table 43: Global Aircraft Tugs Market Revenue billion Forecast, by Export Market Analysis (Value & Volume) 2020 & 2033
- Table 44: Global Aircraft Tugs Market Revenue billion Forecast, by Price Trend Analysis 2020 & 2033
- Table 45: Global Aircraft Tugs Market Revenue billion Forecast, by Country 2020 & 2033
- Table 46: Turkey Aircraft Tugs Market Revenue (billion) Forecast, by Application 2020 & 2033
- Table 47: Israel Aircraft Tugs Market Revenue (billion) Forecast, by Application 2020 & 2033
- Table 48: GCC Aircraft Tugs Market Revenue (billion) Forecast, by Application 2020 & 2033
- Table 49: North Africa Aircraft Tugs Market Revenue (billion) Forecast, by Application 2020 & 2033
- Table 50: South Africa Aircraft Tugs Market Revenue (billion) Forecast, by Application 2020 & 2033
- Table 51: Rest of Middle East & Africa Aircraft Tugs Market Revenue (billion) Forecast, by Application 2020 & 2033
- Table 52: Global Aircraft Tugs Market Revenue billion Forecast, by Production Analysis 2020 & 2033
- Table 53: Global Aircraft Tugs Market Revenue billion Forecast, by Consumption Analysis 2020 & 2033
- Table 54: Global Aircraft Tugs Market Revenue billion Forecast, by Import Market Analysis (Value & Volume) 2020 & 2033
- Table 55: Global Aircraft Tugs Market Revenue billion Forecast, by Export Market Analysis (Value & Volume) 2020 & 2033
- Table 56: Global Aircraft Tugs Market Revenue billion Forecast, by Price Trend Analysis 2020 & 2033
- Table 57: Global Aircraft Tugs Market Revenue billion Forecast, by Country 2020 & 2033
- Table 58: China Aircraft Tugs Market Revenue (billion) Forecast, by Application 2020 & 2033
- Table 59: India Aircraft Tugs Market Revenue (billion) Forecast, by Application 2020 & 2033
- Table 60: Japan Aircraft Tugs Market Revenue (billion) Forecast, by Application 2020 & 2033
- Table 61: South Korea Aircraft Tugs Market Revenue (billion) Forecast, by Application 2020 & 2033
- Table 62: ASEAN Aircraft Tugs Market Revenue (billion) Forecast, by Application 2020 & 2033
- Table 63: Oceania Aircraft Tugs Market Revenue (billion) Forecast, by Application 2020 & 2033
- Table 64: Rest of Asia Pacific Aircraft Tugs Market Revenue (billion) Forecast, by Application 2020 & 2033
Frequently Asked Questions
1. What is the projected Compound Annual Growth Rate (CAGR) of the Aircraft Tugs Market?
The projected CAGR is approximately 7.25%.
2. Which companies are prominent players in the Aircraft Tugs Market?
Key companies in the market include Goldhofer AG, Kalmar Motor AB, Fresia SP, LEKTRO Inc, TREPEL Airport Equipment GmbH, Tronair Inc, John Bean Technologies Corp, Tinka Resources Limited, Textron Inc (Ground Support Equipment Inc ), Airtug LLC, MULAG, MOTOTOK.
3. What are the main segments of the Aircraft Tugs Market?
The market segments include Production Analysis, Consumption Analysis, Import Market Analysis (Value & Volume), Export Market Analysis (Value & Volume), Price Trend Analysis.
4. Can you provide details about the market size?
The market size is estimated to be USD 5.51 billion as of 2022.
5. What are some drivers contributing to market growth?
Increase in Internet of Things (IoT) and Autonomous Systems; Rise in Demand for Military and Defense Satellite Communication Solutions.
6. What are the notable trends driving market growth?
Electric Segment is Anticipated to Register the Highest CAGR During the Forecast Period.
7. Are there any restraints impacting market growth?
Cybersecurity Threats to Satellite Communication; Interference in Transmission of Data.
8. Can you provide examples of recent developments in the market?
June 2023: Lokpriyo Gopinath Bordoloi International Airport launched its first electric vehicle tug to handle ground operations.
9. What pricing options are available for accessing the report?
Pricing options include single-user, multi-user, and enterprise licenses priced at USD 4750, USD 5250, and USD 8750 respectively.
10. Is the market size provided in terms of value or volume?
The market size is provided in terms of value, measured in billion.
11. Are there any specific market keywords associated with the report?
Yes, the market keyword associated with the report is "Aircraft Tugs Market," which aids in identifying and referencing the specific market segment covered.
12. How do I determine which pricing option suits my needs best?
The pricing options vary based on user requirements and access needs. Individual users may opt for single-user licenses, while businesses requiring broader access may choose multi-user or enterprise licenses for cost-effective access to the report.
13. Are there any additional resources or data provided in the Aircraft Tugs Market report?
While the report offers comprehensive insights, it's advisable to review the specific contents or supplementary materials provided to ascertain if additional resources or data are available.
14. How can I stay updated on further developments or reports in the Aircraft Tugs Market?
To stay informed about further developments, trends, and reports in the Aircraft Tugs Market, consider subscribing to industry newsletters, following relevant companies and organizations, or regularly checking reputable industry news sources and publications.
Methodology
Step 1 - Identification of Relevant Samples Size from Population Database


Step 2 - Approaches for Defining Global Market Size (Value, Volume* & Price*)

Note*: In applicable scenarios
Step 3 - Data Sources
Primary Research
- Web Analytics
- Survey Reports
- Research Institute
- Latest Research Reports
- Opinion Leaders
Secondary Research
- Annual Reports
- White Paper
- Latest Press Release
- Industry Association
- Paid Database
- Investor Presentations

Step 4 - Data Triangulation
Involves using different sources of information in order to increase the validity of a study
These sources are likely to be stakeholders in a program - participants, other researchers, program staff, other community members, and so on.
Then we put all data in single framework & apply various statistical tools to find out the dynamic on the market.
During the analysis stage, feedback from the stakeholder groups would be compared to determine areas of agreement as well as areas of divergence