Key Insights
The global alfalfa market, valued at $82.08 million in 2025, is projected to experience robust growth, exhibiting a Compound Annual Growth Rate (CAGR) of 6.60% from 2025 to 2033. This expansion is fueled by several key factors. The increasing demand for high-quality animal feed, particularly in the dairy and poultry sectors, is a significant driver. Growing consumer awareness of the nutritional benefits of alfalfa-fed livestock and the rising global population are further bolstering market growth. Technological advancements in alfalfa cultivation and processing, leading to improved yield and quality, are also contributing to the market's expansion. The market is segmented by form (bales, pellets, cubes) and application (dairy animal feed, poultry feed, horse feed, and other applications), with dairy animal feed currently holding the largest market share due to its essential role in dairy production. Regional analysis indicates strong growth potential across North America, Europe, and Asia-Pacific, driven by factors such as established agricultural practices, increasing livestock populations, and government support for sustainable farming.

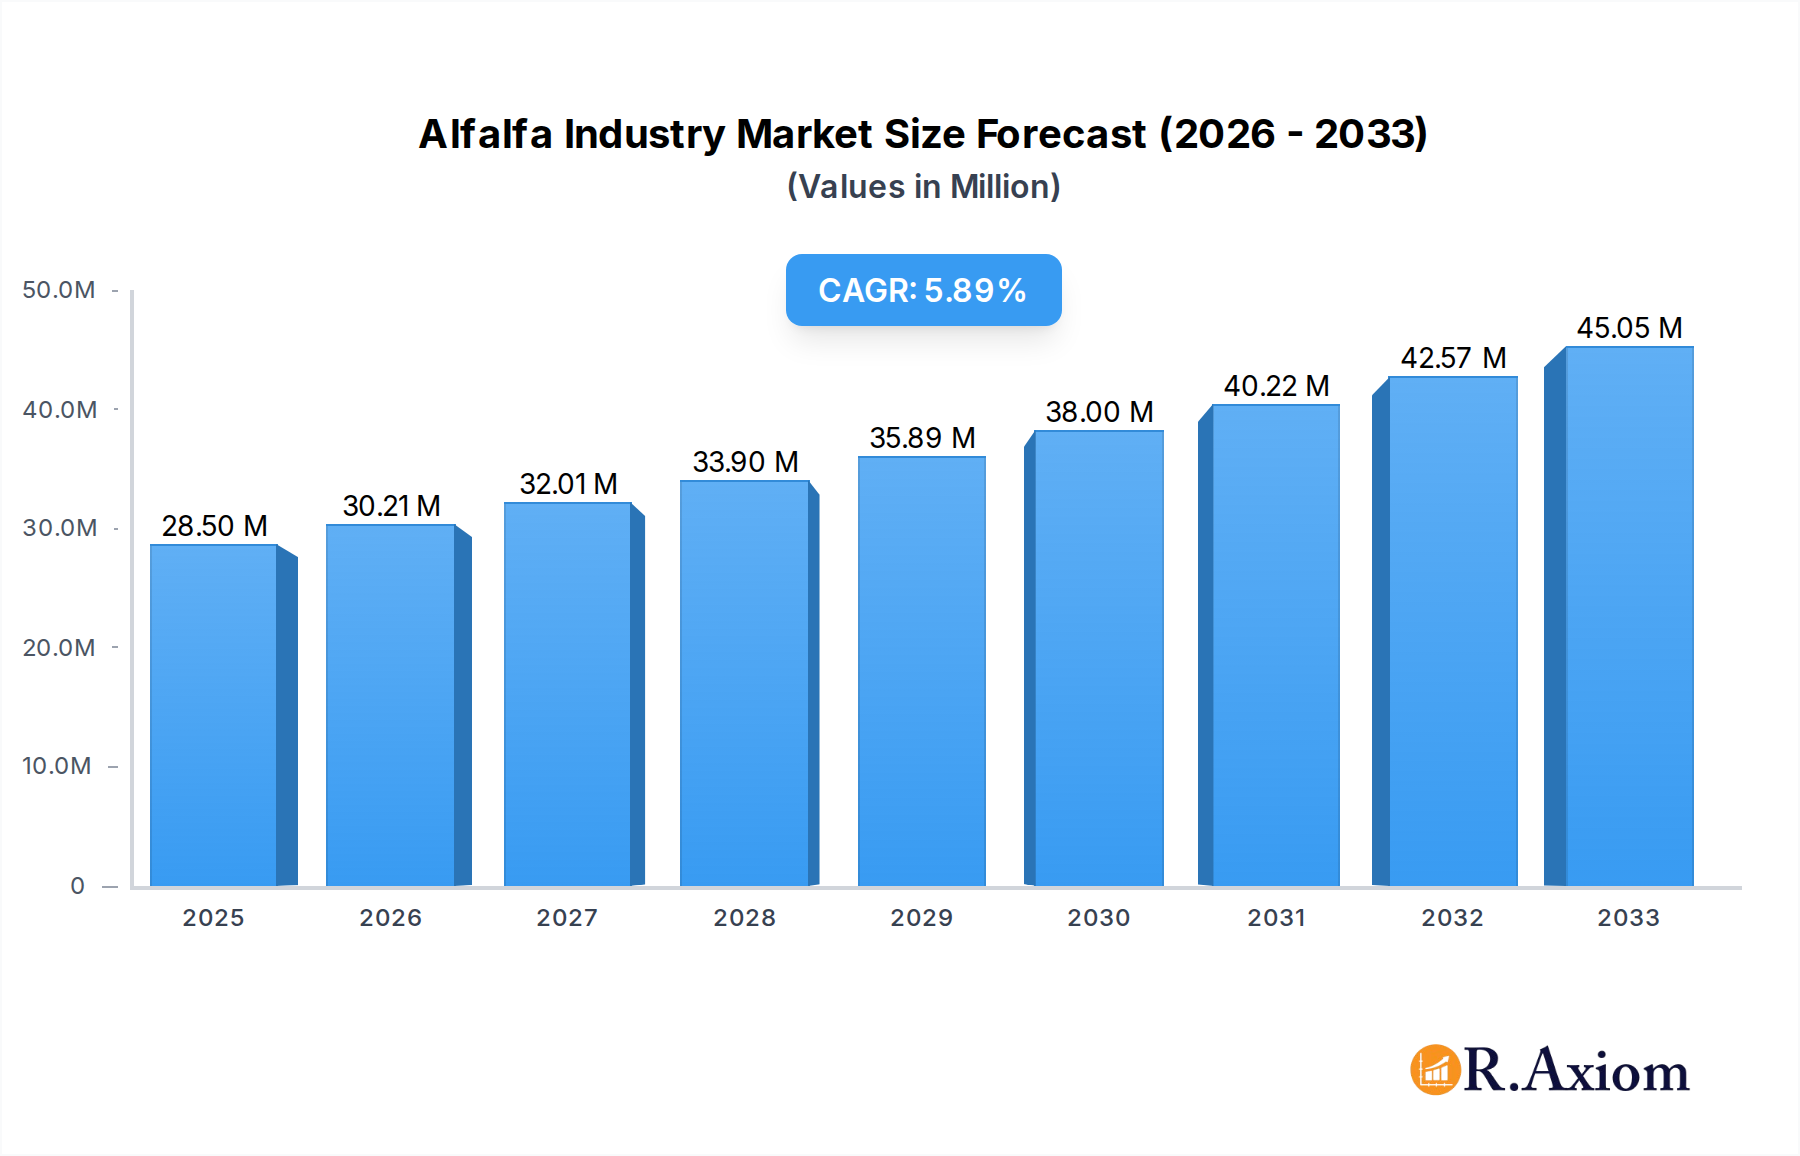
Alfalfa Industry Market Size (In Million)
However, certain challenges restrain market growth. Fluctuations in alfalfa prices due to weather patterns and variations in crop yields pose a risk. Furthermore, the availability of alternative feed sources and the increasing cost of land and labor can impact market expansion. Competition among established players and new entrants also influences market dynamics. To overcome these challenges, market players are focusing on innovative product development, strategic partnerships, and expansion into new geographical markets. The adoption of sustainable farming practices and technological advancements in processing are also crucial for ensuring long-term growth and sustainability within the alfalfa market. The forecast period (2025-2033) anticipates continued market expansion, driven by the factors outlined above, with regional variations reflecting differing market conditions and consumer demands.
Alfalfa Industry Company Market Share
Alfalfa Industry: A Comprehensive Market Report (2019-2033)
This in-depth report provides a comprehensive analysis of the global alfalfa industry, covering market size, segmentation, key players, and future growth prospects from 2019 to 2033. The study period spans from 2019-2024 (Historical Period), with 2025 as the base and estimated year, and a forecast period from 2025-2033. The report uses millions (M) for all value representations.
Alfalfa Industry Market Concentration & Innovation
The alfalfa industry exhibits a moderately concentrated market structure, with several large players holding significant market share. While exact figures are proprietary to the full report, preliminary analysis suggests that the top 5 companies control approximately xx% of the global market. Innovation within the sector is driven by the need to improve feed quality, enhance yield, and develop sustainable farming practices. Key drivers include advancements in harvesting and processing technologies, the exploration of novel alfalfa varieties with enhanced nutritional content, and increasing demand for organic and sustainably produced alfalfa. Regulatory frameworks vary across regions, impacting production and trade. Product substitutes, such as other forage crops, present competitive challenges, while end-user trends, such as shifting animal feed preferences, influence market dynamics. M&A activity within the industry is relatively modest, with a few notable transactions recorded in recent years, totaling approximately xx Million USD over the study period. These activities mostly focused on strategic expansion and vertical integration.
- Market Share Concentration: Top 5 companies hold approximately xx% (exact figures in full report).
- Innovation Drivers: Enhanced feed quality, yield improvement, sustainable farming.
- M&A Activity: Total deal value approximately xx Million USD (2019-2024).
Alfalfa Industry Industry Trends & Insights
The global alfalfa market is experiencing steady growth, driven by rising global demand for animal feed, particularly in the dairy and poultry sectors. The Compound Annual Growth Rate (CAGR) during the forecast period (2025-2033) is projected to be xx%, indicating substantial market expansion. This growth is further fueled by increasing consumer awareness of animal welfare and the demand for high-quality animal feed. However, several factors, including fluctuations in agricultural commodity prices, inclement weather patterns impacting crop yields, and the increasing cost of production, pose challenges to market growth. Technological disruptions, such as precision agriculture techniques, are enhancing efficiency and sustainability. Competitive dynamics are influenced by factors such as pricing strategies, product differentiation, and geographical reach. Market penetration of organic and sustainably sourced alfalfa is gradually increasing, driven by growing consumer preference for eco-friendly products.
Dominant Markets & Segments in Alfalfa Industry
The North American region, particularly the United States and Canada, is currently the dominant market for alfalfa, primarily driven by large-scale dairy and livestock farming. The Dairy Animal Feed application segment holds the largest market share, followed by Horse Feed and Poultry Feed. Within product types, Bales currently represent the largest segment, but Pellets and Cubes are experiencing increased growth due to their ease of handling and storage.
- Key Drivers of Regional Dominance (North America):
- Large-scale dairy and livestock operations.
- Established agricultural infrastructure.
- Favorable climatic conditions.
- Government support for agriculture.
- Key Drivers of Segment Dominance (Dairy Animal Feed):
- High demand from the dairy industry.
- Nutritional value of alfalfa for dairy cattle.
- Expanding dairy production globally.
Alfalfa Industry Product Developments
Recent product innovations within the alfalfa industry have focused on enhancing the nutritional profile of alfalfa, improving its palatability, and developing convenient forms like pellets and cubes. Companies are also investing in technologies that minimize waste and enhance sustainability during the production and processing stages. The introduction of organic and certified alfalfa products is meeting the increasing demand from consumers seeking environmentally friendly options. These developments reflect a shift towards value-added products that cater to the specific needs of different animal types and farming practices.
Report Scope & Segmentation Analysis
This report segments the alfalfa market based on product type (Bales, Pellets, Cubes) and application (Dairy Animal Feed, Poultry Feed, Horse Feed, Other Applications). Each segment is analyzed in detail, providing insights into market size, growth projections, and competitive dynamics. For example, the Bales segment is expected to maintain its leading position, although the Pellets and Cubes segments are exhibiting faster growth rates. Similarly, the Dairy Animal Feed application segment is projected to remain dominant, driven by the growing dairy industry. Detailed market size and growth projections for each segment are included in the full report.
Key Drivers of Alfalfa Industry Growth
The alfalfa industry's growth is driven by several factors, including the increasing global demand for animal feed, particularly from the dairy and poultry sectors; the rising consumer awareness of animal welfare and the resulting demand for high-quality animal feed; and technological advancements that enhance efficiency and sustainability, such as precision agriculture and improved processing techniques. Favorable government policies supporting agricultural development and trade further contribute to market expansion.
Challenges in the Alfalfa Industry Sector
The alfalfa industry faces several challenges, including fluctuating agricultural commodity prices which directly impact profitability; inclement weather patterns impacting crop yields and leading to supply chain disruptions; and increasing costs of production, including fertilizers and labor. Intense competition among industry players also puts pressure on profit margins. These factors can significantly affect market stability and the ability of companies to achieve sustainable growth. Furthermore, stricter environmental regulations in some regions may pose additional operational challenges.
Emerging Opportunities in Alfalfa Industry
The alfalfa industry presents several emerging opportunities, including the growing demand for organic and sustainably sourced alfalfa; the increasing popularity of value-added alfalfa products such as pellets and cubes; and the expansion of the alfalfa market into new regions with growing livestock populations. The development of new alfalfa varieties with enhanced nutritional profiles also presents significant opportunities for market growth. Exploring alternative applications for alfalfa, beyond traditional animal feed, such as in human food products or biofuel production, may also open up new markets.
Leading Players in the Alfalfa Industry Market
- Cubeit Hay Company
- Al Dahra ACX Global Inc
- Border Valley
- Gruppo Carli
- M&C Hay
- Glenvar Hay
- Riverina (Australia) Pty Ltd
- Los Venteros SC
- Green Prairie International
- Haykingdom Inc
- Hay USA
- Knight AG Sourcing
- McCracken Hay Company
- Coaba
- SL Follen Company
- Bailey Farms
- Alfalfa Monegros SL
- Grupo Osés
- Anderson Hay & Grain Inc
- Standlee Hay Company
Key Developments in Alfalfa Industry Industry
- January 2020: Green Prairie International launched a new product called "Green Curd," an air-dried hay product, potentially expanding their business.
- June 2022: Anderson Hay & Grain Inc. expanded to offer USDA-certified organic Timothy hay through its sister company, Andy by Anderson Hay, targeting the small pet market.
Strategic Outlook for Alfalfa Industry Market
The alfalfa industry is poised for continued growth, driven by the expanding global demand for animal feed, increasing consumer focus on animal welfare and sustainability, and ongoing technological advancements. Strategic investments in research and development, focused on improving alfalfa quality and yield, as well as exploring new applications and markets, will be crucial for companies to maintain a competitive edge. The industry is expected to witness consolidation through mergers and acquisitions, leading to a more concentrated market structure in the coming years.
Alfalfa Industry Segmentation
- 1. Production Analysis
- 2. Consumption Analysis
- 3. Import Market Analysis (Value & Volume)
- 4. Export Market Analysis (Value & Volume)
- 5. Price Trend Analysis
Alfalfa Industry Segmentation By Geography
-
1. North America
- 1.1. United States
- 1.2. Canada
- 1.3. Mexico
-
2. South America
- 2.1. Brazil
- 2.2. Argentina
- 2.3. Rest of South America
-
3. Europe
- 3.1. United Kingdom
- 3.2. Germany
- 3.3. France
- 3.4. Italy
- 3.5. Spain
- 3.6. Russia
- 3.7. Benelux
- 3.8. Nordics
- 3.9. Rest of Europe
-
4. Middle East & Africa
- 4.1. Turkey
- 4.2. Israel
- 4.3. GCC
- 4.4. North Africa
- 4.5. South Africa
- 4.6. Rest of Middle East & Africa
-
5. Asia Pacific
- 5.1. China
- 5.2. India
- 5.3. Japan
- 5.4. South Korea
- 5.5. ASEAN
- 5.6. Oceania
- 5.7. Rest of Asia Pacific

Alfalfa Industry Regional Market Share
Geographic Coverage of Alfalfa Industry
Alfalfa Industry REPORT HIGHLIGHTS
| Aspects | Details |
|---|---|
| Study Period | 2020-2034 |
| Base Year | 2025 |
| Estimated Year | 2026 |
| Forecast Period | 2026-2034 |
| Historical Period | 2020-2025 |
| Growth Rate | CAGR of 6.60% from 2020-2034 |
| Segmentation |
|
Table of Contents
- 1. Introduction
- 1.1. Research Scope
- 1.2. Market Segmentation
- 1.3. Research Objective
- 1.4. Definitions and Assumptions
- 2. Executive Summary
- 2.1. Market Snapshot
- 3. Market Dynamics
- 3.1. Market Drivers
- 3.2. Market Restrains
- 3.3. Market Trends
- 3.4. Market Opportunities
- 4. Market Factor Analysis
- 4.1. Porters Five Forces
- 4.1.1. Bargaining Power of Suppliers
- 4.1.2. Bargaining Power of Buyers
- 4.1.3. Threat of New Entrants
- 4.1.4. Threat of Substitutes
- 4.1.5. Competitive Rivalry
- 4.2. PESTEL analysis
- 4.3. BCG Analysis
- 4.3.1. Stars (High Growth, High Market Share)
- 4.3.2. Cash Cows (Low Growth, High Market Share)
- 4.3.3. Question Mark (High Growth, Low Market Share)
- 4.3.4. Dogs (Low Growth, Low Market Share)
- 4.4. Ansoff Matrix Analysis
- 4.5. Supply Chain Analysis
- 4.6. Regulatory Landscape
- 4.7. Current Market Potential and Opportunity Assessment (TAM–SAM–SOM Framework)
- 4.8. RAX Analyst Note
- 4.1. Porters Five Forces
- 5. Market Analysis, Insights and Forecast 2021-2033
- 5.1. Market Analysis, Insights and Forecast - by Production Analysis
- 5.2. Market Analysis, Insights and Forecast - by Consumption Analysis
- 5.3. Market Analysis, Insights and Forecast - by Import Market Analysis (Value & Volume)
- 5.4. Market Analysis, Insights and Forecast - by Export Market Analysis (Value & Volume)
- 5.5. Market Analysis, Insights and Forecast - by Price Trend Analysis
- 5.6. Market Analysis, Insights and Forecast - by Region
- 5.6.1. North America
- 5.6.2. South America
- 5.6.3. Europe
- 5.6.4. Middle East & Africa
- 5.6.5. Asia Pacific
- 6. Global Alfalfa Industry Analysis, Insights and Forecast, 2021-2033
- 6.1. Market Analysis, Insights and Forecast - by Production Analysis
- 6.2. Market Analysis, Insights and Forecast - by Consumption Analysis
- 6.3. Market Analysis, Insights and Forecast - by Import Market Analysis (Value & Volume)
- 6.4. Market Analysis, Insights and Forecast - by Export Market Analysis (Value & Volume)
- 6.5. Market Analysis, Insights and Forecast - by Price Trend Analysis
- 7. North America Alfalfa Industry Analysis, Insights and Forecast, 2020-2032
- 7.1. Market Analysis, Insights and Forecast - by Production Analysis
- 7.2. Market Analysis, Insights and Forecast - by Consumption Analysis
- 7.3. Market Analysis, Insights and Forecast - by Import Market Analysis (Value & Volume)
- 7.4. Market Analysis, Insights and Forecast - by Export Market Analysis (Value & Volume)
- 7.5. Market Analysis, Insights and Forecast - by Price Trend Analysis
- 8. South America Alfalfa Industry Analysis, Insights and Forecast, 2020-2032
- 8.1. Market Analysis, Insights and Forecast - by Production Analysis
- 8.2. Market Analysis, Insights and Forecast - by Consumption Analysis
- 8.3. Market Analysis, Insights and Forecast - by Import Market Analysis (Value & Volume)
- 8.4. Market Analysis, Insights and Forecast - by Export Market Analysis (Value & Volume)
- 8.5. Market Analysis, Insights and Forecast - by Price Trend Analysis
- 9. Europe Alfalfa Industry Analysis, Insights and Forecast, 2020-2032
- 9.1. Market Analysis, Insights and Forecast - by Production Analysis
- 9.2. Market Analysis, Insights and Forecast - by Consumption Analysis
- 9.3. Market Analysis, Insights and Forecast - by Import Market Analysis (Value & Volume)
- 9.4. Market Analysis, Insights and Forecast - by Export Market Analysis (Value & Volume)
- 9.5. Market Analysis, Insights and Forecast - by Price Trend Analysis
- 10. Middle East & Africa Alfalfa Industry Analysis, Insights and Forecast, 2020-2032
- 10.1. Market Analysis, Insights and Forecast - by Production Analysis
- 10.2. Market Analysis, Insights and Forecast - by Consumption Analysis
- 10.3. Market Analysis, Insights and Forecast - by Import Market Analysis (Value & Volume)
- 10.4. Market Analysis, Insights and Forecast - by Export Market Analysis (Value & Volume)
- 10.5. Market Analysis, Insights and Forecast - by Price Trend Analysis
- 11. Asia Pacific Alfalfa Industry Analysis, Insights and Forecast, 2020-2032
- 11.1. Market Analysis, Insights and Forecast - by Production Analysis
- 11.2. Market Analysis, Insights and Forecast - by Consumption Analysis
- 11.3. Market Analysis, Insights and Forecast - by Import Market Analysis (Value & Volume)
- 11.4. Market Analysis, Insights and Forecast - by Export Market Analysis (Value & Volume)
- 11.5. Market Analysis, Insights and Forecast - by Price Trend Analysis
- 12. Competitive Analysis
- 12.1. Company Profiles
- 12.1.1 Cubeit Hay Company
- 12.1.1.1. Company Overview
- 12.1.1.2. Products
- 12.1.1.3. Company Financials
- 12.1.1.4. SWOT Analysis
- 12.1.2 Al Dahra ACX Global Inc
- 12.1.2.1. Company Overview
- 12.1.2.2. Products
- 12.1.2.3. Company Financials
- 12.1.2.4. SWOT Analysis
- 12.1.3 Border Valley
- 12.1.3.1. Company Overview
- 12.1.3.2. Products
- 12.1.3.3. Company Financials
- 12.1.3.4. SWOT Analysis
- 12.1.4 Gruppo Carli
- 12.1.4.1. Company Overview
- 12.1.4.2. Products
- 12.1.4.3. Company Financials
- 12.1.4.4. SWOT Analysis
- 12.1.5 M&C Hay
- 12.1.5.1. Company Overview
- 12.1.5.2. Products
- 12.1.5.3. Company Financials
- 12.1.5.4. SWOT Analysis
- 12.1.6 Glenvar Hay
- 12.1.6.1. Company Overview
- 12.1.6.2. Products
- 12.1.6.3. Company Financials
- 12.1.6.4. SWOT Analysis
- 12.1.7 Riverina (Australia) Pty Ltd
- 12.1.7.1. Company Overview
- 12.1.7.2. Products
- 12.1.7.3. Company Financials
- 12.1.7.4. SWOT Analysis
- 12.1.8 Los Venteros SC
- 12.1.8.1. Company Overview
- 12.1.8.2. Products
- 12.1.8.3. Company Financials
- 12.1.8.4. SWOT Analysis
- 12.1.9 Green Prairie International
- 12.1.9.1. Company Overview
- 12.1.9.2. Products
- 12.1.9.3. Company Financials
- 12.1.9.4. SWOT Analysis
- 12.1.10 Haykingdom Inc
- 12.1.10.1. Company Overview
- 12.1.10.2. Products
- 12.1.10.3. Company Financials
- 12.1.10.4. SWOT Analysis
- 12.1.11 Hay USA
- 12.1.11.1. Company Overview
- 12.1.11.2. Products
- 12.1.11.3. Company Financials
- 12.1.11.4. SWOT Analysis
- 12.1.12 Knight AG Sourcing
- 12.1.12.1. Company Overview
- 12.1.12.2. Products
- 12.1.12.3. Company Financials
- 12.1.12.4. SWOT Analysis
- 12.1.13 McCracken Hay Company
- 12.1.13.1. Company Overview
- 12.1.13.2. Products
- 12.1.13.3. Company Financials
- 12.1.13.4. SWOT Analysis
- 12.1.14 Coaba
- 12.1.14.1. Company Overview
- 12.1.14.2. Products
- 12.1.14.3. Company Financials
- 12.1.14.4. SWOT Analysis
- 12.1.15 SL Follen Company
- 12.1.15.1. Company Overview
- 12.1.15.2. Products
- 12.1.15.3. Company Financials
- 12.1.15.4. SWOT Analysis
- 12.1.16 Bailey Farms
- 12.1.16.1. Company Overview
- 12.1.16.2. Products
- 12.1.16.3. Company Financials
- 12.1.16.4. SWOT Analysis
- 12.1.17 Alfalfa Monegros SL
- 12.1.17.1. Company Overview
- 12.1.17.2. Products
- 12.1.17.3. Company Financials
- 12.1.17.4. SWOT Analysis
- 12.1.18 Grupo Osés
- 12.1.18.1. Company Overview
- 12.1.18.2. Products
- 12.1.18.3. Company Financials
- 12.1.18.4. SWOT Analysis
- 12.1.19 Anderson Hay & Grain Inc
- 12.1.19.1. Company Overview
- 12.1.19.2. Products
- 12.1.19.3. Company Financials
- 12.1.19.4. SWOT Analysis
- 12.1.20 Standlee Hay Compan
- 12.1.20.1. Company Overview
- 12.1.20.2. Products
- 12.1.20.3. Company Financials
- 12.1.20.4. SWOT Analysis
- 12.1.1 Cubeit Hay Company
- 12.2. Market Entropy
- 12.2.1 Company's Key Areas Served
- 12.2.2 Recent Developments
- 12.3. Company Market Share Analysis 2025
- 12.3.1 Top 5 Companies Market Share Analysis
- 12.3.2 Top 3 Companies Market Share Analysis
- 12.4. List of Potential Customers
- 13. Research Methodology
List of Figures
- Figure 1: Global Alfalfa Industry Revenue Breakdown (Million, %) by Region 2025 & 2033
- Figure 2: North America Alfalfa Industry Revenue (Million), by Production Analysis 2025 & 2033
- Figure 3: North America Alfalfa Industry Revenue Share (%), by Production Analysis 2025 & 2033
- Figure 4: North America Alfalfa Industry Revenue (Million), by Consumption Analysis 2025 & 2033
- Figure 5: North America Alfalfa Industry Revenue Share (%), by Consumption Analysis 2025 & 2033
- Figure 6: North America Alfalfa Industry Revenue (Million), by Import Market Analysis (Value & Volume) 2025 & 2033
- Figure 7: North America Alfalfa Industry Revenue Share (%), by Import Market Analysis (Value & Volume) 2025 & 2033
- Figure 8: North America Alfalfa Industry Revenue (Million), by Export Market Analysis (Value & Volume) 2025 & 2033
- Figure 9: North America Alfalfa Industry Revenue Share (%), by Export Market Analysis (Value & Volume) 2025 & 2033
- Figure 10: North America Alfalfa Industry Revenue (Million), by Price Trend Analysis 2025 & 2033
- Figure 11: North America Alfalfa Industry Revenue Share (%), by Price Trend Analysis 2025 & 2033
- Figure 12: North America Alfalfa Industry Revenue (Million), by Country 2025 & 2033
- Figure 13: North America Alfalfa Industry Revenue Share (%), by Country 2025 & 2033
- Figure 14: South America Alfalfa Industry Revenue (Million), by Production Analysis 2025 & 2033
- Figure 15: South America Alfalfa Industry Revenue Share (%), by Production Analysis 2025 & 2033
- Figure 16: South America Alfalfa Industry Revenue (Million), by Consumption Analysis 2025 & 2033
- Figure 17: South America Alfalfa Industry Revenue Share (%), by Consumption Analysis 2025 & 2033
- Figure 18: South America Alfalfa Industry Revenue (Million), by Import Market Analysis (Value & Volume) 2025 & 2033
- Figure 19: South America Alfalfa Industry Revenue Share (%), by Import Market Analysis (Value & Volume) 2025 & 2033
- Figure 20: South America Alfalfa Industry Revenue (Million), by Export Market Analysis (Value & Volume) 2025 & 2033
- Figure 21: South America Alfalfa Industry Revenue Share (%), by Export Market Analysis (Value & Volume) 2025 & 2033
- Figure 22: South America Alfalfa Industry Revenue (Million), by Price Trend Analysis 2025 & 2033
- Figure 23: South America Alfalfa Industry Revenue Share (%), by Price Trend Analysis 2025 & 2033
- Figure 24: South America Alfalfa Industry Revenue (Million), by Country 2025 & 2033
- Figure 25: South America Alfalfa Industry Revenue Share (%), by Country 2025 & 2033
- Figure 26: Europe Alfalfa Industry Revenue (Million), by Production Analysis 2025 & 2033
- Figure 27: Europe Alfalfa Industry Revenue Share (%), by Production Analysis 2025 & 2033
- Figure 28: Europe Alfalfa Industry Revenue (Million), by Consumption Analysis 2025 & 2033
- Figure 29: Europe Alfalfa Industry Revenue Share (%), by Consumption Analysis 2025 & 2033
- Figure 30: Europe Alfalfa Industry Revenue (Million), by Import Market Analysis (Value & Volume) 2025 & 2033
- Figure 31: Europe Alfalfa Industry Revenue Share (%), by Import Market Analysis (Value & Volume) 2025 & 2033
- Figure 32: Europe Alfalfa Industry Revenue (Million), by Export Market Analysis (Value & Volume) 2025 & 2033
- Figure 33: Europe Alfalfa Industry Revenue Share (%), by Export Market Analysis (Value & Volume) 2025 & 2033
- Figure 34: Europe Alfalfa Industry Revenue (Million), by Price Trend Analysis 2025 & 2033
- Figure 35: Europe Alfalfa Industry Revenue Share (%), by Price Trend Analysis 2025 & 2033
- Figure 36: Europe Alfalfa Industry Revenue (Million), by Country 2025 & 2033
- Figure 37: Europe Alfalfa Industry Revenue Share (%), by Country 2025 & 2033
- Figure 38: Middle East & Africa Alfalfa Industry Revenue (Million), by Production Analysis 2025 & 2033
- Figure 39: Middle East & Africa Alfalfa Industry Revenue Share (%), by Production Analysis 2025 & 2033
- Figure 40: Middle East & Africa Alfalfa Industry Revenue (Million), by Consumption Analysis 2025 & 2033
- Figure 41: Middle East & Africa Alfalfa Industry Revenue Share (%), by Consumption Analysis 2025 & 2033
- Figure 42: Middle East & Africa Alfalfa Industry Revenue (Million), by Import Market Analysis (Value & Volume) 2025 & 2033
- Figure 43: Middle East & Africa Alfalfa Industry Revenue Share (%), by Import Market Analysis (Value & Volume) 2025 & 2033
- Figure 44: Middle East & Africa Alfalfa Industry Revenue (Million), by Export Market Analysis (Value & Volume) 2025 & 2033
- Figure 45: Middle East & Africa Alfalfa Industry Revenue Share (%), by Export Market Analysis (Value & Volume) 2025 & 2033
- Figure 46: Middle East & Africa Alfalfa Industry Revenue (Million), by Price Trend Analysis 2025 & 2033
- Figure 47: Middle East & Africa Alfalfa Industry Revenue Share (%), by Price Trend Analysis 2025 & 2033
- Figure 48: Middle East & Africa Alfalfa Industry Revenue (Million), by Country 2025 & 2033
- Figure 49: Middle East & Africa Alfalfa Industry Revenue Share (%), by Country 2025 & 2033
- Figure 50: Asia Pacific Alfalfa Industry Revenue (Million), by Production Analysis 2025 & 2033
- Figure 51: Asia Pacific Alfalfa Industry Revenue Share (%), by Production Analysis 2025 & 2033
- Figure 52: Asia Pacific Alfalfa Industry Revenue (Million), by Consumption Analysis 2025 & 2033
- Figure 53: Asia Pacific Alfalfa Industry Revenue Share (%), by Consumption Analysis 2025 & 2033
- Figure 54: Asia Pacific Alfalfa Industry Revenue (Million), by Import Market Analysis (Value & Volume) 2025 & 2033
- Figure 55: Asia Pacific Alfalfa Industry Revenue Share (%), by Import Market Analysis (Value & Volume) 2025 & 2033
- Figure 56: Asia Pacific Alfalfa Industry Revenue (Million), by Export Market Analysis (Value & Volume) 2025 & 2033
- Figure 57: Asia Pacific Alfalfa Industry Revenue Share (%), by Export Market Analysis (Value & Volume) 2025 & 2033
- Figure 58: Asia Pacific Alfalfa Industry Revenue (Million), by Price Trend Analysis 2025 & 2033
- Figure 59: Asia Pacific Alfalfa Industry Revenue Share (%), by Price Trend Analysis 2025 & 2033
- Figure 60: Asia Pacific Alfalfa Industry Revenue (Million), by Country 2025 & 2033
- Figure 61: Asia Pacific Alfalfa Industry Revenue Share (%), by Country 2025 & 2033
List of Tables
- Table 1: Global Alfalfa Industry Revenue Million Forecast, by Production Analysis 2020 & 2033
- Table 2: Global Alfalfa Industry Revenue Million Forecast, by Consumption Analysis 2020 & 2033
- Table 3: Global Alfalfa Industry Revenue Million Forecast, by Import Market Analysis (Value & Volume) 2020 & 2033
- Table 4: Global Alfalfa Industry Revenue Million Forecast, by Export Market Analysis (Value & Volume) 2020 & 2033
- Table 5: Global Alfalfa Industry Revenue Million Forecast, by Price Trend Analysis 2020 & 2033
- Table 6: Global Alfalfa Industry Revenue Million Forecast, by Region 2020 & 2033
- Table 7: Global Alfalfa Industry Revenue Million Forecast, by Production Analysis 2020 & 2033
- Table 8: Global Alfalfa Industry Revenue Million Forecast, by Consumption Analysis 2020 & 2033
- Table 9: Global Alfalfa Industry Revenue Million Forecast, by Import Market Analysis (Value & Volume) 2020 & 2033
- Table 10: Global Alfalfa Industry Revenue Million Forecast, by Export Market Analysis (Value & Volume) 2020 & 2033
- Table 11: Global Alfalfa Industry Revenue Million Forecast, by Price Trend Analysis 2020 & 2033
- Table 12: Global Alfalfa Industry Revenue Million Forecast, by Country 2020 & 2033
- Table 13: United States Alfalfa Industry Revenue (Million) Forecast, by Application 2020 & 2033
- Table 14: Canada Alfalfa Industry Revenue (Million) Forecast, by Application 2020 & 2033
- Table 15: Mexico Alfalfa Industry Revenue (Million) Forecast, by Application 2020 & 2033
- Table 16: Global Alfalfa Industry Revenue Million Forecast, by Production Analysis 2020 & 2033
- Table 17: Global Alfalfa Industry Revenue Million Forecast, by Consumption Analysis 2020 & 2033
- Table 18: Global Alfalfa Industry Revenue Million Forecast, by Import Market Analysis (Value & Volume) 2020 & 2033
- Table 19: Global Alfalfa Industry Revenue Million Forecast, by Export Market Analysis (Value & Volume) 2020 & 2033
- Table 20: Global Alfalfa Industry Revenue Million Forecast, by Price Trend Analysis 2020 & 2033
- Table 21: Global Alfalfa Industry Revenue Million Forecast, by Country 2020 & 2033
- Table 22: Brazil Alfalfa Industry Revenue (Million) Forecast, by Application 2020 & 2033
- Table 23: Argentina Alfalfa Industry Revenue (Million) Forecast, by Application 2020 & 2033
- Table 24: Rest of South America Alfalfa Industry Revenue (Million) Forecast, by Application 2020 & 2033
- Table 25: Global Alfalfa Industry Revenue Million Forecast, by Production Analysis 2020 & 2033
- Table 26: Global Alfalfa Industry Revenue Million Forecast, by Consumption Analysis 2020 & 2033
- Table 27: Global Alfalfa Industry Revenue Million Forecast, by Import Market Analysis (Value & Volume) 2020 & 2033
- Table 28: Global Alfalfa Industry Revenue Million Forecast, by Export Market Analysis (Value & Volume) 2020 & 2033
- Table 29: Global Alfalfa Industry Revenue Million Forecast, by Price Trend Analysis 2020 & 2033
- Table 30: Global Alfalfa Industry Revenue Million Forecast, by Country 2020 & 2033
- Table 31: United Kingdom Alfalfa Industry Revenue (Million) Forecast, by Application 2020 & 2033
- Table 32: Germany Alfalfa Industry Revenue (Million) Forecast, by Application 2020 & 2033
- Table 33: France Alfalfa Industry Revenue (Million) Forecast, by Application 2020 & 2033
- Table 34: Italy Alfalfa Industry Revenue (Million) Forecast, by Application 2020 & 2033
- Table 35: Spain Alfalfa Industry Revenue (Million) Forecast, by Application 2020 & 2033
- Table 36: Russia Alfalfa Industry Revenue (Million) Forecast, by Application 2020 & 2033
- Table 37: Benelux Alfalfa Industry Revenue (Million) Forecast, by Application 2020 & 2033
- Table 38: Nordics Alfalfa Industry Revenue (Million) Forecast, by Application 2020 & 2033
- Table 39: Rest of Europe Alfalfa Industry Revenue (Million) Forecast, by Application 2020 & 2033
- Table 40: Global Alfalfa Industry Revenue Million Forecast, by Production Analysis 2020 & 2033
- Table 41: Global Alfalfa Industry Revenue Million Forecast, by Consumption Analysis 2020 & 2033
- Table 42: Global Alfalfa Industry Revenue Million Forecast, by Import Market Analysis (Value & Volume) 2020 & 2033
- Table 43: Global Alfalfa Industry Revenue Million Forecast, by Export Market Analysis (Value & Volume) 2020 & 2033
- Table 44: Global Alfalfa Industry Revenue Million Forecast, by Price Trend Analysis 2020 & 2033
- Table 45: Global Alfalfa Industry Revenue Million Forecast, by Country 2020 & 2033
- Table 46: Turkey Alfalfa Industry Revenue (Million) Forecast, by Application 2020 & 2033
- Table 47: Israel Alfalfa Industry Revenue (Million) Forecast, by Application 2020 & 2033
- Table 48: GCC Alfalfa Industry Revenue (Million) Forecast, by Application 2020 & 2033
- Table 49: North Africa Alfalfa Industry Revenue (Million) Forecast, by Application 2020 & 2033
- Table 50: South Africa Alfalfa Industry Revenue (Million) Forecast, by Application 2020 & 2033
- Table 51: Rest of Middle East & Africa Alfalfa Industry Revenue (Million) Forecast, by Application 2020 & 2033
- Table 52: Global Alfalfa Industry Revenue Million Forecast, by Production Analysis 2020 & 2033
- Table 53: Global Alfalfa Industry Revenue Million Forecast, by Consumption Analysis 2020 & 2033
- Table 54: Global Alfalfa Industry Revenue Million Forecast, by Import Market Analysis (Value & Volume) 2020 & 2033
- Table 55: Global Alfalfa Industry Revenue Million Forecast, by Export Market Analysis (Value & Volume) 2020 & 2033
- Table 56: Global Alfalfa Industry Revenue Million Forecast, by Price Trend Analysis 2020 & 2033
- Table 57: Global Alfalfa Industry Revenue Million Forecast, by Country 2020 & 2033
- Table 58: China Alfalfa Industry Revenue (Million) Forecast, by Application 2020 & 2033
- Table 59: India Alfalfa Industry Revenue (Million) Forecast, by Application 2020 & 2033
- Table 60: Japan Alfalfa Industry Revenue (Million) Forecast, by Application 2020 & 2033
- Table 61: South Korea Alfalfa Industry Revenue (Million) Forecast, by Application 2020 & 2033
- Table 62: ASEAN Alfalfa Industry Revenue (Million) Forecast, by Application 2020 & 2033
- Table 63: Oceania Alfalfa Industry Revenue (Million) Forecast, by Application 2020 & 2033
- Table 64: Rest of Asia Pacific Alfalfa Industry Revenue (Million) Forecast, by Application 2020 & 2033
Frequently Asked Questions
1. What is the projected Compound Annual Growth Rate (CAGR) of the Alfalfa Industry?
The projected CAGR is approximately 6.60%.
2. Which companies are prominent players in the Alfalfa Industry?
Key companies in the market include Cubeit Hay Company, Al Dahra ACX Global Inc, Border Valley, Gruppo Carli, M&C Hay, Glenvar Hay, Riverina (Australia) Pty Ltd, Los Venteros SC, Green Prairie International, Haykingdom Inc, Hay USA, Knight AG Sourcing, McCracken Hay Company, Coaba, SL Follen Company, Bailey Farms, Alfalfa Monegros SL, Grupo Osés, Anderson Hay & Grain Inc, Standlee Hay Compan.
3. What are the main segments of the Alfalfa Industry?
The market segments include Production Analysis, Consumption Analysis, Import Market Analysis (Value & Volume), Export Market Analysis (Value & Volume), Price Trend Analysis.
4. Can you provide details about the market size?
The market size is estimated to be USD 82.08 Million as of 2022.
5. What are some drivers contributing to market growth?
Seed Treatment As A Solution To Enhance Yield; Growing Awareness For Seed Treatment Among The Farmers; Rising Trend Of Organic Farming.
6. What are the notable trends driving market growth?
Increasing Demand for Dairy and Meat Products.
7. Are there any restraints impacting market growth?
Limitations Across Farm-Level Seed Treatment; Rising Environmental Concerns.
8. Can you provide examples of recent developments in the market?
June 2022: Anderson Hay & Grain (Anderson), the leading exporter of premium hay and straw products specializing in Timothy and alfalfa hay and grass straw products, is expanding to offer the US Department of Agriculture (USDA) certified organic Timothy hay through its sister company, Andy by Anderson Hay, a new company that offers high-quality hay and all-natural products for rabbits, guinea pigs, chinchillas, and other small pets.
9. What pricing options are available for accessing the report?
Pricing options include single-user, multi-user, and enterprise licenses priced at USD 4750, USD 5250, and USD 8750 respectively.
10. Is the market size provided in terms of value or volume?
The market size is provided in terms of value, measured in Million.
11. Are there any specific market keywords associated with the report?
Yes, the market keyword associated with the report is "Alfalfa Industry," which aids in identifying and referencing the specific market segment covered.
12. How do I determine which pricing option suits my needs best?
The pricing options vary based on user requirements and access needs. Individual users may opt for single-user licenses, while businesses requiring broader access may choose multi-user or enterprise licenses for cost-effective access to the report.
13. Are there any additional resources or data provided in the Alfalfa Industry report?
While the report offers comprehensive insights, it's advisable to review the specific contents or supplementary materials provided to ascertain if additional resources or data are available.
14. How can I stay updated on further developments or reports in the Alfalfa Industry?
To stay informed about further developments, trends, and reports in the Alfalfa Industry, consider subscribing to industry newsletters, following relevant companies and organizations, or regularly checking reputable industry news sources and publications.
Methodology
Step 1 - Identification of Relevant Samples Size from Population Database


Step 2 - Approaches for Defining Global Market Size (Value, Volume* & Price*)

Note*: In applicable scenarios
Step 3 - Data Sources
Primary Research
- Web Analytics
- Survey Reports
- Research Institute
- Latest Research Reports
- Opinion Leaders
Secondary Research
- Annual Reports
- White Paper
- Latest Press Release
- Industry Association
- Paid Database
- Investor Presentations

Step 4 - Data Triangulation
Involves using different sources of information in order to increase the validity of a study
These sources are likely to be stakeholders in a program - participants, other researchers, program staff, other community members, and so on.
Then we put all data in single framework & apply various statistical tools to find out the dynamic on the market.
During the analysis stage, feedback from the stakeholder groups would be compared to determine areas of agreement as well as areas of divergence

