

Key Insights
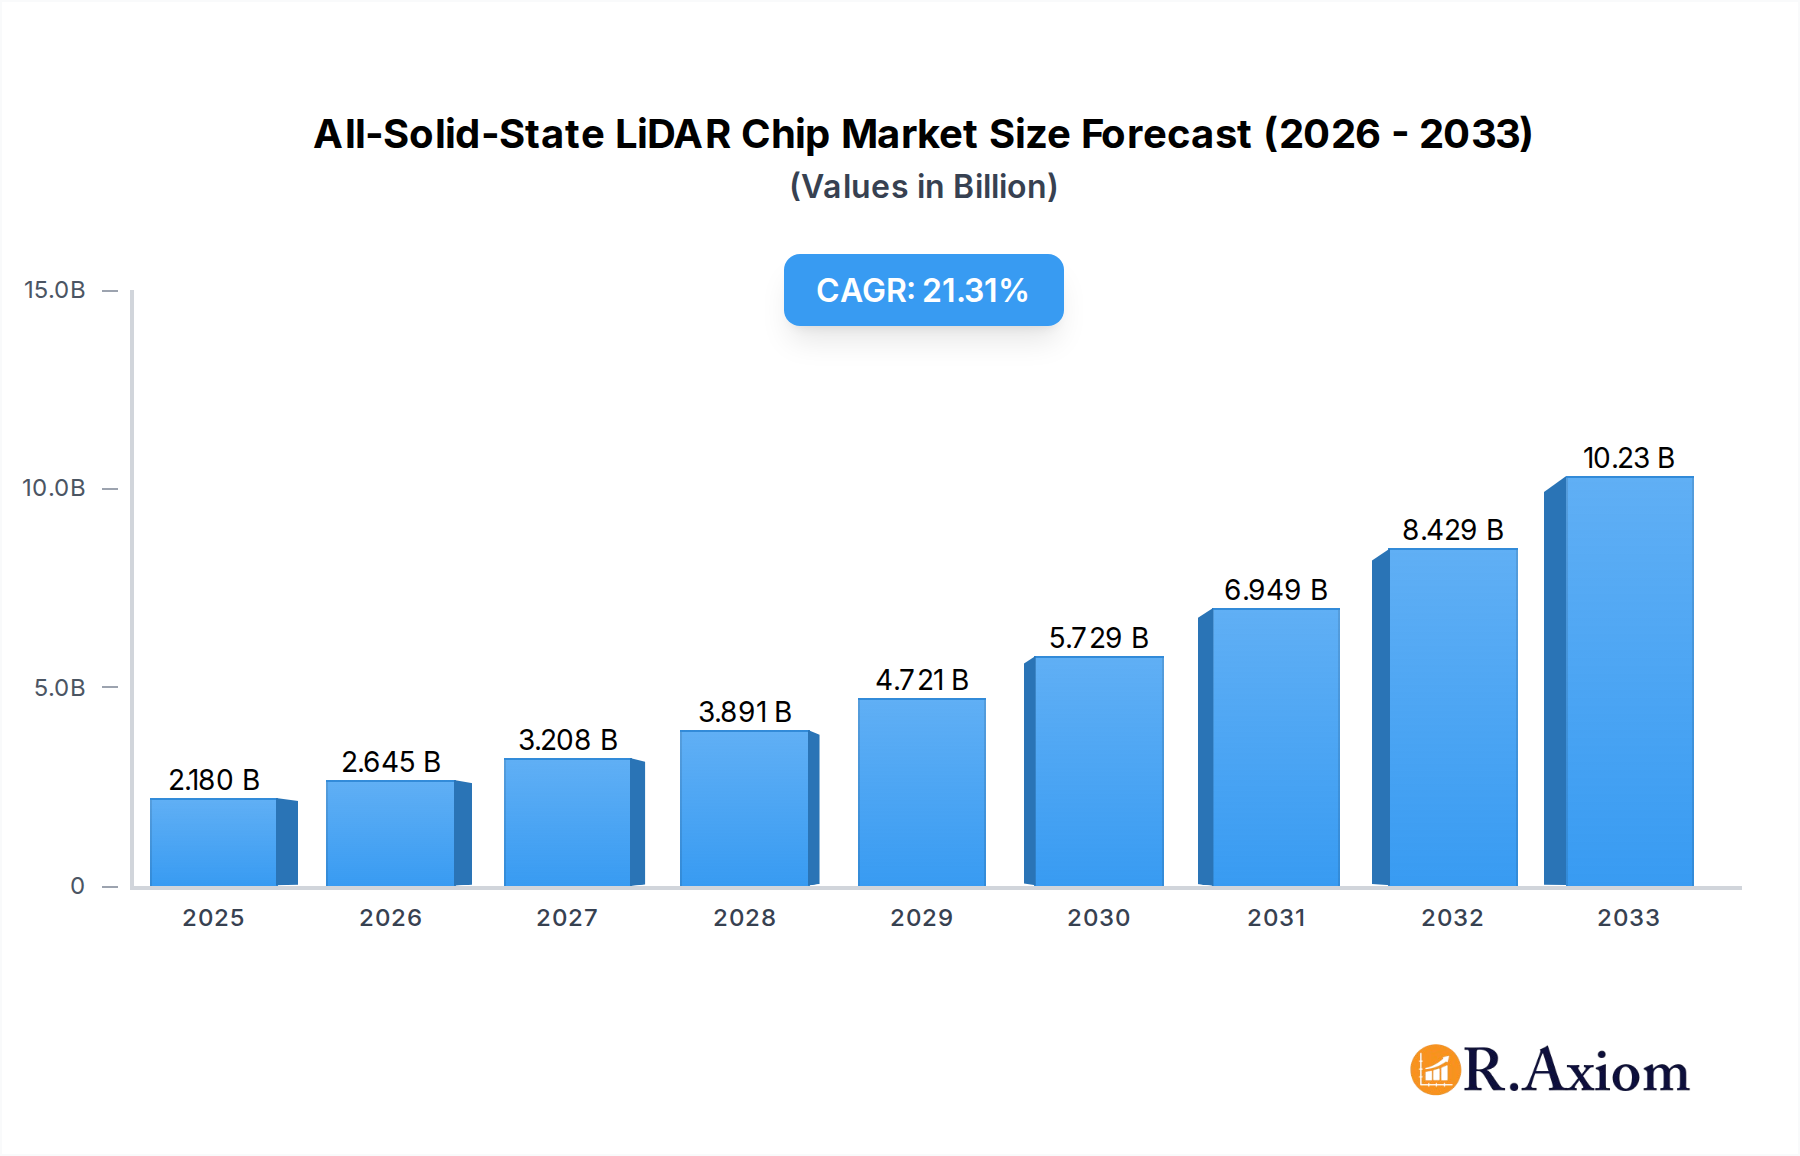
The All-Solid-State LiDAR Chip market is poised for substantial growth, projected to reach a market size of $2.18 billion in 2025. This robust expansion is driven by a remarkable CAGR of 20.17%, indicating a dynamic and rapidly evolving sector. The primary catalyst for this surge is the increasing integration of advanced sensing technologies across various applications, most notably in consumer electronics and the burgeoning automotive sector for advanced driver-assistance systems (ADAS) and autonomous driving. The shift towards more compact, durable, and cost-effective LiDAR solutions, epitomized by solid-state architectures, is a significant trend. MEMS LiDAR chips and phased array LiDAR chips are expected to capture significant market share due to their enhanced performance characteristics and adaptability to diverse use cases.

All-Solid-State LiDAR Chip Market Size (In Billion)
This market's trajectory is further bolstered by its expanding applications in agriculture for precision farming, and in industrial settings for automation and safety. While the growth is strong, certain restraints like initial high manufacturing costs for cutting-edge technologies and the need for widespread industry standardization could present challenges. However, ongoing innovation, particularly from key players like Velodyne Lidar, Innoviz Technologies, and Luminar Technologies, is continuously pushing the boundaries of performance and affordability. The forecast period from 2025 to 2033 anticipates sustained high growth, with significant market penetration expected across North America, Europe, and the Asia Pacific, particularly in China and Japan, underscoring the global appeal and necessity of these advanced sensing solutions.
All-Solid-State LiDAR Chip Company Market Share
All-Solid-State LiDAR Chip Market Concentration & Innovation
The all-solid-state LiDAR chip market exhibits a moderate concentration, with key players like Velodyne Lidar, Innoviz Technologies, LeddarTech, Quanergy Solutions, Ouster, Luminar Technologies, RoboSense, and Aeva driving innovation and shaping competitive dynamics. Innovation in this sector is primarily fueled by the relentless pursuit of higher resolution, increased range, reduced cost, and enhanced reliability for automotive, industrial, and consumer electronics applications. Regulatory frameworks, particularly concerning autonomous driving safety standards and data privacy, are increasingly influencing product development and market entry. Product substitutes, such as radar and traditional cameras, continue to pose a challenge, necessitating continuous technological advancements in LiDAR to demonstrate clear performance advantages. End-user trends are gravitating towards miniaturization, lower power consumption, and seamless integration into existing systems, particularly within the automotive segment for advanced driver-assistance systems (ADAS) and autonomous driving. Mergers and acquisitions (M&A) activity is expected to increase as larger automotive suppliers and technology giants seek to secure proprietary LiDAR technologies, with estimated M&A deal values potentially reaching 1 billion in strategic acquisitions of emerging LiDAR startups or key component suppliers during the forecast period. The market share distribution is dynamic, with leading companies holding significant portions of specific sub-segments.
All-Solid-State LiDAR Chip Industry Trends & Insights
The global all-solid-state LiDAR chip market is poised for exponential growth, projected to achieve a compound annual growth rate (CAGR) of 20% over the forecast period of 2025–2033. This robust expansion is propelled by several interconnected trends and insights that are reshaping various industries. A primary growth driver is the accelerating adoption of autonomous driving technologies across passenger vehicles, commercial fleets, and robotic platforms. The increasing demand for enhanced safety features, precise object detection, and detailed environmental mapping in ADAS applications is directly translating into a surge in LiDAR integration. Beyond automotive, the industrial sector is witnessing significant adoption for automation, robotics, logistics, and smart manufacturing, where LiDAR enables precise navigation, inventory management, and quality control. Consumer electronics, while currently a smaller segment, presents immense future potential, with applications emerging in augmented reality (AR), virtual reality (VR), and advanced robotics for home use.
Technological disruptions are a constant feature of this market. The transition from mechanical spinning LiDARs to solid-state architectures, including MEMS and phased array LiDAR chips, is a pivotal development, promising greater durability, smaller form factors, and lower manufacturing costs, which are crucial for mass market penetration. Advances in semiconductor technology, laser sources (such as VCSELs), and detector materials are further enhancing LiDAR performance, enabling higher point cloud densities, improved weather resilience, and extended detection ranges exceeding 1000 meters.
Consumer preferences are increasingly influenced by the perceived safety and convenience offered by autonomous systems, driving demand for sophisticated sensing solutions like LiDAR. As the cost of LiDAR technology decreases, its accessibility for a wider range of applications, including those in agriculture for precision farming and in smart city infrastructure for traffic management and public safety, will grow.
The competitive landscape is intensifying, with established players like Velodyne Lidar, Innoviz Technologies, and Luminar Technologies competing with emerging innovators and silicon manufacturers. Strategic partnerships between LiDAR providers, automotive OEMs, and technology companies are becoming commonplace, aimed at co-development and faster integration into production vehicles. The market penetration of all-solid-state LiDAR chips is still in its nascent stages but is projected to reach 30% by 2030, indicating substantial room for growth. The overall market size is estimated to reach 50 billion by 2033, with significant contributions from automotive, industrial, and emerging consumer applications.
Dominant Markets & Segments in All-Solid-State LiDAR Chip
The all-solid-state LiDAR chip market demonstrates distinct dominance across various geographical regions and application segments, driven by specific economic policies, infrastructure development, and technological adoption rates. North America, particularly the United States, currently leads in market share, attributed to significant investments in autonomous vehicle research and development, a robust automotive industry, and supportive government initiatives promoting smart city technologies. Within North America, countries like Germany and China are emerging as strong contenders, fueled by aggressive automotive manufacturing capacities and ambitious targets for electric vehicle (EV) and autonomous driving deployment.
Application Segments:
- Automotive: This segment is the undisputed leader, accounting for over 70% of the total market revenue.
- Key Drivers: The stringent safety regulations in major automotive markets mandating advanced driver-assistance systems (ADAS) and the burgeoning development of Level 3 and Level 4 autonomous driving systems are the primary catalysts. The need for precise 3D environmental perception, object detection, and localization in real-time is paramount for vehicle safety and navigation. The trend towards LiDAR integration in premium and eventually mass-market vehicles is accelerating.
- Industrial: This segment is experiencing rapid growth, projected to capture 20% of the market by 2033.
- Key Drivers: Automation in manufacturing, warehousing, logistics, and robotics are key growth engines. LiDAR's ability to provide accurate spatial data for robot navigation, automated guided vehicles (AGVs), inventory management, and quality inspection is highly valued. Investments in smart factories and Industry 4.0 initiatives are further bolstering demand.
- Consumer Electronics: Currently a smaller but rapidly expanding segment, projected to reach 5% by 2033.
- Key Drivers: The integration of LiDAR into smartphones for advanced camera features, AR/VR devices for enhanced spatial mapping, and emerging consumer robots is driving adoption. As costs decrease, applications in drone navigation and advanced personal devices will become more prevalent.
- Others: This broad category, including applications in agriculture, surveying, and security, is expected to constitute 5% of the market.
- Key Drivers: Precision agriculture utilizing LiDAR for crop monitoring, yield estimation, and land management is gaining traction. Surveying and mapping applications benefit from LiDAR's ability to create highly accurate digital elevation models. Security and surveillance systems are also exploring LiDAR for enhanced perimeter detection and threat assessment.
Types of LiDAR Chips:
- MEMS LiDAR Chip: This type is gaining significant traction due to its scalability and cost-effectiveness.
- Key Drivers: The mechanical simplicity and miniaturization potential of MEMS-based LiDAR chips make them highly suitable for automotive integration and consumer electronics. Their ability to achieve high scanning speeds and resolutions at a lower cost point compared to traditional mechanical LiDARs is a major advantage.
- Phased Array LiDAR Chip: This technology is at the forefront of innovation, offering advanced capabilities.
- Key Drivers: Phased array LiDARs provide electronic beam steering without any moving parts, promising exceptional reliability, speed, and the ability to rapidly adapt scanning patterns. This makes them ideal for high-performance applications demanding rapid environmental perception and sophisticated object tracking.
- Others (e.g., Flash LiDAR, FMCW LiDAR): These emerging technologies cater to niche applications and are expected to grow as their performance and cost-effectiveness improve. Flash LiDAR offers a wide field of view with no scanning, while Frequency-Modulated Continuous-Wave (FMCW) LiDAR provides velocity measurements and immunity to interference.
The dominance of the automotive segment, coupled with the rising importance of MEMS and phased array LiDAR chip technologies, highlights the industry's trajectory towards mass-market adoption and advanced performance capabilities.
All-Solid-State LiDAR Chip Product Developments
Recent product developments in the all-solid-state LiDAR chip market are characterized by a focus on miniaturization, cost reduction, and enhanced performance for automotive and industrial applications. Companies are introducing compact, low-profile LiDAR modules designed for seamless integration into vehicle architectures, enabling higher levels of autonomy and safety. Innovations include the development of higher resolution sensors capable of detecting smaller objects at greater distances, improved performance in adverse weather conditions (such as fog, rain, and snow), and the implementation of advanced signal processing techniques for more robust data acquisition. Competitive advantages are being built around proprietary chip architectures, novel laser technologies, and efficient manufacturing processes, aiming to achieve a compelling price-performance ratio for mass deployment.
Report Scope & Segmentation Analysis
This report provides a comprehensive analysis of the global all-solid-state LiDAR chip market, encompassing various segmentation dimensions to offer deep insights into market dynamics. The primary segmentation includes Application, Types, and Regions.
- Application: The report meticulously analyzes the market across Consumer Electronics, Agriculture, Industrial, and Others segments. Growth projections and market sizes for each application are detailed, highlighting the competitive dynamics and the specific demand drivers within each sector.
- Types: The market is segmented into Phased Array LiDAR Chip, MEMS LiDAR Chip, and Others. The analysis includes market share, growth forecasts, and the technological advancements that differentiate these LiDAR chip types, along with their respective competitive landscapes.
- Regions: A detailed regional analysis covers key markets like North America, Europe, Asia Pacific, Latin America, and the Middle East & Africa, examining market sizes, growth rates, and key players influencing each geographical segment.
The segmentation analysis is crucial for understanding the diverse adoption patterns and future potential across these categories, providing actionable insights for stakeholders.
Key Drivers of All-Solid-State LiDAR Chip Growth
The growth of the all-solid-state LiDAR chip market is primarily propelled by significant technological advancements and increasing adoption across key industries.
- Automotive Industry Expansion: The burgeoning demand for advanced driver-assistance systems (ADAS) and the pursuit of fully autonomous vehicles are major catalysts. Stringent safety regulations and the desire for enhanced vehicle perception are driving LiDAR integration.
- Technological Innovations: The development of smaller, more power-efficient, and cost-effective solid-state LiDAR chips, such as MEMS and phased array technologies, is making the technology more accessible for mass-market applications.
- Industrial Automation and Robotics: The need for precise navigation, object detection, and spatial mapping in smart factories, warehouses, and logistics operations is a significant growth driver.
- Emerging Consumer Applications: The integration of LiDAR into consumer electronics like smartphones and AR/VR devices for enhanced spatial sensing is opening new avenues for market growth.
Challenges in the All-Solid-State LiDAR Chip Sector
Despite its robust growth trajectory, the all-solid-state LiDAR chip sector faces several challenges that could impede its full market potential.
- High Manufacturing Costs: While declining, the production costs of advanced LiDAR chips remain a barrier to widespread adoption in price-sensitive applications, particularly in consumer electronics and certain industrial sectors.
- Performance Limitations in Extreme Weather: LiDAR performance can be affected by adverse weather conditions such as heavy rain, snow, or fog, necessitating the development of more resilient technologies or complementary sensor fusion strategies.
- Standardization and Interoperability: A lack of universal industry standards for LiDAR data formats and communication protocols can create integration challenges for system developers and automotive manufacturers.
- Supply Chain Volatility: Reliance on specialized components and manufacturing processes can lead to supply chain disruptions, impacting production volumes and delivery timelines, with potential impacts on market growth estimated to be in the range of 5% to 10% of projected revenue.
Emerging Opportunities in All-Solid-State LiDAR Chip
The all-solid-state LiDAR chip market is ripe with emerging opportunities driven by evolving technological capabilities and expanding application horizons.
- Smart City Infrastructure: The deployment of LiDAR for intelligent traffic management, public safety monitoring, urban planning, and environmental sensing presents a significant growth avenue.
- Advanced Robotics and Drones: The increasing sophistication of robots in logistics, agriculture, and domestic use, as well as the expanding applications for autonomous drones in inspection, delivery, and mapping, will drive demand for compact and performant LiDAR solutions.
- Medical and Healthcare Applications: Emerging uses in surgical robotics, patient monitoring, and diagnostic imaging could unlock niche but high-value market segments.
- Integration with 5G and AI: The synergistic combination of LiDAR data with 5G connectivity and artificial intelligence (AI) for real-time analytics and decision-making will create new opportunities for intelligent systems.
Leading Players in the All-Solid-State LiDAR Chip Market
- Velodyne Lidar
- Innoviz Technologies
- LeddarTech
- Quanergy Solutions
- Ouster
- Luminar Technologies
- RoboSense
- Aeva
Key Developments in All-Solid-State LiDAR Chip Industry
- 2023/Late 2022: Introduction of next-generation MEMS LiDAR chips with improved resolution and reduced cost by several key players, targeting broader automotive integration.
- 2023/Early 2024: Significant advancements in phased array LiDAR technology, achieving extended ranges of over 1000 meters and higher scanning speeds.
- 2024/Mid-Year: Increased strategic partnerships and investment rounds in LiDAR startups focused on solid-state solutions, with some deals valued in the hundreds of millions of dollars.
- 2024/Late Year: Unveiling of new LiDAR solutions specifically designed for industrial automation and robotics, emphasizing ruggedness and ease of integration.
- 2025/Early: Announcement of mass production readiness for certain solid-state LiDAR chips by major automotive suppliers, signaling a ramp-up in adoption.
Strategic Outlook for All-Solid-State LiDAR Chip Market
The strategic outlook for the all-solid-state LiDAR chip market remains exceptionally positive, driven by the indispensable role of advanced sensing in the future of mobility, automation, and intelligent systems. The continuous innovation in miniaturization, cost reduction, and performance enhancement, particularly in MEMS and phased array architectures, will accelerate adoption across automotive, industrial, and emerging consumer segments. Strategic partnerships between LiDAR manufacturers, automotive OEMs, and technology integrators will be crucial for driving product development and market penetration. The growing emphasis on safety regulations and the pursuit of higher levels of autonomy are powerful market catalysts. Emerging opportunities in smart cities and advanced robotics, coupled with the synergistic integration of LiDAR with 5G and AI, promise sustained high growth and significant market expansion, with projected market sizes reaching 50 billion by 2033.
All-Solid-State LiDAR Chip Segmentation
-
1. Application
- 1.1. Consumer Electronics
- 1.2. Agriculture
- 1.3. Industrial
- 1.4. Others
-
2. Types
- 2.1. Phased Array LiDAR Chip
- 2.2. MEMS LiDAR Chip
- 2.3. Others
All-Solid-State LiDAR Chip Segmentation By Geography
-
1. North America
- 1.1. United States
- 1.2. Canada
- 1.3. Mexico
-
2. South America
- 2.1. Brazil
- 2.2. Argentina
- 2.3. Rest of South America
-
3. Europe
- 3.1. United Kingdom
- 3.2. Germany
- 3.3. France
- 3.4. Italy
- 3.5. Spain
- 3.6. Russia
- 3.7. Benelux
- 3.8. Nordics
- 3.9. Rest of Europe
-
4. Middle East & Africa
- 4.1. Turkey
- 4.2. Israel
- 4.3. GCC
- 4.4. North Africa
- 4.5. South Africa
- 4.6. Rest of Middle East & Africa
-
5. Asia Pacific
- 5.1. China
- 5.2. India
- 5.3. Japan
- 5.4. South Korea
- 5.5. ASEAN
- 5.6. Oceania
- 5.7. Rest of Asia Pacific
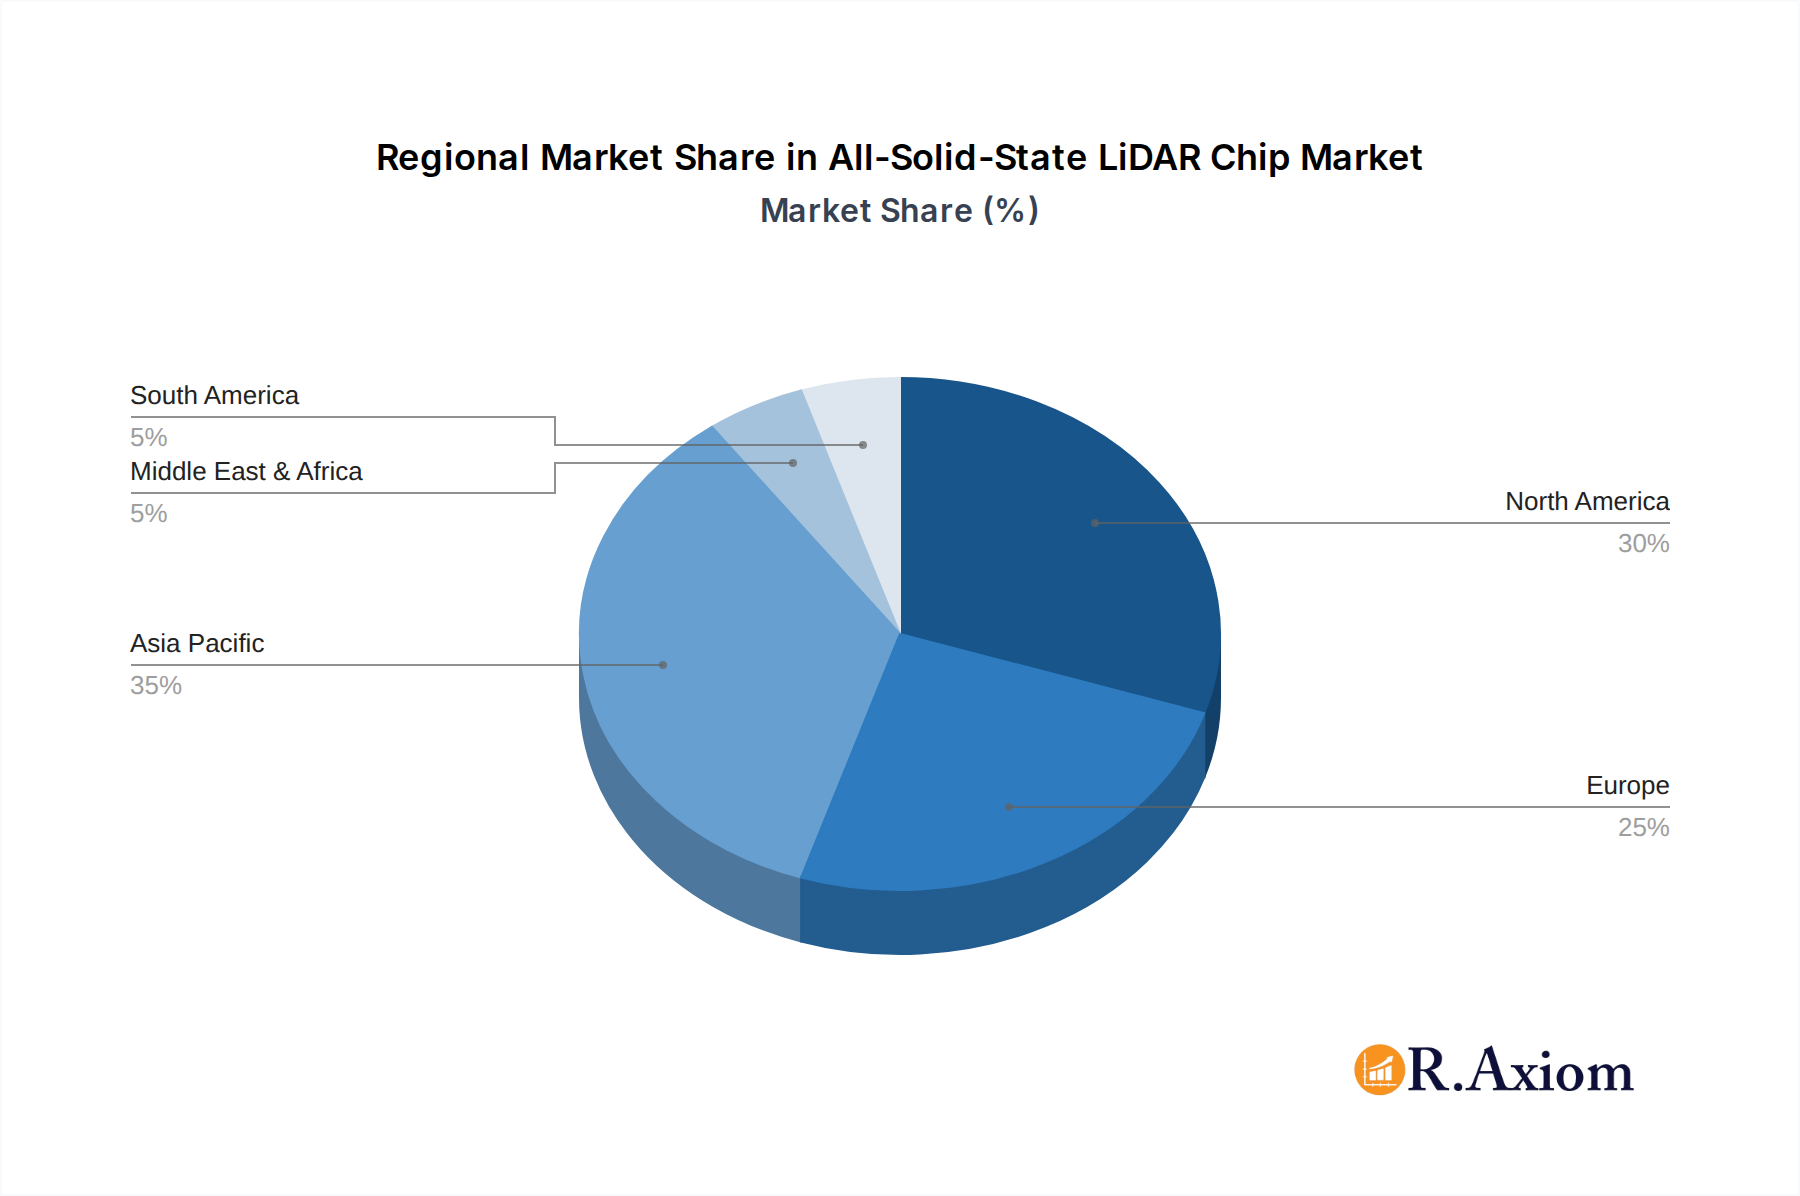
All-Solid-State LiDAR Chip Regional Market Share
Geographic Coverage of All-Solid-State LiDAR Chip
All-Solid-State LiDAR Chip REPORT HIGHLIGHTS
| Aspects | Details |
|---|---|
| Study Period | 2020-2034 |
| Base Year | 2025 |
| Estimated Year | 2026 |
| Forecast Period | 2026-2034 |
| Historical Period | 2020-2025 |
| Growth Rate | CAGR of 7.6% from 2020-2034 |
| Segmentation |
|
Table of Contents
- 1. Introduction
- 1.1. Research Scope
- 1.2. Market Segmentation
- 1.3. Research Objective
- 1.4. Definitions and Assumptions
- 2. Executive Summary
- 2.1. Market Snapshot
- 3. Market Dynamics
- 3.1. Market Drivers
- 3.2. Market Restrains
- 3.3. Market Trends
- 3.4. Market Opportunities
- 4. Market Factor Analysis
- 4.1. Porters Five Forces
- 4.1.1. Bargaining Power of Suppliers
- 4.1.2. Bargaining Power of Buyers
- 4.1.3. Threat of New Entrants
- 4.1.4. Threat of Substitutes
- 4.1.5. Competitive Rivalry
- 4.2. PESTEL analysis
- 4.3. BCG Analysis
- 4.3.1. Stars (High Growth, High Market Share)
- 4.3.2. Cash Cows (Low Growth, High Market Share)
- 4.3.3. Question Mark (High Growth, Low Market Share)
- 4.3.4. Dogs (Low Growth, Low Market Share)
- 4.4. Ansoff Matrix Analysis
- 4.5. Supply Chain Analysis
- 4.6. Regulatory Landscape
- 4.7. Current Market Potential and Opportunity Assessment (TAM–SAM–SOM Framework)
- 4.8. RAX Analyst Note
- 4.1. Porters Five Forces
- 5. Market Analysis, Insights and Forecast 2021-2033
- 5.1. Market Analysis, Insights and Forecast - by Application
- 5.1.1. Consumer Electronics
- 5.1.2. Agriculture
- 5.1.3. Industrial
- 5.1.4. Others
- 5.2. Market Analysis, Insights and Forecast - by Types
- 5.2.1. Phased Array LiDAR Chip
- 5.2.2. MEMS LiDAR Chip
- 5.2.3. Others
- 5.3. Market Analysis, Insights and Forecast - by Region
- 5.3.1. North America
- 5.3.2. South America
- 5.3.3. Europe
- 5.3.4. Middle East & Africa
- 5.3.5. Asia Pacific
- 5.1. Market Analysis, Insights and Forecast - by Application
- 6. Global All-Solid-State LiDAR Chip Analysis, Insights and Forecast, 2021-2033
- 6.1. Market Analysis, Insights and Forecast - by Application
- 6.1.1. Consumer Electronics
- 6.1.2. Agriculture
- 6.1.3. Industrial
- 6.1.4. Others
- 6.2. Market Analysis, Insights and Forecast - by Types
- 6.2.1. Phased Array LiDAR Chip
- 6.2.2. MEMS LiDAR Chip
- 6.2.3. Others
- 6.1. Market Analysis, Insights and Forecast - by Application
- 7. North America All-Solid-State LiDAR Chip Analysis, Insights and Forecast, 2020-2032
- 7.1. Market Analysis, Insights and Forecast - by Application
- 7.1.1. Consumer Electronics
- 7.1.2. Agriculture
- 7.1.3. Industrial
- 7.1.4. Others
- 7.2. Market Analysis, Insights and Forecast - by Types
- 7.2.1. Phased Array LiDAR Chip
- 7.2.2. MEMS LiDAR Chip
- 7.2.3. Others
- 7.1. Market Analysis, Insights and Forecast - by Application
- 8. South America All-Solid-State LiDAR Chip Analysis, Insights and Forecast, 2020-2032
- 8.1. Market Analysis, Insights and Forecast - by Application
- 8.1.1. Consumer Electronics
- 8.1.2. Agriculture
- 8.1.3. Industrial
- 8.1.4. Others
- 8.2. Market Analysis, Insights and Forecast - by Types
- 8.2.1. Phased Array LiDAR Chip
- 8.2.2. MEMS LiDAR Chip
- 8.2.3. Others
- 8.1. Market Analysis, Insights and Forecast - by Application
- 9. Europe All-Solid-State LiDAR Chip Analysis, Insights and Forecast, 2020-2032
- 9.1. Market Analysis, Insights and Forecast - by Application
- 9.1.1. Consumer Electronics
- 9.1.2. Agriculture
- 9.1.3. Industrial
- 9.1.4. Others
- 9.2. Market Analysis, Insights and Forecast - by Types
- 9.2.1. Phased Array LiDAR Chip
- 9.2.2. MEMS LiDAR Chip
- 9.2.3. Others
- 9.1. Market Analysis, Insights and Forecast - by Application
- 10. Middle East & Africa All-Solid-State LiDAR Chip Analysis, Insights and Forecast, 2020-2032
- 10.1. Market Analysis, Insights and Forecast - by Application
- 10.1.1. Consumer Electronics
- 10.1.2. Agriculture
- 10.1.3. Industrial
- 10.1.4. Others
- 10.2. Market Analysis, Insights and Forecast - by Types
- 10.2.1. Phased Array LiDAR Chip
- 10.2.2. MEMS LiDAR Chip
- 10.2.3. Others
- 10.1. Market Analysis, Insights and Forecast - by Application
- 11. Asia Pacific All-Solid-State LiDAR Chip Analysis, Insights and Forecast, 2020-2032
- 11.1. Market Analysis, Insights and Forecast - by Application
- 11.1.1. Consumer Electronics
- 11.1.2. Agriculture
- 11.1.3. Industrial
- 11.1.4. Others
- 11.2. Market Analysis, Insights and Forecast - by Types
- 11.2.1. Phased Array LiDAR Chip
- 11.2.2. MEMS LiDAR Chip
- 11.2.3. Others
- 11.1. Market Analysis, Insights and Forecast - by Application
- 12. Competitive Analysis
- 12.1. Company Profiles
- 12.1.1 Velodyne Lidar
- 12.1.1.1. Company Overview
- 12.1.1.2. Products
- 12.1.1.3. Company Financials
- 12.1.1.4. SWOT Analysis
- 12.1.2 Innoviz Technologies
- 12.1.2.1. Company Overview
- 12.1.2.2. Products
- 12.1.2.3. Company Financials
- 12.1.2.4. SWOT Analysis
- 12.1.3 LeddarTech
- 12.1.3.1. Company Overview
- 12.1.3.2. Products
- 12.1.3.3. Company Financials
- 12.1.3.4. SWOT Analysis
- 12.1.4 Quanergy Solutions
- 12.1.4.1. Company Overview
- 12.1.4.2. Products
- 12.1.4.3. Company Financials
- 12.1.4.4. SWOT Analysis
- 12.1.5 Ouster
- 12.1.5.1. Company Overview
- 12.1.5.2. Products
- 12.1.5.3. Company Financials
- 12.1.5.4. SWOT Analysis
- 12.1.6 Luminar Technologies
- 12.1.6.1. Company Overview
- 12.1.6.2. Products
- 12.1.6.3. Company Financials
- 12.1.6.4. SWOT Analysis
- 12.1.7 RoboSense
- 12.1.7.1. Company Overview
- 12.1.7.2. Products
- 12.1.7.3. Company Financials
- 12.1.7.4. SWOT Analysis
- 12.1.8 Aeva
- 12.1.8.1. Company Overview
- 12.1.8.2. Products
- 12.1.8.3. Company Financials
- 12.1.8.4. SWOT Analysis
- 12.1.1 Velodyne Lidar
- 12.2. Market Entropy
- 12.2.1 Company's Key Areas Served
- 12.2.2 Recent Developments
- 12.3. Company Market Share Analysis 2025
- 12.3.1 Top 5 Companies Market Share Analysis
- 12.3.2 Top 3 Companies Market Share Analysis
- 12.4. List of Potential Customers
- 13. Research Methodology
List of Figures
- Figure 1: Global All-Solid-State LiDAR Chip Revenue Breakdown (million, %) by Region 2025 & 2033
- Figure 2: Global All-Solid-State LiDAR Chip Volume Breakdown (K, %) by Region 2025 & 2033
- Figure 3: North America All-Solid-State LiDAR Chip Revenue (million), by Application 2025 & 2033
- Figure 4: North America All-Solid-State LiDAR Chip Volume (K), by Application 2025 & 2033
- Figure 5: North America All-Solid-State LiDAR Chip Revenue Share (%), by Application 2025 & 2033
- Figure 6: North America All-Solid-State LiDAR Chip Volume Share (%), by Application 2025 & 2033
- Figure 7: North America All-Solid-State LiDAR Chip Revenue (million), by Types 2025 & 2033
- Figure 8: North America All-Solid-State LiDAR Chip Volume (K), by Types 2025 & 2033
- Figure 9: North America All-Solid-State LiDAR Chip Revenue Share (%), by Types 2025 & 2033
- Figure 10: North America All-Solid-State LiDAR Chip Volume Share (%), by Types 2025 & 2033
- Figure 11: North America All-Solid-State LiDAR Chip Revenue (million), by Country 2025 & 2033
- Figure 12: North America All-Solid-State LiDAR Chip Volume (K), by Country 2025 & 2033
- Figure 13: North America All-Solid-State LiDAR Chip Revenue Share (%), by Country 2025 & 2033
- Figure 14: North America All-Solid-State LiDAR Chip Volume Share (%), by Country 2025 & 2033
- Figure 15: South America All-Solid-State LiDAR Chip Revenue (million), by Application 2025 & 2033
- Figure 16: South America All-Solid-State LiDAR Chip Volume (K), by Application 2025 & 2033
- Figure 17: South America All-Solid-State LiDAR Chip Revenue Share (%), by Application 2025 & 2033
- Figure 18: South America All-Solid-State LiDAR Chip Volume Share (%), by Application 2025 & 2033
- Figure 19: South America All-Solid-State LiDAR Chip Revenue (million), by Types 2025 & 2033
- Figure 20: South America All-Solid-State LiDAR Chip Volume (K), by Types 2025 & 2033
- Figure 21: South America All-Solid-State LiDAR Chip Revenue Share (%), by Types 2025 & 2033
- Figure 22: South America All-Solid-State LiDAR Chip Volume Share (%), by Types 2025 & 2033
- Figure 23: South America All-Solid-State LiDAR Chip Revenue (million), by Country 2025 & 2033
- Figure 24: South America All-Solid-State LiDAR Chip Volume (K), by Country 2025 & 2033
- Figure 25: South America All-Solid-State LiDAR Chip Revenue Share (%), by Country 2025 & 2033
- Figure 26: South America All-Solid-State LiDAR Chip Volume Share (%), by Country 2025 & 2033
- Figure 27: Europe All-Solid-State LiDAR Chip Revenue (million), by Application 2025 & 2033
- Figure 28: Europe All-Solid-State LiDAR Chip Volume (K), by Application 2025 & 2033
- Figure 29: Europe All-Solid-State LiDAR Chip Revenue Share (%), by Application 2025 & 2033
- Figure 30: Europe All-Solid-State LiDAR Chip Volume Share (%), by Application 2025 & 2033
- Figure 31: Europe All-Solid-State LiDAR Chip Revenue (million), by Types 2025 & 2033
- Figure 32: Europe All-Solid-State LiDAR Chip Volume (K), by Types 2025 & 2033
- Figure 33: Europe All-Solid-State LiDAR Chip Revenue Share (%), by Types 2025 & 2033
- Figure 34: Europe All-Solid-State LiDAR Chip Volume Share (%), by Types 2025 & 2033
- Figure 35: Europe All-Solid-State LiDAR Chip Revenue (million), by Country 2025 & 2033
- Figure 36: Europe All-Solid-State LiDAR Chip Volume (K), by Country 2025 & 2033
- Figure 37: Europe All-Solid-State LiDAR Chip Revenue Share (%), by Country 2025 & 2033
- Figure 38: Europe All-Solid-State LiDAR Chip Volume Share (%), by Country 2025 & 2033
- Figure 39: Middle East & Africa All-Solid-State LiDAR Chip Revenue (million), by Application 2025 & 2033
- Figure 40: Middle East & Africa All-Solid-State LiDAR Chip Volume (K), by Application 2025 & 2033
- Figure 41: Middle East & Africa All-Solid-State LiDAR Chip Revenue Share (%), by Application 2025 & 2033
- Figure 42: Middle East & Africa All-Solid-State LiDAR Chip Volume Share (%), by Application 2025 & 2033
- Figure 43: Middle East & Africa All-Solid-State LiDAR Chip Revenue (million), by Types 2025 & 2033
- Figure 44: Middle East & Africa All-Solid-State LiDAR Chip Volume (K), by Types 2025 & 2033
- Figure 45: Middle East & Africa All-Solid-State LiDAR Chip Revenue Share (%), by Types 2025 & 2033
- Figure 46: Middle East & Africa All-Solid-State LiDAR Chip Volume Share (%), by Types 2025 & 2033
- Figure 47: Middle East & Africa All-Solid-State LiDAR Chip Revenue (million), by Country 2025 & 2033
- Figure 48: Middle East & Africa All-Solid-State LiDAR Chip Volume (K), by Country 2025 & 2033
- Figure 49: Middle East & Africa All-Solid-State LiDAR Chip Revenue Share (%), by Country 2025 & 2033
- Figure 50: Middle East & Africa All-Solid-State LiDAR Chip Volume Share (%), by Country 2025 & 2033
- Figure 51: Asia Pacific All-Solid-State LiDAR Chip Revenue (million), by Application 2025 & 2033
- Figure 52: Asia Pacific All-Solid-State LiDAR Chip Volume (K), by Application 2025 & 2033
- Figure 53: Asia Pacific All-Solid-State LiDAR Chip Revenue Share (%), by Application 2025 & 2033
- Figure 54: Asia Pacific All-Solid-State LiDAR Chip Volume Share (%), by Application 2025 & 2033
- Figure 55: Asia Pacific All-Solid-State LiDAR Chip Revenue (million), by Types 2025 & 2033
- Figure 56: Asia Pacific All-Solid-State LiDAR Chip Volume (K), by Types 2025 & 2033
- Figure 57: Asia Pacific All-Solid-State LiDAR Chip Revenue Share (%), by Types 2025 & 2033
- Figure 58: Asia Pacific All-Solid-State LiDAR Chip Volume Share (%), by Types 2025 & 2033
- Figure 59: Asia Pacific All-Solid-State LiDAR Chip Revenue (million), by Country 2025 & 2033
- Figure 60: Asia Pacific All-Solid-State LiDAR Chip Volume (K), by Country 2025 & 2033
- Figure 61: Asia Pacific All-Solid-State LiDAR Chip Revenue Share (%), by Country 2025 & 2033
- Figure 62: Asia Pacific All-Solid-State LiDAR Chip Volume Share (%), by Country 2025 & 2033
List of Tables
- Table 1: Global All-Solid-State LiDAR Chip Revenue million Forecast, by Application 2020 & 2033
- Table 2: Global All-Solid-State LiDAR Chip Volume K Forecast, by Application 2020 & 2033
- Table 3: Global All-Solid-State LiDAR Chip Revenue million Forecast, by Types 2020 & 2033
- Table 4: Global All-Solid-State LiDAR Chip Volume K Forecast, by Types 2020 & 2033
- Table 5: Global All-Solid-State LiDAR Chip Revenue million Forecast, by Region 2020 & 2033
- Table 6: Global All-Solid-State LiDAR Chip Volume K Forecast, by Region 2020 & 2033
- Table 7: Global All-Solid-State LiDAR Chip Revenue million Forecast, by Application 2020 & 2033
- Table 8: Global All-Solid-State LiDAR Chip Volume K Forecast, by Application 2020 & 2033
- Table 9: Global All-Solid-State LiDAR Chip Revenue million Forecast, by Types 2020 & 2033
- Table 10: Global All-Solid-State LiDAR Chip Volume K Forecast, by Types 2020 & 2033
- Table 11: Global All-Solid-State LiDAR Chip Revenue million Forecast, by Country 2020 & 2033
- Table 12: Global All-Solid-State LiDAR Chip Volume K Forecast, by Country 2020 & 2033
- Table 13: United States All-Solid-State LiDAR Chip Revenue (million) Forecast, by Application 2020 & 2033
- Table 14: United States All-Solid-State LiDAR Chip Volume (K) Forecast, by Application 2020 & 2033
- Table 15: Canada All-Solid-State LiDAR Chip Revenue (million) Forecast, by Application 2020 & 2033
- Table 16: Canada All-Solid-State LiDAR Chip Volume (K) Forecast, by Application 2020 & 2033
- Table 17: Mexico All-Solid-State LiDAR Chip Revenue (million) Forecast, by Application 2020 & 2033
- Table 18: Mexico All-Solid-State LiDAR Chip Volume (K) Forecast, by Application 2020 & 2033
- Table 19: Global All-Solid-State LiDAR Chip Revenue million Forecast, by Application 2020 & 2033
- Table 20: Global All-Solid-State LiDAR Chip Volume K Forecast, by Application 2020 & 2033
- Table 21: Global All-Solid-State LiDAR Chip Revenue million Forecast, by Types 2020 & 2033
- Table 22: Global All-Solid-State LiDAR Chip Volume K Forecast, by Types 2020 & 2033
- Table 23: Global All-Solid-State LiDAR Chip Revenue million Forecast, by Country 2020 & 2033
- Table 24: Global All-Solid-State LiDAR Chip Volume K Forecast, by Country 2020 & 2033
- Table 25: Brazil All-Solid-State LiDAR Chip Revenue (million) Forecast, by Application 2020 & 2033
- Table 26: Brazil All-Solid-State LiDAR Chip Volume (K) Forecast, by Application 2020 & 2033
- Table 27: Argentina All-Solid-State LiDAR Chip Revenue (million) Forecast, by Application 2020 & 2033
- Table 28: Argentina All-Solid-State LiDAR Chip Volume (K) Forecast, by Application 2020 & 2033
- Table 29: Rest of South America All-Solid-State LiDAR Chip Revenue (million) Forecast, by Application 2020 & 2033
- Table 30: Rest of South America All-Solid-State LiDAR Chip Volume (K) Forecast, by Application 2020 & 2033
- Table 31: Global All-Solid-State LiDAR Chip Revenue million Forecast, by Application 2020 & 2033
- Table 32: Global All-Solid-State LiDAR Chip Volume K Forecast, by Application 2020 & 2033
- Table 33: Global All-Solid-State LiDAR Chip Revenue million Forecast, by Types 2020 & 2033
- Table 34: Global All-Solid-State LiDAR Chip Volume K Forecast, by Types 2020 & 2033
- Table 35: Global All-Solid-State LiDAR Chip Revenue million Forecast, by Country 2020 & 2033
- Table 36: Global All-Solid-State LiDAR Chip Volume K Forecast, by Country 2020 & 2033
- Table 37: United Kingdom All-Solid-State LiDAR Chip Revenue (million) Forecast, by Application 2020 & 2033
- Table 38: United Kingdom All-Solid-State LiDAR Chip Volume (K) Forecast, by Application 2020 & 2033
- Table 39: Germany All-Solid-State LiDAR Chip Revenue (million) Forecast, by Application 2020 & 2033
- Table 40: Germany All-Solid-State LiDAR Chip Volume (K) Forecast, by Application 2020 & 2033
- Table 41: France All-Solid-State LiDAR Chip Revenue (million) Forecast, by Application 2020 & 2033
- Table 42: France All-Solid-State LiDAR Chip Volume (K) Forecast, by Application 2020 & 2033
- Table 43: Italy All-Solid-State LiDAR Chip Revenue (million) Forecast, by Application 2020 & 2033
- Table 44: Italy All-Solid-State LiDAR Chip Volume (K) Forecast, by Application 2020 & 2033
- Table 45: Spain All-Solid-State LiDAR Chip Revenue (million) Forecast, by Application 2020 & 2033
- Table 46: Spain All-Solid-State LiDAR Chip Volume (K) Forecast, by Application 2020 & 2033
- Table 47: Russia All-Solid-State LiDAR Chip Revenue (million) Forecast, by Application 2020 & 2033
- Table 48: Russia All-Solid-State LiDAR Chip Volume (K) Forecast, by Application 2020 & 2033
- Table 49: Benelux All-Solid-State LiDAR Chip Revenue (million) Forecast, by Application 2020 & 2033
- Table 50: Benelux All-Solid-State LiDAR Chip Volume (K) Forecast, by Application 2020 & 2033
- Table 51: Nordics All-Solid-State LiDAR Chip Revenue (million) Forecast, by Application 2020 & 2033
- Table 52: Nordics All-Solid-State LiDAR Chip Volume (K) Forecast, by Application 2020 & 2033
- Table 53: Rest of Europe All-Solid-State LiDAR Chip Revenue (million) Forecast, by Application 2020 & 2033
- Table 54: Rest of Europe All-Solid-State LiDAR Chip Volume (K) Forecast, by Application 2020 & 2033
- Table 55: Global All-Solid-State LiDAR Chip Revenue million Forecast, by Application 2020 & 2033
- Table 56: Global All-Solid-State LiDAR Chip Volume K Forecast, by Application 2020 & 2033
- Table 57: Global All-Solid-State LiDAR Chip Revenue million Forecast, by Types 2020 & 2033
- Table 58: Global All-Solid-State LiDAR Chip Volume K Forecast, by Types 2020 & 2033
- Table 59: Global All-Solid-State LiDAR Chip Revenue million Forecast, by Country 2020 & 2033
- Table 60: Global All-Solid-State LiDAR Chip Volume K Forecast, by Country 2020 & 2033
- Table 61: Turkey All-Solid-State LiDAR Chip Revenue (million) Forecast, by Application 2020 & 2033
- Table 62: Turkey All-Solid-State LiDAR Chip Volume (K) Forecast, by Application 2020 & 2033
- Table 63: Israel All-Solid-State LiDAR Chip Revenue (million) Forecast, by Application 2020 & 2033
- Table 64: Israel All-Solid-State LiDAR Chip Volume (K) Forecast, by Application 2020 & 2033
- Table 65: GCC All-Solid-State LiDAR Chip Revenue (million) Forecast, by Application 2020 & 2033
- Table 66: GCC All-Solid-State LiDAR Chip Volume (K) Forecast, by Application 2020 & 2033
- Table 67: North Africa All-Solid-State LiDAR Chip Revenue (million) Forecast, by Application 2020 & 2033
- Table 68: North Africa All-Solid-State LiDAR Chip Volume (K) Forecast, by Application 2020 & 2033
- Table 69: South Africa All-Solid-State LiDAR Chip Revenue (million) Forecast, by Application 2020 & 2033
- Table 70: South Africa All-Solid-State LiDAR Chip Volume (K) Forecast, by Application 2020 & 2033
- Table 71: Rest of Middle East & Africa All-Solid-State LiDAR Chip Revenue (million) Forecast, by Application 2020 & 2033
- Table 72: Rest of Middle East & Africa All-Solid-State LiDAR Chip Volume (K) Forecast, by Application 2020 & 2033
- Table 73: Global All-Solid-State LiDAR Chip Revenue million Forecast, by Application 2020 & 2033
- Table 74: Global All-Solid-State LiDAR Chip Volume K Forecast, by Application 2020 & 2033
- Table 75: Global All-Solid-State LiDAR Chip Revenue million Forecast, by Types 2020 & 2033
- Table 76: Global All-Solid-State LiDAR Chip Volume K Forecast, by Types 2020 & 2033
- Table 77: Global All-Solid-State LiDAR Chip Revenue million Forecast, by Country 2020 & 2033
- Table 78: Global All-Solid-State LiDAR Chip Volume K Forecast, by Country 2020 & 2033
- Table 79: China All-Solid-State LiDAR Chip Revenue (million) Forecast, by Application 2020 & 2033
- Table 80: China All-Solid-State LiDAR Chip Volume (K) Forecast, by Application 2020 & 2033
- Table 81: India All-Solid-State LiDAR Chip Revenue (million) Forecast, by Application 2020 & 2033
- Table 82: India All-Solid-State LiDAR Chip Volume (K) Forecast, by Application 2020 & 2033
- Table 83: Japan All-Solid-State LiDAR Chip Revenue (million) Forecast, by Application 2020 & 2033
- Table 84: Japan All-Solid-State LiDAR Chip Volume (K) Forecast, by Application 2020 & 2033
- Table 85: South Korea All-Solid-State LiDAR Chip Revenue (million) Forecast, by Application 2020 & 2033
- Table 86: South Korea All-Solid-State LiDAR Chip Volume (K) Forecast, by Application 2020 & 2033
- Table 87: ASEAN All-Solid-State LiDAR Chip Revenue (million) Forecast, by Application 2020 & 2033
- Table 88: ASEAN All-Solid-State LiDAR Chip Volume (K) Forecast, by Application 2020 & 2033
- Table 89: Oceania All-Solid-State LiDAR Chip Revenue (million) Forecast, by Application 2020 & 2033
- Table 90: Oceania All-Solid-State LiDAR Chip Volume (K) Forecast, by Application 2020 & 2033
- Table 91: Rest of Asia Pacific All-Solid-State LiDAR Chip Revenue (million) Forecast, by Application 2020 & 2033
- Table 92: Rest of Asia Pacific All-Solid-State LiDAR Chip Volume (K) Forecast, by Application 2020 & 2033
Frequently Asked Questions
1. What is the projected Compound Annual Growth Rate (CAGR) of the All-Solid-State LiDAR Chip?
The projected CAGR is approximately 7.6%.
2. Which companies are prominent players in the All-Solid-State LiDAR Chip?
Key companies in the market include Velodyne Lidar, Innoviz Technologies, LeddarTech, Quanergy Solutions, Ouster, Luminar Technologies, RoboSense, Aeva.
3. What are the main segments of the All-Solid-State LiDAR Chip?
The market segments include Application, Types.
4. Can you provide details about the market size?
The market size is estimated to be USD 1582.7 million as of 2022.
5. What are some drivers contributing to market growth?
N/A
6. What are the notable trends driving market growth?
N/A
7. Are there any restraints impacting market growth?
N/A
8. Can you provide examples of recent developments in the market?
N/A
9. What pricing options are available for accessing the report?
Pricing options include single-user, multi-user, and enterprise licenses priced at USD 3950.00, USD 5925.00, and USD 7900.00 respectively.
10. Is the market size provided in terms of value or volume?
The market size is provided in terms of value, measured in million and volume, measured in K.
11. Are there any specific market keywords associated with the report?
Yes, the market keyword associated with the report is "All-Solid-State LiDAR Chip," which aids in identifying and referencing the specific market segment covered.
12. How do I determine which pricing option suits my needs best?
The pricing options vary based on user requirements and access needs. Individual users may opt for single-user licenses, while businesses requiring broader access may choose multi-user or enterprise licenses for cost-effective access to the report.
13. Are there any additional resources or data provided in the All-Solid-State LiDAR Chip report?
While the report offers comprehensive insights, it's advisable to review the specific contents or supplementary materials provided to ascertain if additional resources or data are available.
14. How can I stay updated on further developments or reports in the All-Solid-State LiDAR Chip?
To stay informed about further developments, trends, and reports in the All-Solid-State LiDAR Chip, consider subscribing to industry newsletters, following relevant companies and organizations, or regularly checking reputable industry news sources and publications.
Methodology
Step 1 - Identification of Relevant Samples Size from Population Database


Step 2 - Approaches for Defining Global Market Size (Value, Volume* & Price*)

Note*: In applicable scenarios
Step 3 - Data Sources
Primary Research
- Web Analytics
- Survey Reports
- Research Institute
- Latest Research Reports
- Opinion Leaders
Secondary Research
- Annual Reports
- White Paper
- Latest Press Release
- Industry Association
- Paid Database
- Investor Presentations

Step 4 - Data Triangulation
Involves using different sources of information in order to increase the validity of a study
These sources are likely to be stakeholders in a program - participants, other researchers, program staff, other community members, and so on.
Then we put all data in single framework & apply various statistical tools to find out the dynamic on the market.
During the analysis stage, feedback from the stakeholder groups would be compared to determine areas of agreement as well as areas of divergence