

Key Insights
The global all-terrain crane market is poised for significant expansion, driven by a robust Compound Annual Growth Rate (CAGR) of 5.65% between 2025 and 2033. This growth is underpinned by escalating global infrastructure development, particularly in rapidly expanding Asian-Pacific economies, which necessitates versatile and efficient lifting solutions. Increased adoption across construction, industrial projects, and utility maintenance further propels market expansion. Technological advancements focusing on enhanced crane capacity, improved safety, and greater fuel efficiency are also positively shaping market dynamics. The market is segmented by lifting capacity, including less than 200 tons, 200-500 tons, and over 500 tons, to address diverse project requirements. While the construction sector currently represents the largest application segment, industrial and utility sectors, especially with the surge in renewable energy infrastructure, offer substantial future growth potential. The market size is projected to reach 18.32 billion by 2025.
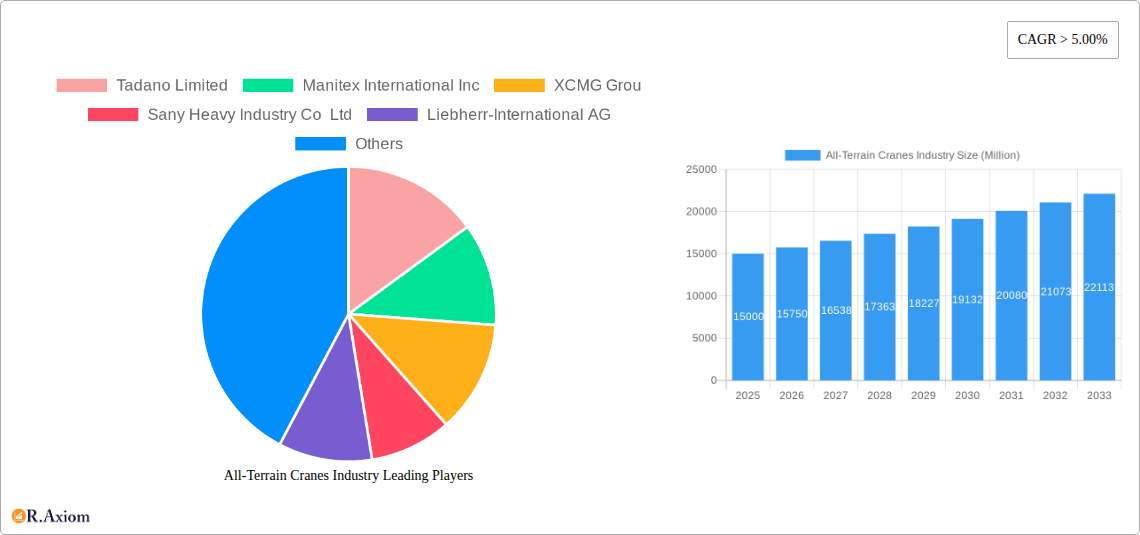
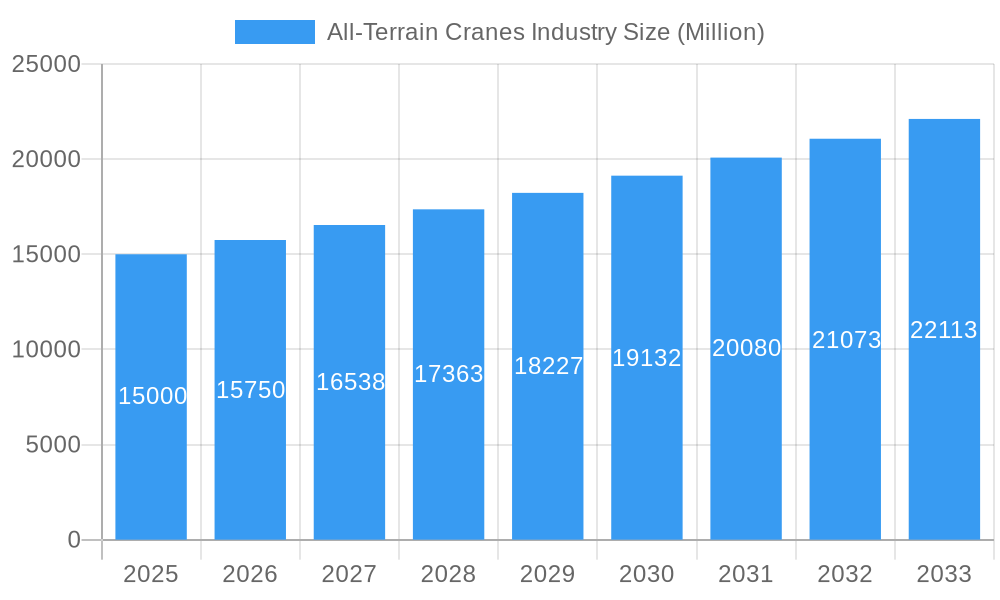
All-Terrain Cranes Industry Market Size (In Billion)
Despite the optimistic outlook, the market confronts challenges including raw material price volatility, particularly for steel, impacting manufacturing costs. Stringent environmental regulations regarding emissions and noise pollution demand continuous innovation for compliance. Market concentration among key players such as Tadano, Manitowoc, and Liebherr intensifies competition. Nevertheless, sustained global infrastructure investment and ongoing technological advancements in automation and remote operation will continue to fuel market growth across all segments. The Asia-Pacific region is anticipated to lead this expansion.
All-Terrain Cranes Industry Company Market Share
All-Terrain Cranes Industry Market Report: 2019-2033
This comprehensive report provides a detailed analysis of the global all-terrain cranes industry, offering invaluable insights for stakeholders seeking to understand market dynamics, competitive landscapes, and future growth prospects. The study period covers 2019-2033, with a base year of 2025 and a forecast period of 2025-2033. The report leverages extensive primary and secondary research to deliver actionable intelligence, covering key market segments, leading players, and emerging trends. The total market size is estimated at XX Million in 2025 and is projected to reach XX Million by 2033.
All-Terrain Cranes Industry Market Concentration & Innovation
This section analyzes the competitive landscape of the all-terrain crane industry, examining market concentration, innovation drivers, regulatory frameworks, product substitutes, end-user trends, and mergers & acquisitions (M&A) activities.
The industry exhibits a moderately concentrated structure, with several major players controlling a significant market share. Tadano Limited, Manitowoc, Liebherr-International AG, and XCMG Group are among the leading companies, each holding a substantial portion of the market. However, a number of smaller players contribute to the overall market dynamism. Market share data for 2024 indicates that the top 5 players hold approximately XX% of the market.
Innovation Drivers:
- Technological advancements in crane design and control systems.
- Demand for enhanced safety features and automation.
- Focus on improving fuel efficiency and reducing emissions.
Regulatory Frameworks:
- Stringent safety regulations and emission standards across various regions.
- Government initiatives to promote infrastructure development.
M&A Activities:
- The industry witnesses occasional M&A activity, driven by consolidation efforts and expansion strategies. For instance, the acquisition of Steelweld by Terex in 2022 illustrates this trend. The total value of M&A deals in the industry during the period 2019-2024 is estimated at around XX Million.
Product Substitutes:
- Other types of lifting equipment such as mobile cranes and crawler cranes offer substitutes in specific applications.
End-User Trends:
- Growth in construction, industrial, and utility sectors driving demand for all-terrain cranes.
All-Terrain Cranes Industry Industry Trends & Insights
The all-terrain crane market demonstrates robust growth, primarily driven by increasing infrastructure spending globally, particularly in emerging economies. The construction sector remains the largest end-user, accounting for approximately XX% of total market demand. Technological advancements, such as improved lifting capacities, enhanced safety features, and automation, are also contributing to market expansion. The market is witnessing a growing preference for environmentally friendly cranes with reduced emissions, reflecting evolving sustainability concerns.
The compound annual growth rate (CAGR) for the all-terrain crane market during the forecast period (2025-2033) is estimated at XX%, indicating significant growth potential. Market penetration is expected to increase as adoption rates rise in new geographic regions. Competitive dynamics are intensifying with major players focusing on product innovation, strategic partnerships, and expansion into new markets. The introduction of electric and hybrid all-terrain cranes is expected to disrupt the market further, presenting both opportunities and challenges for existing players. The increasing demand for heavy-duty cranes in infrastructure mega projects further fuels market expansion.
Dominant Markets & Segments in All-Terrain Cranes Industry
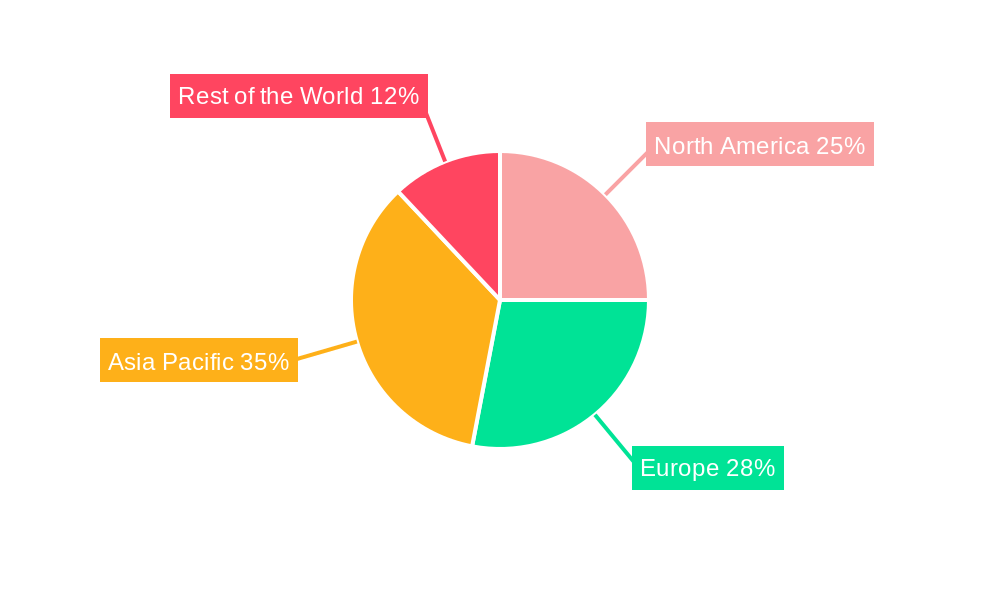
The Asia-Pacific region holds the largest market share in the all-terrain crane industry, driven by rapid infrastructure development and industrialization. China, India, and other Southeast Asian nations are key contributors to regional growth. Within capacity segments, the "200-500 tons" category currently represents the largest segment by revenue, reflecting the versatility and demand for cranes within this capacity range.
Key Drivers by Region:
- Asia-Pacific: Rapid urbanization, infrastructure investments, and industrial growth.
- North America: Focus on infrastructure projects and industrial expansion.
- Europe: Stable construction sector and increasing demand for specialized cranes.
Key Drivers by Capacity Type:
- 200-500 Tons: High demand across various applications such as construction and industrial projects.
- Less than 200 Tons: Cost-effectiveness and suitability for smaller projects.
- More than 500 Tons: Specialized applications involving large infrastructure projects.
Key Drivers by Application:
- Construction: Highest market share due to widespread use in building and infrastructure projects.
- Industries: Demand from manufacturing and industrial plants.
- Utilities: Applications in power transmission and energy infrastructure development.
All-Terrain Cranes Industry Product Developments
Recent product innovations focus on enhanced safety features, improved lifting capacities, and increased fuel efficiency. Manufacturers are increasingly incorporating advanced technologies, such as telematics and remote diagnostics, to improve operational efficiency and reduce downtime. The development of electric and hybrid all-terrain cranes is gaining traction, driven by environmental concerns and the push toward sustainable construction practices. These innovations help manufacturers cater to the evolving needs of various industries and maintain a competitive edge. For example, Manitowoc's launch of new Grove GMK models highlights the ongoing commitment to product advancement in the all-terrain crane sector.
Report Scope & Segmentation Analysis
This report segments the all-terrain crane market by capacity type (Less than 200 Tons, 200 - 500 Tons, More than 500 Tons) and application (Construction, Industries, Utilities, Others). Each segment presents unique growth trajectories and competitive landscapes. The “200-500 Tons” capacity segment is anticipated to witness the fastest growth rate due to its versatility and widespread application. Construction remains the dominant application segment, expected to maintain its leadership position throughout the forecast period. The Utilities segment is projected to experience significant growth driven by investments in renewable energy infrastructure. The "Others" segment includes niche applications, which collectively show moderate growth potential.
Key Drivers of All-Terrain Cranes Industry Growth
The growth of the all-terrain crane industry is propelled by several factors:
- Infrastructure Development: Government investments in infrastructure projects globally are driving demand for these versatile cranes.
- Industrial Expansion: Growth in manufacturing and industrial sectors increases the need for heavy lifting equipment.
- Technological Advancements: Improvements in crane design, safety features, and fuel efficiency enhance the appeal of all-terrain cranes.
- Rising Construction Activity: The global construction industry is a significant driver of demand for all-terrain cranes.
Challenges in the All-Terrain Cranes Industry Sector
The all-terrain crane industry faces several challenges, including:
- High Initial Investment Costs: The purchase and maintenance of all-terrain cranes are expensive, limiting entry into the market for smaller companies.
- Supply Chain Disruptions: Global supply chain issues can impact the availability of components and materials, leading to production delays.
- Intense Competition: The presence of several established players creates intense competition, requiring companies to differentiate their offerings.
- Stringent Safety Regulations: Compliance with safety standards requires significant investment in safety technologies, adding to operational costs.
Emerging Opportunities in All-Terrain Cranes Industry
The industry presents several emerging opportunities:
- Electric and Hybrid Cranes: The increasing demand for eco-friendly equipment presents a significant opportunity for manufacturers to develop and market electric and hybrid all-terrain cranes.
- Smart Crane Technology: The integration of smart technologies, such as telematics and remote diagnostics, enhances operational efficiency and improves maintenance management.
- Specialized Applications: Demand for all-terrain cranes with specialized features for specific industries (e.g., wind energy, mining) opens up niche market opportunities.
- Emerging Markets: Developing economies with growing infrastructure projects offer promising expansion opportunities.
Leading Players in the All-Terrain Cranes Industry Market
- Tadano Limited
- Manitex International Inc
- XCMG Group
- Sany Heavy Industry Co Ltd
- Liebherr-International AG
- Manitowoc
- Hitachi Sumitomo Heavy Industries Construction Cranes Co Ltd
- Zoomlion Heavy Industry Science and Technology Co Ltd
- Kobelco Cranes Co Ltd
- Terex Corporation
Key Developments in All-Terrain Cranes Industry Industry
- October 2021: Manitowoc launched two new all-terrain cranes, the Grove GMK5120L and the Grove GMK5150XL.
- February 2022: Norwalk announced its Series B investment in Viatec, Inc., focusing on electrification in utility fleets.
- April 2022: Terex acquired Steelweld, boosting its fabrication capabilities.
Strategic Outlook for All-Terrain Cranes Industry Market
The all-terrain crane market is poised for continued growth, driven by increasing infrastructure spending and technological advancements. The shift toward sustainable solutions, such as electric and hybrid cranes, will shape future market dynamics. Opportunities exist for companies that can offer innovative solutions, cater to specific market niches, and efficiently manage supply chain challenges. The focus on safety, efficiency, and sustainability will continue to influence product development and market competition, creating a dynamic and promising landscape for industry players.
All-Terrain Cranes Industry Segmentation
-
1. Capacity Type
- 1.1. Less than 200 Tons
- 1.2. 200 - 500 Tons
- 1.3. More than 500 Tons
-
2. Application
- 2.1. Construction
- 2.2. Industries
- 2.3. Utilities
- 2.4. Others
All-Terrain Cranes Industry Segmentation By Geography
-
1. North America
- 1.1. United States
- 1.2. Canada
- 1.3. Rest of North America
-
2. Europe
- 2.1. Germany
- 2.2. United Kingdom
- 2.3. France
- 2.4. Rest of Europe
-
3. Asia Pacific
- 3.1. India
- 3.2. China
- 3.3. Japan
- 3.4. South Korea
- 3.5. Rest of Asia Pacific
-
4. Rest of the World
- 4.1. Brazil
- 4.2. Mexico
- 4.3. United Arab Emirates
- 4.4. Other Countries
All-Terrain Cranes Industry Regional Market Share
Geographic Coverage of All-Terrain Cranes Industry
All-Terrain Cranes Industry REPORT HIGHLIGHTS
| Aspects | Details |
|---|---|
| Study Period | 2020-2034 |
| Base Year | 2025 |
| Estimated Year | 2026 |
| Forecast Period | 2026-2034 |
| Historical Period | 2020-2025 |
| Growth Rate | CAGR of 5.65% from 2020-2034 |
| Segmentation |
|
Table of Contents
- 1. Introduction
- 1.1. Research Scope
- 1.2. Market Segmentation
- 1.3. Research Objective
- 1.4. Definitions and Assumptions
- 2. Executive Summary
- 2.1. Market Snapshot
- 3. Market Dynamics
- 3.1. Market Drivers
- 3.2. Market Restrains
- 3.3. Market Trends
- 3.4. Market Opportunities
- 4. Market Factor Analysis
- 4.1. Porters Five Forces
- 4.1.1. Bargaining Power of Suppliers
- 4.1.2. Bargaining Power of Buyers
- 4.1.3. Threat of New Entrants
- 4.1.4. Threat of Substitutes
- 4.1.5. Competitive Rivalry
- 4.2. PESTEL analysis
- 4.3. BCG Analysis
- 4.3.1. Stars (High Growth, High Market Share)
- 4.3.2. Cash Cows (Low Growth, High Market Share)
- 4.3.3. Question Mark (High Growth, Low Market Share)
- 4.3.4. Dogs (Low Growth, Low Market Share)
- 4.4. Ansoff Matrix Analysis
- 4.5. Supply Chain Analysis
- 4.6. Regulatory Landscape
- 4.7. Current Market Potential and Opportunity Assessment (TAM–SAM–SOM Framework)
- 4.8. RAX Analyst Note
- 4.1. Porters Five Forces
- 5. Market Analysis, Insights and Forecast 2021-2033
- 5.1. Market Analysis, Insights and Forecast - by Capacity Type
- 5.1.1. Less than 200 Tons
- 5.1.2. 200 - 500 Tons
- 5.1.3. More than 500 Tons
- 5.2. Market Analysis, Insights and Forecast - by Application
- 5.2.1. Construction
- 5.2.2. Industries
- 5.2.3. Utilities
- 5.2.4. Others
- 5.3. Market Analysis, Insights and Forecast - by Region
- 5.3.1. North America
- 5.3.2. Europe
- 5.3.3. Asia Pacific
- 5.3.4. Rest of the World
- 5.1. Market Analysis, Insights and Forecast - by Capacity Type
- 6. Global All-Terrain Cranes Industry Analysis, Insights and Forecast, 2021-2033
- 6.1. Market Analysis, Insights and Forecast - by Capacity Type
- 6.1.1. Less than 200 Tons
- 6.1.2. 200 - 500 Tons
- 6.1.3. More than 500 Tons
- 6.2. Market Analysis, Insights and Forecast - by Application
- 6.2.1. Construction
- 6.2.2. Industries
- 6.2.3. Utilities
- 6.2.4. Others
- 6.1. Market Analysis, Insights and Forecast - by Capacity Type
- 7. North America All-Terrain Cranes Industry Analysis, Insights and Forecast, 2020-2032
- 7.1. Market Analysis, Insights and Forecast - by Capacity Type
- 7.1.1. Less than 200 Tons
- 7.1.2. 200 - 500 Tons
- 7.1.3. More than 500 Tons
- 7.2. Market Analysis, Insights and Forecast - by Application
- 7.2.1. Construction
- 7.2.2. Industries
- 7.2.3. Utilities
- 7.2.4. Others
- 7.1. Market Analysis, Insights and Forecast - by Capacity Type
- 8. Europe All-Terrain Cranes Industry Analysis, Insights and Forecast, 2020-2032
- 8.1. Market Analysis, Insights and Forecast - by Capacity Type
- 8.1.1. Less than 200 Tons
- 8.1.2. 200 - 500 Tons
- 8.1.3. More than 500 Tons
- 8.2. Market Analysis, Insights and Forecast - by Application
- 8.2.1. Construction
- 8.2.2. Industries
- 8.2.3. Utilities
- 8.2.4. Others
- 8.1. Market Analysis, Insights and Forecast - by Capacity Type
- 9. Asia Pacific All-Terrain Cranes Industry Analysis, Insights and Forecast, 2020-2032
- 9.1. Market Analysis, Insights and Forecast - by Capacity Type
- 9.1.1. Less than 200 Tons
- 9.1.2. 200 - 500 Tons
- 9.1.3. More than 500 Tons
- 9.2. Market Analysis, Insights and Forecast - by Application
- 9.2.1. Construction
- 9.2.2. Industries
- 9.2.3. Utilities
- 9.2.4. Others
- 9.1. Market Analysis, Insights and Forecast - by Capacity Type
- 10. Rest of the World All-Terrain Cranes Industry Analysis, Insights and Forecast, 2020-2032
- 10.1. Market Analysis, Insights and Forecast - by Capacity Type
- 10.1.1. Less than 200 Tons
- 10.1.2. 200 - 500 Tons
- 10.1.3. More than 500 Tons
- 10.2. Market Analysis, Insights and Forecast - by Application
- 10.2.1. Construction
- 10.2.2. Industries
- 10.2.3. Utilities
- 10.2.4. Others
- 10.1. Market Analysis, Insights and Forecast - by Capacity Type
- 11. Competitive Analysis
- 11.1. Company Profiles
- 11.1.1 Tadano Limited
- 11.1.1.1. Company Overview
- 11.1.1.2. Products
- 11.1.1.3. Company Financials
- 11.1.1.4. SWOT Analysis
- 11.1.2 Manitex International Inc
- 11.1.2.1. Company Overview
- 11.1.2.2. Products
- 11.1.2.3. Company Financials
- 11.1.2.4. SWOT Analysis
- 11.1.3 XCMG Grou
- 11.1.3.1. Company Overview
- 11.1.3.2. Products
- 11.1.3.3. Company Financials
- 11.1.3.4. SWOT Analysis
- 11.1.4 Sany Heavy Industry Co Ltd
- 11.1.4.1. Company Overview
- 11.1.4.2. Products
- 11.1.4.3. Company Financials
- 11.1.4.4. SWOT Analysis
- 11.1.5 Liebherr-International AG
- 11.1.5.1. Company Overview
- 11.1.5.2. Products
- 11.1.5.3. Company Financials
- 11.1.5.4. SWOT Analysis
- 11.1.6 Manitowoc
- 11.1.6.1. Company Overview
- 11.1.6.2. Products
- 11.1.6.3. Company Financials
- 11.1.6.4. SWOT Analysis
- 11.1.7 Hitachi Sumitomo Heavy Industries Construction Cranes Co Ltd
- 11.1.7.1. Company Overview
- 11.1.7.2. Products
- 11.1.7.3. Company Financials
- 11.1.7.4. SWOT Analysis
- 11.1.8 Zoomlion Heavy Industry Science and Technology Co Ltd
- 11.1.8.1. Company Overview
- 11.1.8.2. Products
- 11.1.8.3. Company Financials
- 11.1.8.4. SWOT Analysis
- 11.1.9 Kobelco Cranes Co Ltd
- 11.1.9.1. Company Overview
- 11.1.9.2. Products
- 11.1.9.3. Company Financials
- 11.1.9.4. SWOT Analysis
- 11.1.10 Terex Corporation
- 11.1.10.1. Company Overview
- 11.1.10.2. Products
- 11.1.10.3. Company Financials
- 11.1.10.4. SWOT Analysis
- 11.1.1 Tadano Limited
- 11.2. Market Entropy
- 11.2.1 Company's Key Areas Served
- 11.2.2 Recent Developments
- 11.3. Company Market Share Analysis 2025
- 11.3.1 Top 5 Companies Market Share Analysis
- 11.3.2 Top 3 Companies Market Share Analysis
- 11.4. List of Potential Customers
- 12. Research Methodology
List of Figures
- Figure 1: Global All-Terrain Cranes Industry Revenue Breakdown (billion, %) by Region 2025 & 2033
- Figure 2: North America All-Terrain Cranes Industry Revenue (billion), by Capacity Type 2025 & 2033
- Figure 3: North America All-Terrain Cranes Industry Revenue Share (%), by Capacity Type 2025 & 2033
- Figure 4: North America All-Terrain Cranes Industry Revenue (billion), by Application 2025 & 2033
- Figure 5: North America All-Terrain Cranes Industry Revenue Share (%), by Application 2025 & 2033
- Figure 6: North America All-Terrain Cranes Industry Revenue (billion), by Country 2025 & 2033
- Figure 7: North America All-Terrain Cranes Industry Revenue Share (%), by Country 2025 & 2033
- Figure 8: Europe All-Terrain Cranes Industry Revenue (billion), by Capacity Type 2025 & 2033
- Figure 9: Europe All-Terrain Cranes Industry Revenue Share (%), by Capacity Type 2025 & 2033
- Figure 10: Europe All-Terrain Cranes Industry Revenue (billion), by Application 2025 & 2033
- Figure 11: Europe All-Terrain Cranes Industry Revenue Share (%), by Application 2025 & 2033
- Figure 12: Europe All-Terrain Cranes Industry Revenue (billion), by Country 2025 & 2033
- Figure 13: Europe All-Terrain Cranes Industry Revenue Share (%), by Country 2025 & 2033
- Figure 14: Asia Pacific All-Terrain Cranes Industry Revenue (billion), by Capacity Type 2025 & 2033
- Figure 15: Asia Pacific All-Terrain Cranes Industry Revenue Share (%), by Capacity Type 2025 & 2033
- Figure 16: Asia Pacific All-Terrain Cranes Industry Revenue (billion), by Application 2025 & 2033
- Figure 17: Asia Pacific All-Terrain Cranes Industry Revenue Share (%), by Application 2025 & 2033
- Figure 18: Asia Pacific All-Terrain Cranes Industry Revenue (billion), by Country 2025 & 2033
- Figure 19: Asia Pacific All-Terrain Cranes Industry Revenue Share (%), by Country 2025 & 2033
- Figure 20: Rest of the World All-Terrain Cranes Industry Revenue (billion), by Capacity Type 2025 & 2033
- Figure 21: Rest of the World All-Terrain Cranes Industry Revenue Share (%), by Capacity Type 2025 & 2033
- Figure 22: Rest of the World All-Terrain Cranes Industry Revenue (billion), by Application 2025 & 2033
- Figure 23: Rest of the World All-Terrain Cranes Industry Revenue Share (%), by Application 2025 & 2033
- Figure 24: Rest of the World All-Terrain Cranes Industry Revenue (billion), by Country 2025 & 2033
- Figure 25: Rest of the World All-Terrain Cranes Industry Revenue Share (%), by Country 2025 & 2033
List of Tables
- Table 1: Global All-Terrain Cranes Industry Revenue billion Forecast, by Capacity Type 2020 & 2033
- Table 2: Global All-Terrain Cranes Industry Revenue billion Forecast, by Application 2020 & 2033
- Table 3: Global All-Terrain Cranes Industry Revenue billion Forecast, by Region 2020 & 2033
- Table 4: Global All-Terrain Cranes Industry Revenue billion Forecast, by Capacity Type 2020 & 2033
- Table 5: Global All-Terrain Cranes Industry Revenue billion Forecast, by Application 2020 & 2033
- Table 6: Global All-Terrain Cranes Industry Revenue billion Forecast, by Country 2020 & 2033
- Table 7: United States All-Terrain Cranes Industry Revenue (billion) Forecast, by Application 2020 & 2033
- Table 8: Canada All-Terrain Cranes Industry Revenue (billion) Forecast, by Application 2020 & 2033
- Table 9: Rest of North America All-Terrain Cranes Industry Revenue (billion) Forecast, by Application 2020 & 2033
- Table 10: Global All-Terrain Cranes Industry Revenue billion Forecast, by Capacity Type 2020 & 2033
- Table 11: Global All-Terrain Cranes Industry Revenue billion Forecast, by Application 2020 & 2033
- Table 12: Global All-Terrain Cranes Industry Revenue billion Forecast, by Country 2020 & 2033
- Table 13: Germany All-Terrain Cranes Industry Revenue (billion) Forecast, by Application 2020 & 2033
- Table 14: United Kingdom All-Terrain Cranes Industry Revenue (billion) Forecast, by Application 2020 & 2033
- Table 15: France All-Terrain Cranes Industry Revenue (billion) Forecast, by Application 2020 & 2033
- Table 16: Rest of Europe All-Terrain Cranes Industry Revenue (billion) Forecast, by Application 2020 & 2033
- Table 17: Global All-Terrain Cranes Industry Revenue billion Forecast, by Capacity Type 2020 & 2033
- Table 18: Global All-Terrain Cranes Industry Revenue billion Forecast, by Application 2020 & 2033
- Table 19: Global All-Terrain Cranes Industry Revenue billion Forecast, by Country 2020 & 2033
- Table 20: India All-Terrain Cranes Industry Revenue (billion) Forecast, by Application 2020 & 2033
- Table 21: China All-Terrain Cranes Industry Revenue (billion) Forecast, by Application 2020 & 2033
- Table 22: Japan All-Terrain Cranes Industry Revenue (billion) Forecast, by Application 2020 & 2033
- Table 23: South Korea All-Terrain Cranes Industry Revenue (billion) Forecast, by Application 2020 & 2033
- Table 24: Rest of Asia Pacific All-Terrain Cranes Industry Revenue (billion) Forecast, by Application 2020 & 2033
- Table 25: Global All-Terrain Cranes Industry Revenue billion Forecast, by Capacity Type 2020 & 2033
- Table 26: Global All-Terrain Cranes Industry Revenue billion Forecast, by Application 2020 & 2033
- Table 27: Global All-Terrain Cranes Industry Revenue billion Forecast, by Country 2020 & 2033
- Table 28: Brazil All-Terrain Cranes Industry Revenue (billion) Forecast, by Application 2020 & 2033
- Table 29: Mexico All-Terrain Cranes Industry Revenue (billion) Forecast, by Application 2020 & 2033
- Table 30: United Arab Emirates All-Terrain Cranes Industry Revenue (billion) Forecast, by Application 2020 & 2033
- Table 31: Other Countries All-Terrain Cranes Industry Revenue (billion) Forecast, by Application 2020 & 2033
Frequently Asked Questions
1. What is the projected Compound Annual Growth Rate (CAGR) of the All-Terrain Cranes Industry?
The projected CAGR is approximately 5.65%.
2. Which companies are prominent players in the All-Terrain Cranes Industry?
Key companies in the market include Tadano Limited, Manitex International Inc, XCMG Grou, Sany Heavy Industry Co Ltd, Liebherr-International AG, Manitowoc, Hitachi Sumitomo Heavy Industries Construction Cranes Co Ltd, Zoomlion Heavy Industry Science and Technology Co Ltd, Kobelco Cranes Co Ltd, Terex Corporation.
3. What are the main segments of the All-Terrain Cranes Industry?
The market segments include Capacity Type, Application.
4. Can you provide details about the market size?
The market size is estimated to be USD 18.32 billion as of 2022.
5. What are some drivers contributing to market growth?
Rise in demand for Electric Vehicles.
6. What are the notable trends driving market growth?
Construction is Driving the All -Terrain Crane Market.
7. Are there any restraints impacting market growth?
High Cost Associated With Product.
8. Can you provide examples of recent developments in the market?
In April 2022, Terex announced the acquisition of Steelweld, a manufacturer of heavy fabrications based in Northern Ireland. The purchase of Steelweld supports Materials Processing's growth strategy by increasing fabrication capabilities in Northern Ireland.
9. What pricing options are available for accessing the report?
Pricing options include single-user, multi-user, and enterprise licenses priced at USD 4750, USD 5250, and USD 8750 respectively.
10. Is the market size provided in terms of value or volume?
The market size is provided in terms of value, measured in billion.
11. Are there any specific market keywords associated with the report?
Yes, the market keyword associated with the report is "All-Terrain Cranes Industry," which aids in identifying and referencing the specific market segment covered.
12. How do I determine which pricing option suits my needs best?
The pricing options vary based on user requirements and access needs. Individual users may opt for single-user licenses, while businesses requiring broader access may choose multi-user or enterprise licenses for cost-effective access to the report.
13. Are there any additional resources or data provided in the All-Terrain Cranes Industry report?
While the report offers comprehensive insights, it's advisable to review the specific contents or supplementary materials provided to ascertain if additional resources or data are available.
14. How can I stay updated on further developments or reports in the All-Terrain Cranes Industry?
To stay informed about further developments, trends, and reports in the All-Terrain Cranes Industry, consider subscribing to industry newsletters, following relevant companies and organizations, or regularly checking reputable industry news sources and publications.
Methodology
Step 1 - Identification of Relevant Samples Size from Population Database


Step 2 - Approaches for Defining Global Market Size (Value, Volume* & Price*)

Note*: In applicable scenarios
Step 3 - Data Sources
Primary Research
- Web Analytics
- Survey Reports
- Research Institute
- Latest Research Reports
- Opinion Leaders
Secondary Research
- Annual Reports
- White Paper
- Latest Press Release
- Industry Association
- Paid Database
- Investor Presentations

Step 4 - Data Triangulation
Involves using different sources of information in order to increase the validity of a study
These sources are likely to be stakeholders in a program - participants, other researchers, program staff, other community members, and so on.
Then we put all data in single framework & apply various statistical tools to find out the dynamic on the market.
During the analysis stage, feedback from the stakeholder groups would be compared to determine areas of agreement as well as areas of divergence