

Key Insights
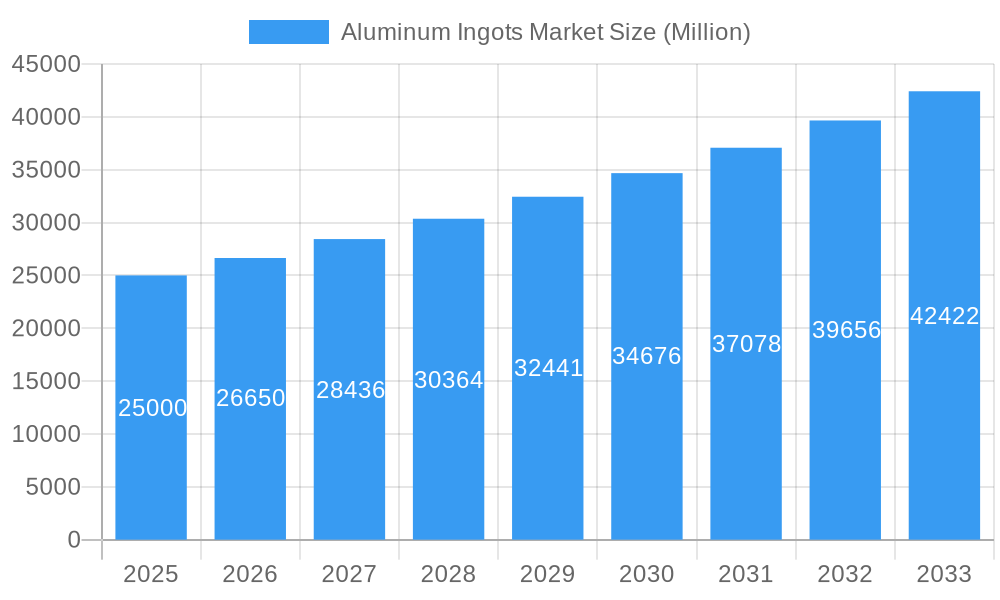
The global aluminum ingots market is experiencing robust growth, projected to maintain a Compound Annual Growth Rate (CAGR) exceeding 6.50% from 2025 to 2033. This expansion is fueled by several key drivers. The burgeoning automotive industry, particularly the rise of electric vehicles (EVs) which utilize substantial amounts of aluminum in their lightweight bodies, is a significant contributor. Similarly, the aerospace sector's demand for high-strength, lightweight materials for aircraft construction continues to propel market growth. Furthermore, the construction industry's increasing adoption of aluminum for building materials and infrastructure projects adds to the overall demand. The semiconductor and electrical and electronics sectors also represent substantial end-user markets, driven by the ongoing miniaturization and improved energy efficiency needs in electronics. While fluctuating raw material prices and global economic uncertainties present potential restraints, the long-term outlook for the aluminum ingots market remains positive, underpinned by the aforementioned growth drivers and technological advancements in aluminum production and processing.
Aluminum Ingots Market Market Size (In Billion)
The market is segmented by end-user industry, with automotive, aerospace, and building & construction leading the way. Geographical analysis reveals strong market presence in North America, Europe, and Asia-Pacific, with China, the United States, and other key economies representing significant consumption hubs. Major players like Alcoa Inc., Rusal Plc, and Norsk Hydro ASA, along with significant Chinese producers such as Chalco, dominate the market landscape, engaging in intense competition. The market's future hinges on continued innovation in aluminum alloys, increased recycling rates, and sustainable manufacturing practices, addressing environmental concerns and potentially unlocking new market segments. The strategic expansion of production capacity in key regions, coupled with strategic mergers and acquisitions among key players, is likely to shape the competitive dynamics in the coming years.
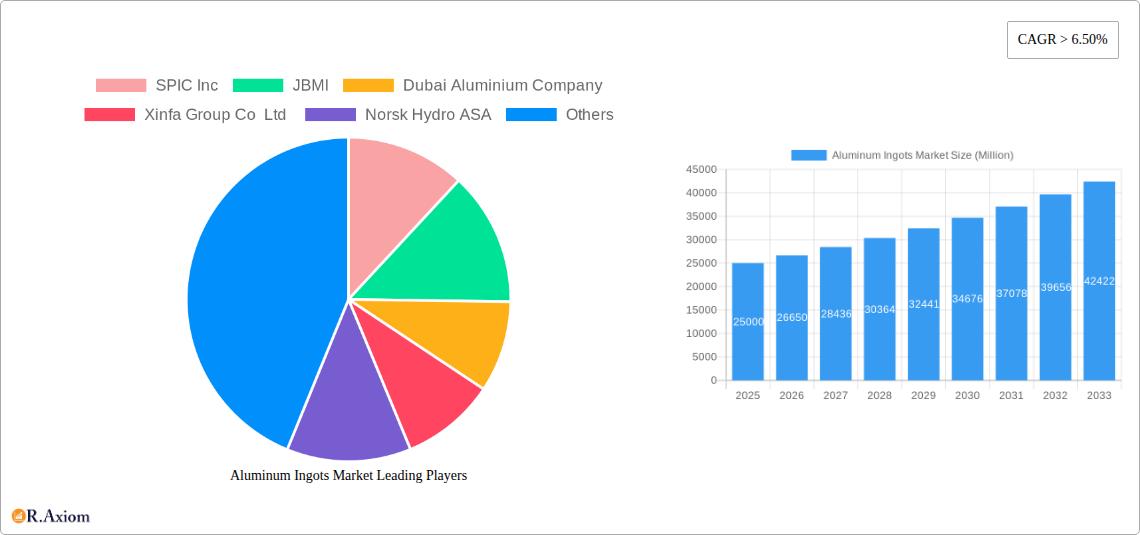
Aluminum Ingots Market Company Market Share
Aluminum Ingots Market: A Comprehensive Report (2019-2033)
This comprehensive report provides an in-depth analysis of the global aluminum ingots market, covering historical data (2019-2024), the base year (2025), and a detailed forecast (2025-2033). The report meticulously examines market dynamics, key players, emerging trends, and future growth opportunities, providing actionable insights for industry stakeholders.
Aluminum Ingots Market Market Concentration & Innovation
The aluminum ingots market exhibits a moderately concentrated structure, with a handful of major players controlling a significant market share. Companies like Alcoa Inc, RUSAL Plc, and Norsk Hydro ASA hold substantial positions, impacting pricing and innovation. Market share fluctuations are influenced by factors including raw material costs, production capacity, and global demand. The estimated market share for Alcoa Inc in 2025 is xx%, while RUSAL Plc holds approximately xx%. Innovation is primarily driven by the demand for lightweight, high-strength aluminum alloys for automotive and aerospace applications, leading to advancements in casting techniques and alloy composition. Regulatory frameworks, particularly those concerning environmental sustainability and carbon emissions, significantly influence production processes and investment decisions. The increasing focus on recycling and the development of low-carbon aluminum solutions are driving innovation in this area. Aluminum ingots face competition from other lightweight materials such as steel and composites, but their versatility and recyclability maintain their competitiveness. Mergers and acquisitions (M&A) activity within the industry, while not exceptionally frequent, often involves strategic consolidation of resources or expansion into new markets. Recent M&A deal values have ranged from xx Million to xx Million, primarily driven by the desire to enhance production capabilities and secure access to raw materials. End-user trends toward lightweighting and sustainable materials directly impact the demand for aluminum ingots, fostering continuous innovation and competition.
Aluminum Ingots Market Industry Trends & Insights
The aluminum ingots market is experiencing steady growth, driven by a burgeoning automotive sector, particularly the rising adoption of electric vehicles (EVs). The increasing demand for lightweight materials in aerospace applications also contributes significantly to the market’s expansion. The construction and infrastructure sectors play a crucial role, with aluminum’s versatility leading to its use in various building materials and components. The projected CAGR for the forecast period (2025-2033) is estimated at xx%, reflecting the sustained demand across various end-use industries. Technological disruptions, such as advancements in casting and recycling technologies, are improving efficiency and sustainability, driving both cost reductions and improved product quality. Consumer preferences for sustainable and environmentally friendly products are driving the demand for recycled aluminum ingots and incentivizing producers to adopt eco-friendly production processes. The market penetration of recycled aluminum ingots is estimated at xx% in 2025 and projected to reach xx% by 2033. Competitive dynamics are characterized by ongoing efforts to optimize production processes, enhance product quality, and expand into new geographical markets.
Dominant Markets & Segments in Aluminum Ingots Market
Leading Region/Country: Asia-Pacific is the dominant region, driven by robust industrial growth in China and India.
Dominant End-user Industry: The automotive industry is currently the largest consumer of aluminum ingots, followed by the building and construction sector.
Key Drivers for Asia-Pacific Dominance:
- Rapid industrialization and urbanization.
- Growing automotive and construction sectors.
- Supportive government policies promoting economic development.
- Abundant raw material resources.
Detailed Dominance Analysis: China's significant role in global aluminum production and its expanding automotive and construction sectors solidify its position as the leading national market. India’s rapidly growing infrastructure and manufacturing sectors further contribute to Asia-Pacific's overall dominance. The building and construction sector’s reliance on aluminum for its lightweight and durable properties ensures its sustained contribution to market growth.
Aluminum Ingots Market Product Developments
Recent innovations center around improving the mechanical properties of aluminum ingots to meet the ever-increasing demands of high-performance applications. This includes advancements in alloy compositions for improved strength-to-weight ratios and enhanced corrosion resistance. Furthermore, there's a focus on developing more sustainable production methods and reducing the carbon footprint associated with aluminum production, aligning with the growing environmental consciousness among consumers and businesses. These developments are improving the market fit of aluminum ingots for various applications, enhancing their competitiveness against other materials.
Report Scope & Segmentation Analysis
This report segments the aluminum ingots market based on end-user industry:
- Automotive: This segment displays the highest growth potential, fueled by the increasing demand for lightweight vehicles.
- Aerospace: This sector utilizes high-strength, lightweight alloys, driving the need for specialized aluminum ingots.
- Building and Construction: Aluminum’s versatility as a building material ensures steady demand in this sector.
- Semiconductor: High-purity aluminum ingots are crucial for the semiconductor industry, demanding specialized production processes.
- Electrical and Electronics: This segment utilizes aluminum for its electrical conductivity in various components.
- Other End-user Industries: This includes packaging, transportation, and other industrial applications.
Each segment showcases distinct growth projections, market sizes, and competitive dynamics, providing a detailed understanding of the market's intricate structure.
Key Drivers of Aluminum Ingots Market Growth
The aluminum ingots market’s growth is propelled by the automotive industry's shift toward lightweight vehicles to enhance fuel efficiency. Infrastructure development, particularly in emerging economies, drives demand for construction materials, including aluminum. Furthermore, advancements in aluminum alloy technology continuously improve the material’s properties, leading to expanded applications. Government regulations promoting sustainable materials also positively influence market growth by incentivizing the use of recycled aluminum.
Challenges in the Aluminum Ingots Market Sector
Fluctuations in raw material prices and energy costs pose a significant challenge to producers' profitability. Supply chain disruptions, particularly those related to bauxite (aluminum ore) sourcing, can impact production and delivery timelines. Intense competition among major players requires constant innovation and cost optimization to maintain market share. Environmental regulations related to emissions and waste management can increase production costs and necessitate technological upgrades. These factors collectively impact overall market dynamics.
Emerging Opportunities in Aluminum Ingots Market
The growing demand for low-carbon aluminum presents a significant opportunity for producers to invest in green technologies and recycled aluminum solutions. The expansion of the electric vehicle market creates sustained growth in the automotive sector. Innovations in aluminum alloy compositions, tailored to specific applications, open avenues for market expansion. Finally, the development of lightweight, high-strength alloys for aerospace applications presents promising opportunities for technological advancements.
Leading Players in the Aluminum Ingots Market Market
- SPIC Inc
- JBMI
- Dubai Aluminium Company
- Xinfa Group Co Ltd
- Norsk Hydro ASA
- Aluminum Corporation of China Limited (Chalco)
- BHP Billiton
- United Company
- Rio Tinto Group
- CHINA ZHONGWANG HOLDINGS LIMITED
- RUSAL Plc
- Alcoa Inc
- Hindalco Industries Ltd
- Aluminium Bahrain
Key Developments in Aluminum Ingots Market Industry
- July 2022: Alcoa Corporation announced plans to increase casting capabilities at its Deschambault smelter in Canada, expanding its standard ingot production.
- August 2022: Rio Tinto invested USD 29 Million in a new aluminum recycling facility at its Arvida Plant in Quebec, enhancing its low-carbon aluminum offerings.
Strategic Outlook for Aluminum Ingots Market Market
The aluminum ingots market is poised for sustained growth, driven by increasing demand from various sectors. Continuous technological advancements, focused on sustainability and improved material properties, will be crucial in shaping the market’s future. Strategic investments in recycling infrastructure and the development of innovative aluminum alloys will solidify the market's position as a vital supplier of lightweight and sustainable materials.
Aluminum Ingots Market Segmentation
-
1. End-user Industry
- 1.1. Automotive
- 1.2. Aerospace
- 1.3. Building and Construction
- 1.4. Semiconductor
- 1.5. Electrical and Electronics
- 1.6. Other End-user Industries
Aluminum Ingots Market Segmentation By Geography
-
1. Asia Pacific
- 1.1. China
- 1.2. India
- 1.3. Japan
- 1.4. South Korea
- 1.5. Rest of Asia Pacific
-
2. North America
- 2.1. United States
- 2.2. Canada
- 2.3. Mexico
-
3. Europe
- 3.1. Germany
- 3.2. United Kingdom
- 3.3. Italy
- 3.4. France
- 3.5. Rest of Europe
-
4. South America
- 4.1. Brazil
- 4.2. Argentina
- 4.3. Rest of South America
-
5. Middle East and Africa
- 5.1. Saudi Arabia
- 5.2. South Africa
- 5.3. Rest of Middle East and Africa
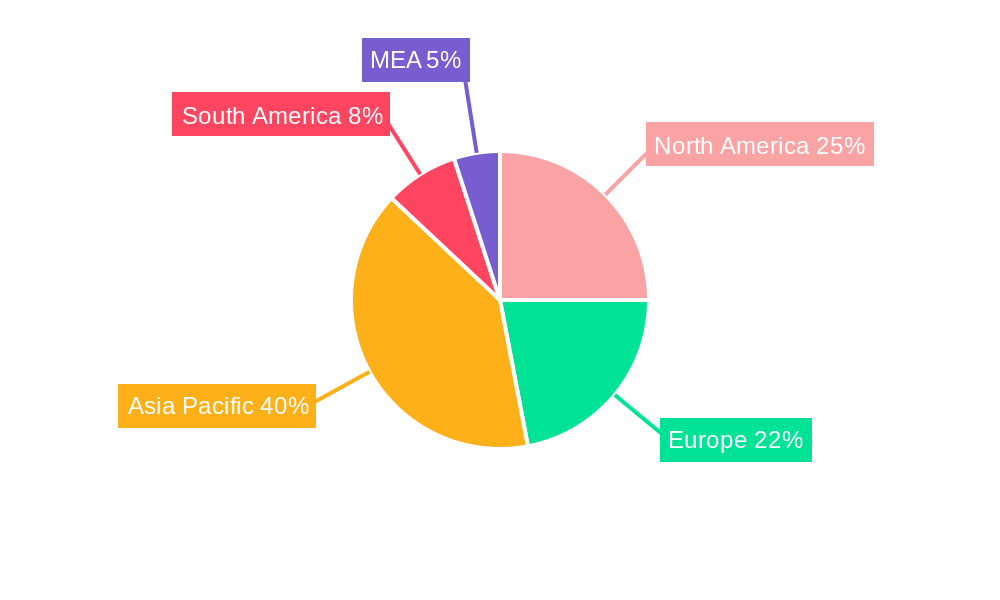
Aluminum Ingots Market Regional Market Share
Geographic Coverage of Aluminum Ingots Market
Aluminum Ingots Market REPORT HIGHLIGHTS
| Aspects | Details |
|---|---|
| Study Period | 2020-2034 |
| Base Year | 2025 |
| Estimated Year | 2026 |
| Forecast Period | 2026-2034 |
| Historical Period | 2020-2025 |
| Growth Rate | CAGR of > 6.50% from 2020-2034 |
| Segmentation |
|
Table of Contents
- 1. Introduction
- 1.1. Research Scope
- 1.2. Market Segmentation
- 1.3. Research Objective
- 1.4. Definitions and Assumptions
- 2. Executive Summary
- 2.1. Market Snapshot
- 3. Market Dynamics
- 3.1. Market Drivers
- 3.2. Market Restrains
- 3.3. Market Trends
- 3.4. Market Opportunities
- 4. Market Factor Analysis
- 4.1. Porters Five Forces
- 4.1.1. Bargaining Power of Suppliers
- 4.1.2. Bargaining Power of Buyers
- 4.1.3. Threat of New Entrants
- 4.1.4. Threat of Substitutes
- 4.1.5. Competitive Rivalry
- 4.2. PESTEL analysis
- 4.3. BCG Analysis
- 4.3.1. Stars (High Growth, High Market Share)
- 4.3.2. Cash Cows (Low Growth, High Market Share)
- 4.3.3. Question Mark (High Growth, Low Market Share)
- 4.3.4. Dogs (Low Growth, Low Market Share)
- 4.4. Ansoff Matrix Analysis
- 4.5. Supply Chain Analysis
- 4.6. Regulatory Landscape
- 4.7. Current Market Potential and Opportunity Assessment (TAM–SAM–SOM Framework)
- 4.8. RAX Analyst Note
- 4.1. Porters Five Forces
- 5. Market Analysis, Insights and Forecast 2021-2033
- 5.1. Market Analysis, Insights and Forecast - by End-user Industry
- 5.1.1. Automotive
- 5.1.2. Aerospace
- 5.1.3. Building and Construction
- 5.1.4. Semiconductor
- 5.1.5. Electrical and Electronics
- 5.1.6. Other End-user Industries
- 5.2. Market Analysis, Insights and Forecast - by Region
- 5.2.1. Asia Pacific
- 5.2.2. North America
- 5.2.3. Europe
- 5.2.4. South America
- 5.2.5. Middle East and Africa
- 5.1. Market Analysis, Insights and Forecast - by End-user Industry
- 6. Global Aluminum Ingots Market Analysis, Insights and Forecast, 2021-2033
- 6.1. Market Analysis, Insights and Forecast - by End-user Industry
- 6.1.1. Automotive
- 6.1.2. Aerospace
- 6.1.3. Building and Construction
- 6.1.4. Semiconductor
- 6.1.5. Electrical and Electronics
- 6.1.6. Other End-user Industries
- 6.1. Market Analysis, Insights and Forecast - by End-user Industry
- 7. Asia Pacific Aluminum Ingots Market Analysis, Insights and Forecast, 2020-2032
- 7.1. Market Analysis, Insights and Forecast - by End-user Industry
- 7.1.1. Automotive
- 7.1.2. Aerospace
- 7.1.3. Building and Construction
- 7.1.4. Semiconductor
- 7.1.5. Electrical and Electronics
- 7.1.6. Other End-user Industries
- 7.1. Market Analysis, Insights and Forecast - by End-user Industry
- 8. North America Aluminum Ingots Market Analysis, Insights and Forecast, 2020-2032
- 8.1. Market Analysis, Insights and Forecast - by End-user Industry
- 8.1.1. Automotive
- 8.1.2. Aerospace
- 8.1.3. Building and Construction
- 8.1.4. Semiconductor
- 8.1.5. Electrical and Electronics
- 8.1.6. Other End-user Industries
- 8.1. Market Analysis, Insights and Forecast - by End-user Industry
- 9. Europe Aluminum Ingots Market Analysis, Insights and Forecast, 2020-2032
- 9.1. Market Analysis, Insights and Forecast - by End-user Industry
- 9.1.1. Automotive
- 9.1.2. Aerospace
- 9.1.3. Building and Construction
- 9.1.4. Semiconductor
- 9.1.5. Electrical and Electronics
- 9.1.6. Other End-user Industries
- 9.1. Market Analysis, Insights and Forecast - by End-user Industry
- 10. South America Aluminum Ingots Market Analysis, Insights and Forecast, 2020-2032
- 10.1. Market Analysis, Insights and Forecast - by End-user Industry
- 10.1.1. Automotive
- 10.1.2. Aerospace
- 10.1.3. Building and Construction
- 10.1.4. Semiconductor
- 10.1.5. Electrical and Electronics
- 10.1.6. Other End-user Industries
- 10.1. Market Analysis, Insights and Forecast - by End-user Industry
- 11. Middle East and Africa Aluminum Ingots Market Analysis, Insights and Forecast, 2020-2032
- 11.1. Market Analysis, Insights and Forecast - by End-user Industry
- 11.1.1. Automotive
- 11.1.2. Aerospace
- 11.1.3. Building and Construction
- 11.1.4. Semiconductor
- 11.1.5. Electrical and Electronics
- 11.1.6. Other End-user Industries
- 11.1. Market Analysis, Insights and Forecast - by End-user Industry
- 12. Competitive Analysis
- 12.1. Company Profiles
- 12.1.1 SPIC Inc
- 12.1.1.1. Company Overview
- 12.1.1.2. Products
- 12.1.1.3. Company Financials
- 12.1.1.4. SWOT Analysis
- 12.1.2 JBMI
- 12.1.2.1. Company Overview
- 12.1.2.2. Products
- 12.1.2.3. Company Financials
- 12.1.2.4. SWOT Analysis
- 12.1.3 Dubai Aluminium Company
- 12.1.3.1. Company Overview
- 12.1.3.2. Products
- 12.1.3.3. Company Financials
- 12.1.3.4. SWOT Analysis
- 12.1.4 Xinfa Group Co Ltd
- 12.1.4.1. Company Overview
- 12.1.4.2. Products
- 12.1.4.3. Company Financials
- 12.1.4.4. SWOT Analysis
- 12.1.5 Norsk Hydro ASA
- 12.1.5.1. Company Overview
- 12.1.5.2. Products
- 12.1.5.3. Company Financials
- 12.1.5.4. SWOT Analysis
- 12.1.6 Aluminum Corporation of China Limited (Chalco)
- 12.1.6.1. Company Overview
- 12.1.6.2. Products
- 12.1.6.3. Company Financials
- 12.1.6.4. SWOT Analysis
- 12.1.7 BHP Billiton
- 12.1.7.1. Company Overview
- 12.1.7.2. Products
- 12.1.7.3. Company Financials
- 12.1.7.4. SWOT Analysis
- 12.1.8 United Company
- 12.1.8.1. Company Overview
- 12.1.8.2. Products
- 12.1.8.3. Company Financials
- 12.1.8.4. SWOT Analysis
- 12.1.9 Rio Tinto Group
- 12.1.9.1. Company Overview
- 12.1.9.2. Products
- 12.1.9.3. Company Financials
- 12.1.9.4. SWOT Analysis
- 12.1.10 CHINA ZHONGWANG HOLDINGS LIMITED
- 12.1.10.1. Company Overview
- 12.1.10.2. Products
- 12.1.10.3. Company Financials
- 12.1.10.4. SWOT Analysis
- 12.1.11 RUSAL Plc
- 12.1.11.1. Company Overview
- 12.1.11.2. Products
- 12.1.11.3. Company Financials
- 12.1.11.4. SWOT Analysis
- 12.1.12 Alcoa Inc
- 12.1.12.1. Company Overview
- 12.1.12.2. Products
- 12.1.12.3. Company Financials
- 12.1.12.4. SWOT Analysis
- 12.1.13 Hindalco Industries Ltd
- 12.1.13.1. Company Overview
- 12.1.13.2. Products
- 12.1.13.3. Company Financials
- 12.1.13.4. SWOT Analysis
- 12.1.14 Aluminium Bahrain
- 12.1.14.1. Company Overview
- 12.1.14.2. Products
- 12.1.14.3. Company Financials
- 12.1.14.4. SWOT Analysis
- 12.1.1 SPIC Inc
- 12.2. Market Entropy
- 12.2.1 Company's Key Areas Served
- 12.2.2 Recent Developments
- 12.3. Company Market Share Analysis 2025
- 12.3.1 Top 5 Companies Market Share Analysis
- 12.3.2 Top 3 Companies Market Share Analysis
- 12.4. List of Potential Customers
- 13. Research Methodology
List of Figures
- Figure 1: Global Aluminum Ingots Market Revenue Breakdown (Million, %) by Region 2025 & 2033
- Figure 2: Global Aluminum Ingots Market Volume Breakdown (K Tons, %) by Region 2025 & 2033
- Figure 3: Asia Pacific Aluminum Ingots Market Revenue (Million), by End-user Industry 2025 & 2033
- Figure 4: Asia Pacific Aluminum Ingots Market Volume (K Tons), by End-user Industry 2025 & 2033
- Figure 5: Asia Pacific Aluminum Ingots Market Revenue Share (%), by End-user Industry 2025 & 2033
- Figure 6: Asia Pacific Aluminum Ingots Market Volume Share (%), by End-user Industry 2025 & 2033
- Figure 7: Asia Pacific Aluminum Ingots Market Revenue (Million), by Country 2025 & 2033
- Figure 8: Asia Pacific Aluminum Ingots Market Volume (K Tons), by Country 2025 & 2033
- Figure 9: Asia Pacific Aluminum Ingots Market Revenue Share (%), by Country 2025 & 2033
- Figure 10: Asia Pacific Aluminum Ingots Market Volume Share (%), by Country 2025 & 2033
- Figure 11: North America Aluminum Ingots Market Revenue (Million), by End-user Industry 2025 & 2033
- Figure 12: North America Aluminum Ingots Market Volume (K Tons), by End-user Industry 2025 & 2033
- Figure 13: North America Aluminum Ingots Market Revenue Share (%), by End-user Industry 2025 & 2033
- Figure 14: North America Aluminum Ingots Market Volume Share (%), by End-user Industry 2025 & 2033
- Figure 15: North America Aluminum Ingots Market Revenue (Million), by Country 2025 & 2033
- Figure 16: North America Aluminum Ingots Market Volume (K Tons), by Country 2025 & 2033
- Figure 17: North America Aluminum Ingots Market Revenue Share (%), by Country 2025 & 2033
- Figure 18: North America Aluminum Ingots Market Volume Share (%), by Country 2025 & 2033
- Figure 19: Europe Aluminum Ingots Market Revenue (Million), by End-user Industry 2025 & 2033
- Figure 20: Europe Aluminum Ingots Market Volume (K Tons), by End-user Industry 2025 & 2033
- Figure 21: Europe Aluminum Ingots Market Revenue Share (%), by End-user Industry 2025 & 2033
- Figure 22: Europe Aluminum Ingots Market Volume Share (%), by End-user Industry 2025 & 2033
- Figure 23: Europe Aluminum Ingots Market Revenue (Million), by Country 2025 & 2033
- Figure 24: Europe Aluminum Ingots Market Volume (K Tons), by Country 2025 & 2033
- Figure 25: Europe Aluminum Ingots Market Revenue Share (%), by Country 2025 & 2033
- Figure 26: Europe Aluminum Ingots Market Volume Share (%), by Country 2025 & 2033
- Figure 27: South America Aluminum Ingots Market Revenue (Million), by End-user Industry 2025 & 2033
- Figure 28: South America Aluminum Ingots Market Volume (K Tons), by End-user Industry 2025 & 2033
- Figure 29: South America Aluminum Ingots Market Revenue Share (%), by End-user Industry 2025 & 2033
- Figure 30: South America Aluminum Ingots Market Volume Share (%), by End-user Industry 2025 & 2033
- Figure 31: South America Aluminum Ingots Market Revenue (Million), by Country 2025 & 2033
- Figure 32: South America Aluminum Ingots Market Volume (K Tons), by Country 2025 & 2033
- Figure 33: South America Aluminum Ingots Market Revenue Share (%), by Country 2025 & 2033
- Figure 34: South America Aluminum Ingots Market Volume Share (%), by Country 2025 & 2033
- Figure 35: Middle East and Africa Aluminum Ingots Market Revenue (Million), by End-user Industry 2025 & 2033
- Figure 36: Middle East and Africa Aluminum Ingots Market Volume (K Tons), by End-user Industry 2025 & 2033
- Figure 37: Middle East and Africa Aluminum Ingots Market Revenue Share (%), by End-user Industry 2025 & 2033
- Figure 38: Middle East and Africa Aluminum Ingots Market Volume Share (%), by End-user Industry 2025 & 2033
- Figure 39: Middle East and Africa Aluminum Ingots Market Revenue (Million), by Country 2025 & 2033
- Figure 40: Middle East and Africa Aluminum Ingots Market Volume (K Tons), by Country 2025 & 2033
- Figure 41: Middle East and Africa Aluminum Ingots Market Revenue Share (%), by Country 2025 & 2033
- Figure 42: Middle East and Africa Aluminum Ingots Market Volume Share (%), by Country 2025 & 2033
List of Tables
- Table 1: Global Aluminum Ingots Market Revenue Million Forecast, by End-user Industry 2020 & 2033
- Table 2: Global Aluminum Ingots Market Volume K Tons Forecast, by End-user Industry 2020 & 2033
- Table 3: Global Aluminum Ingots Market Revenue Million Forecast, by Region 2020 & 2033
- Table 4: Global Aluminum Ingots Market Volume K Tons Forecast, by Region 2020 & 2033
- Table 5: Global Aluminum Ingots Market Revenue Million Forecast, by End-user Industry 2020 & 2033
- Table 6: Global Aluminum Ingots Market Volume K Tons Forecast, by End-user Industry 2020 & 2033
- Table 7: Global Aluminum Ingots Market Revenue Million Forecast, by Country 2020 & 2033
- Table 8: Global Aluminum Ingots Market Volume K Tons Forecast, by Country 2020 & 2033
- Table 9: China Aluminum Ingots Market Revenue (Million) Forecast, by Application 2020 & 2033
- Table 10: China Aluminum Ingots Market Volume (K Tons) Forecast, by Application 2020 & 2033
- Table 11: India Aluminum Ingots Market Revenue (Million) Forecast, by Application 2020 & 2033
- Table 12: India Aluminum Ingots Market Volume (K Tons) Forecast, by Application 2020 & 2033
- Table 13: Japan Aluminum Ingots Market Revenue (Million) Forecast, by Application 2020 & 2033
- Table 14: Japan Aluminum Ingots Market Volume (K Tons) Forecast, by Application 2020 & 2033
- Table 15: South Korea Aluminum Ingots Market Revenue (Million) Forecast, by Application 2020 & 2033
- Table 16: South Korea Aluminum Ingots Market Volume (K Tons) Forecast, by Application 2020 & 2033
- Table 17: Rest of Asia Pacific Aluminum Ingots Market Revenue (Million) Forecast, by Application 2020 & 2033
- Table 18: Rest of Asia Pacific Aluminum Ingots Market Volume (K Tons) Forecast, by Application 2020 & 2033
- Table 19: Global Aluminum Ingots Market Revenue Million Forecast, by End-user Industry 2020 & 2033
- Table 20: Global Aluminum Ingots Market Volume K Tons Forecast, by End-user Industry 2020 & 2033
- Table 21: Global Aluminum Ingots Market Revenue Million Forecast, by Country 2020 & 2033
- Table 22: Global Aluminum Ingots Market Volume K Tons Forecast, by Country 2020 & 2033
- Table 23: United States Aluminum Ingots Market Revenue (Million) Forecast, by Application 2020 & 2033
- Table 24: United States Aluminum Ingots Market Volume (K Tons) Forecast, by Application 2020 & 2033
- Table 25: Canada Aluminum Ingots Market Revenue (Million) Forecast, by Application 2020 & 2033
- Table 26: Canada Aluminum Ingots Market Volume (K Tons) Forecast, by Application 2020 & 2033
- Table 27: Mexico Aluminum Ingots Market Revenue (Million) Forecast, by Application 2020 & 2033
- Table 28: Mexico Aluminum Ingots Market Volume (K Tons) Forecast, by Application 2020 & 2033
- Table 29: Global Aluminum Ingots Market Revenue Million Forecast, by End-user Industry 2020 & 2033
- Table 30: Global Aluminum Ingots Market Volume K Tons Forecast, by End-user Industry 2020 & 2033
- Table 31: Global Aluminum Ingots Market Revenue Million Forecast, by Country 2020 & 2033
- Table 32: Global Aluminum Ingots Market Volume K Tons Forecast, by Country 2020 & 2033
- Table 33: Germany Aluminum Ingots Market Revenue (Million) Forecast, by Application 2020 & 2033
- Table 34: Germany Aluminum Ingots Market Volume (K Tons) Forecast, by Application 2020 & 2033
- Table 35: United Kingdom Aluminum Ingots Market Revenue (Million) Forecast, by Application 2020 & 2033
- Table 36: United Kingdom Aluminum Ingots Market Volume (K Tons) Forecast, by Application 2020 & 2033
- Table 37: Italy Aluminum Ingots Market Revenue (Million) Forecast, by Application 2020 & 2033
- Table 38: Italy Aluminum Ingots Market Volume (K Tons) Forecast, by Application 2020 & 2033
- Table 39: France Aluminum Ingots Market Revenue (Million) Forecast, by Application 2020 & 2033
- Table 40: France Aluminum Ingots Market Volume (K Tons) Forecast, by Application 2020 & 2033
- Table 41: Rest of Europe Aluminum Ingots Market Revenue (Million) Forecast, by Application 2020 & 2033
- Table 42: Rest of Europe Aluminum Ingots Market Volume (K Tons) Forecast, by Application 2020 & 2033
- Table 43: Global Aluminum Ingots Market Revenue Million Forecast, by End-user Industry 2020 & 2033
- Table 44: Global Aluminum Ingots Market Volume K Tons Forecast, by End-user Industry 2020 & 2033
- Table 45: Global Aluminum Ingots Market Revenue Million Forecast, by Country 2020 & 2033
- Table 46: Global Aluminum Ingots Market Volume K Tons Forecast, by Country 2020 & 2033
- Table 47: Brazil Aluminum Ingots Market Revenue (Million) Forecast, by Application 2020 & 2033
- Table 48: Brazil Aluminum Ingots Market Volume (K Tons) Forecast, by Application 2020 & 2033
- Table 49: Argentina Aluminum Ingots Market Revenue (Million) Forecast, by Application 2020 & 2033
- Table 50: Argentina Aluminum Ingots Market Volume (K Tons) Forecast, by Application 2020 & 2033
- Table 51: Rest of South America Aluminum Ingots Market Revenue (Million) Forecast, by Application 2020 & 2033
- Table 52: Rest of South America Aluminum Ingots Market Volume (K Tons) Forecast, by Application 2020 & 2033
- Table 53: Global Aluminum Ingots Market Revenue Million Forecast, by End-user Industry 2020 & 2033
- Table 54: Global Aluminum Ingots Market Volume K Tons Forecast, by End-user Industry 2020 & 2033
- Table 55: Global Aluminum Ingots Market Revenue Million Forecast, by Country 2020 & 2033
- Table 56: Global Aluminum Ingots Market Volume K Tons Forecast, by Country 2020 & 2033
- Table 57: Saudi Arabia Aluminum Ingots Market Revenue (Million) Forecast, by Application 2020 & 2033
- Table 58: Saudi Arabia Aluminum Ingots Market Volume (K Tons) Forecast, by Application 2020 & 2033
- Table 59: South Africa Aluminum Ingots Market Revenue (Million) Forecast, by Application 2020 & 2033
- Table 60: South Africa Aluminum Ingots Market Volume (K Tons) Forecast, by Application 2020 & 2033
- Table 61: Rest of Middle East and Africa Aluminum Ingots Market Revenue (Million) Forecast, by Application 2020 & 2033
- Table 62: Rest of Middle East and Africa Aluminum Ingots Market Volume (K Tons) Forecast, by Application 2020 & 2033
Frequently Asked Questions
1. What is the projected Compound Annual Growth Rate (CAGR) of the Aluminum Ingots Market?
The projected CAGR is approximately > 6.50%.
2. Which companies are prominent players in the Aluminum Ingots Market?
Key companies in the market include SPIC Inc, JBMI, Dubai Aluminium Company, Xinfa Group Co Ltd , Norsk Hydro ASA, Aluminum Corporation of China Limited (Chalco), BHP Billiton, United Company, Rio Tinto Group, CHINA ZHONGWANG HOLDINGS LIMITED, RUSAL Plc, Alcoa Inc, Hindalco Industries Ltd, Aluminium Bahrain.
3. What are the main segments of the Aluminum Ingots Market?
The market segments include End-user Industry.
4. Can you provide details about the market size?
The market size is estimated to be USD XX Million as of 2022.
5. What are some drivers contributing to market growth?
Surging Construction Activities in Developing Countries; Rising Application of Aluminum Ingots in the Automotive Industry.
6. What are the notable trends driving market growth?
Significant Growth in Building and Construction Segment.
7. Are there any restraints impacting market growth?
Fluctuating Prices of Raw Materials; Other Market Restraints.
8. Can you provide examples of recent developments in the market?
July 2022: Alcoa Corporation announced that it would soon start the project construction to increase the casting capabilities at its Deschambault smelter in Canada to include standard ingots. The new casting equipment will be constructed in an existing building, with the project fully completed in the first quarter of 2023.
9. What pricing options are available for accessing the report?
Pricing options include single-user, multi-user, and enterprise licenses priced at USD 4750, USD 5250, and USD 8750 respectively.
10. Is the market size provided in terms of value or volume?
The market size is provided in terms of value, measured in Million and volume, measured in K Tons.
11. Are there any specific market keywords associated with the report?
Yes, the market keyword associated with the report is "Aluminum Ingots Market," which aids in identifying and referencing the specific market segment covered.
12. How do I determine which pricing option suits my needs best?
The pricing options vary based on user requirements and access needs. Individual users may opt for single-user licenses, while businesses requiring broader access may choose multi-user or enterprise licenses for cost-effective access to the report.
13. Are there any additional resources or data provided in the Aluminum Ingots Market report?
While the report offers comprehensive insights, it's advisable to review the specific contents or supplementary materials provided to ascertain if additional resources or data are available.
14. How can I stay updated on further developments or reports in the Aluminum Ingots Market?
To stay informed about further developments, trends, and reports in the Aluminum Ingots Market, consider subscribing to industry newsletters, following relevant companies and organizations, or regularly checking reputable industry news sources and publications.
Methodology
Step 1 - Identification of Relevant Samples Size from Population Database


Step 2 - Approaches for Defining Global Market Size (Value, Volume* & Price*)

Note*: In applicable scenarios
Step 3 - Data Sources
Primary Research
- Web Analytics
- Survey Reports
- Research Institute
- Latest Research Reports
- Opinion Leaders
Secondary Research
- Annual Reports
- White Paper
- Latest Press Release
- Industry Association
- Paid Database
- Investor Presentations

Step 4 - Data Triangulation
Involves using different sources of information in order to increase the validity of a study
These sources are likely to be stakeholders in a program - participants, other researchers, program staff, other community members, and so on.
Then we put all data in single framework & apply various statistical tools to find out the dynamic on the market.
During the analysis stage, feedback from the stakeholder groups would be compared to determine areas of agreement as well as areas of divergence