

Key Insights
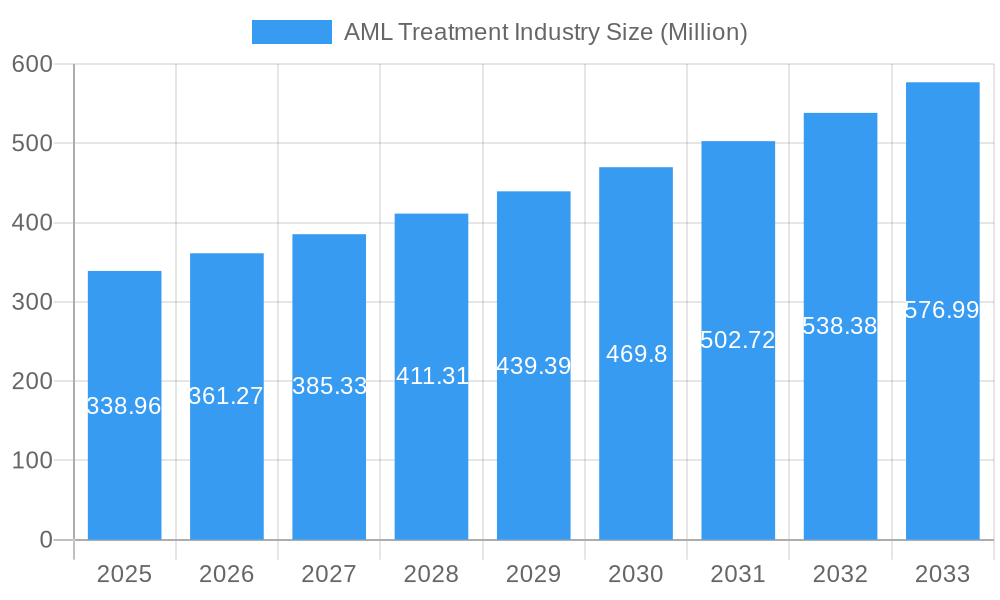
The Asia-Pacific Acute Myeloid Leukemia (AML) treatment market, valued at $338.96 million in 2025, is projected to experience robust growth, exhibiting a Compound Annual Growth Rate (CAGR) of 6.46% from 2025 to 2033. This expansion is fueled by several key factors. Rising prevalence of AML, particularly among the aging population within the region, is a significant driver. Advances in targeted therapies and the increasing adoption of innovative treatment regimens, such as stem cell transplantation, are contributing to improved patient outcomes and market growth. Furthermore, enhanced healthcare infrastructure and rising healthcare expenditure in several key Asian markets, including China, Japan, and India, are creating a favorable environment for the AML treatment market to flourish. However, high treatment costs and limited access to advanced therapies in certain regions present challenges to market expansion. The market is segmented by therapy type (Chemotherapy – including Anthracycline Drugs, Alkylating Agents, Anti-metabolites, and other Chemotherapies; Targeted Therapy; Stem Cell Transplant; and Other Therapies) and geography (China, Japan, India, Australia, South Korea, and Rest of Asia-Pacific). Competition is intense, with major pharmaceutical companies like Daiichi Sankyo, Celgene (now Bristol Myers Squibb), Novartis, Astellas Pharma, Teva Pharmaceuticals, AbbVie, Sun Pharmaceutical Industries, Fresenius, Viatris, and Pfizer actively engaged in research, development, and market penetration.
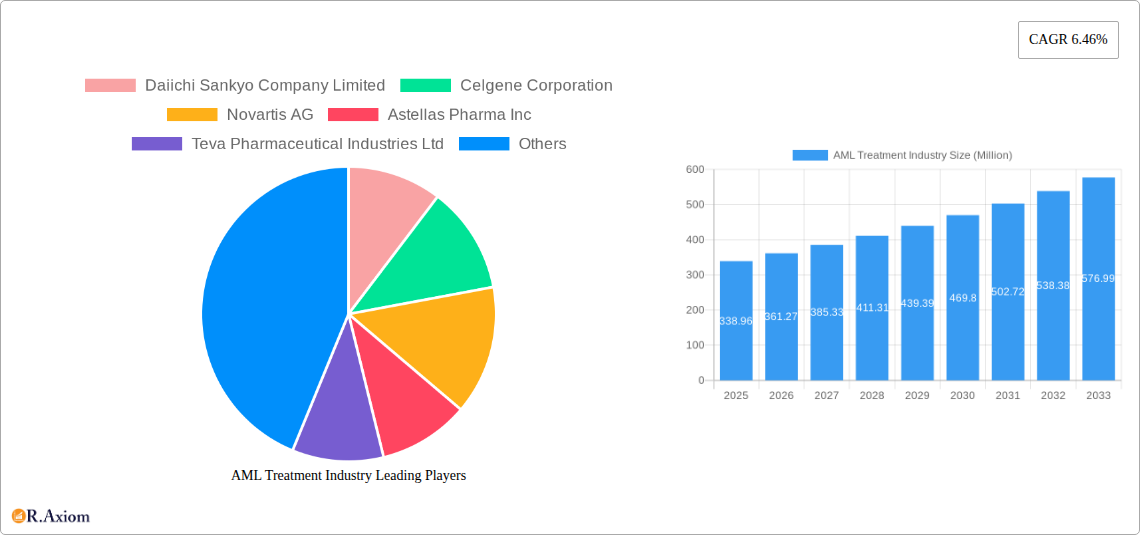
AML Treatment Industry Market Size (In Million)
The market's future growth trajectory will be significantly influenced by ongoing clinical trials exploring novel treatment approaches, regulatory approvals of new drugs, and the evolving reimbursement landscape. Increased government initiatives focused on cancer awareness and early diagnosis, along with improved access to healthcare services, particularly in underserved areas, will also play a crucial role in shaping the market's future. While challenges related to cost and accessibility persist, the ongoing advancements in AML treatment and the increasing focus on patient care within the Asia-Pacific region position the market for significant and sustained growth throughout the forecast period. The competitive landscape is dynamic, with companies strategically investing in R&D and expanding their market presence through partnerships and collaborations.
AML Treatment Industry Company Market Share
AML Treatment Industry: A Comprehensive Market Report (2019-2033)
This in-depth report provides a comprehensive analysis of the AML (Acute Myeloid Leukemia) treatment market, offering invaluable insights for industry stakeholders, investors, and researchers. The report covers the period from 2019 to 2033, with a focus on the forecast period from 2025 to 2033, using 2025 as the base year and incorporating data up to 2024. The total market size is estimated at xx Million in 2025, and the report projects robust growth throughout the forecast period.
AML Treatment Industry Market Concentration & Innovation
The AML treatment market exhibits a moderately concentrated landscape, with several key players holding significant market share. Daiichi Sankyo Company Limited, Celgene Corporation, Novartis AG, Astellas Pharma Inc, Teva Pharmaceutical Industries Ltd, AbbVie Inc, Sun Pharmaceutical Industries Ltd, Fresenius SE & Co KGaA, Viatris (Mylan NV), and Pfizer Inc are among the leading companies driving innovation and competition. Market share dynamics are influenced by factors such as product pipelines, R&D investments, and regulatory approvals. The estimated market share for the top 5 companies in 2025 is approximately 60%, suggesting considerable consolidation. M&A activity has played a crucial role in shaping the market, with deal values exceeding xx Million in recent years. These activities have primarily focused on expanding product portfolios, gaining access to new technologies, and strengthening geographical reach.
- Market Concentration: Top 5 players hold approximately 60% market share (2025 estimate).
- Innovation Drivers: Ongoing R&D efforts focused on targeted therapies, immunotherapies, and novel drug delivery systems.
- Regulatory Framework: Stringent regulatory approvals and clinical trial requirements significantly impact market entry and product lifecycle.
- Product Substitutes: The emergence of innovative therapies constantly creates substitutes, challenging existing treatments.
- End-User Trends: Increasing awareness of AML and demand for more effective and less toxic treatments are crucial drivers.
- M&A Activity: Significant M&A activity (xx Million in deal value in the historical period) to expand portfolios and enhance market position.
AML Treatment Industry Industry Trends & Insights
The AML treatment market is experiencing dynamic growth, driven by factors such as rising prevalence of AML, technological advancements in targeted therapies and immunotherapies, and increasing healthcare expenditure globally. The market is characterized by a high CAGR of xx% during the forecast period (2025-2033). This growth is further fueled by improved diagnostic tools and an enhanced understanding of AML's underlying biology. The market penetration of targeted therapies is steadily increasing, owing to their superior efficacy and reduced toxicity compared to traditional chemotherapies. However, the high cost of these therapies remains a barrier for many patients. Competitive dynamics are intensely shaped by continuous innovation, regulatory approvals, and the introduction of new therapies.
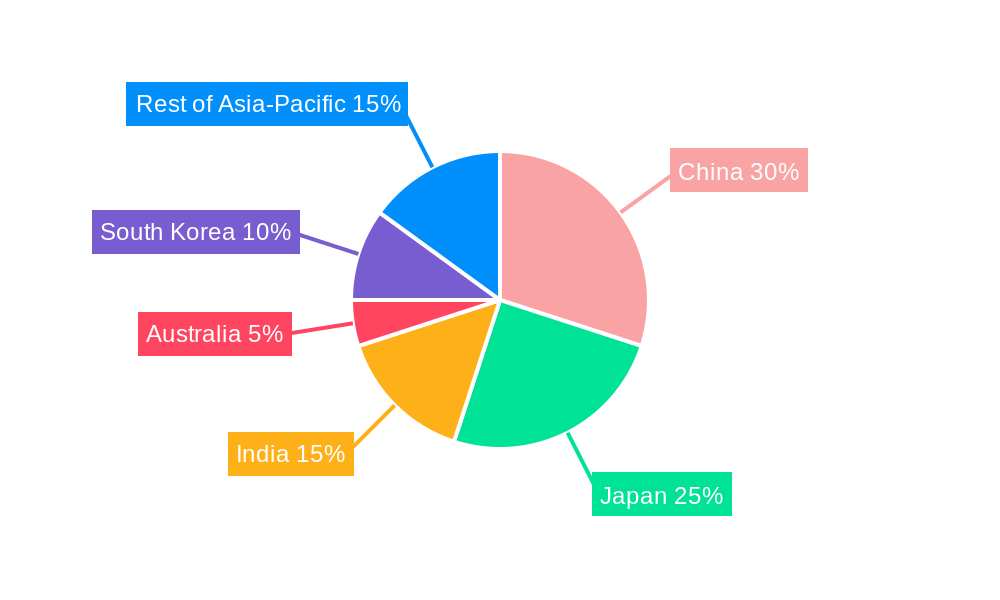
Dominant Markets & Segments in AML Treatment Industry
The AML treatment market demonstrates geographical variations in growth and segment dominance. While the precise market size for each country varies across the analysis period, the North American and European markets, combined with China and Japan, are currently the most significant contributors to global revenue.
- Leading Regions: North America and Europe (combined), followed by China and Japan.
- Leading Therapy Segments: Targeted therapy is experiencing the fastest growth, while chemotherapy (particularly Anthracycline Drugs and Alkylating Agents) remains the largest segment by revenue. Stem cell transplant remains a crucial segment, and other innovative therapies are gaining traction.
Key Drivers:
- China: Increasing healthcare infrastructure, rising disposable incomes, and government initiatives to improve cancer care.
- Japan: High healthcare expenditure, advanced healthcare infrastructure, and a large aging population.
- India: Growing awareness of AML, a vast patient pool, and a rapidly expanding pharmaceutical industry.
- Australia & South Korea: Relatively high per capita income and advanced healthcare systems.
Dominance Analysis: China and Japan represent significant market growth potential. Japan's strong regulatory framework and technological advancements support the adoption of innovative therapies, while China's expanding healthcare infrastructure and rising disposable income promise significant future growth. India, with its large population and growing healthcare sector, presents another major growth opportunity.
AML Treatment Industry Product Developments
Recent years have witnessed significant advancements in AML treatment, including the development of novel targeted therapies, improved chemotherapeutic regimens, and innovative drug delivery systems. The introduction of these advanced treatments has enhanced patient outcomes and improved quality of life. Key technological trends include the development of next-generation sequencing (NGS) based diagnostics and personalized medicine approaches for AML treatment. This reflects a shift toward more precise and effective therapies tailored to individual patient characteristics, creating a stronger market fit for these novel treatments and improving patient survival rates.
Report Scope & Segmentation Analysis
This report segments the AML treatment market across various therapies and geographical regions.
- Therapy: Chemotherapy (Anthracycline Drugs, Alkylating Agents, Anti-metabolites, Other Chemotherapies), Targeted Therapy, Stem Cell Transplant, Other Therapies. Each segment demonstrates unique growth trajectories based on technological advancements and market acceptance. The targeted therapy segment shows the highest growth potential.
- Geography: China, Japan, India, Australia, South Korea, Rest of Asia-Pacific. Each region exhibits different market dynamics influenced by healthcare infrastructure, economic factors, and regulatory frameworks.
Key Drivers of AML Treatment Industry Growth
The AML treatment market is propelled by several key factors, including a rising prevalence of AML globally, technological advancements in therapies resulting in improved efficacy and reduced toxicity, increased healthcare expenditure, growing awareness among patients and healthcare professionals, and supportive government initiatives. The ongoing research and development efforts focused on novel therapeutic approaches further stimulate market growth.
Challenges in the AML Treatment Industry Sector
Despite considerable growth potential, the AML treatment market faces challenges, including the high cost of new therapies, stringent regulatory hurdles for new drug approvals, complex treatment regimens with potential side effects, and the emergence of drug resistance. These challenges require innovative solutions and collaborative efforts from pharmaceutical companies, regulatory bodies, and healthcare providers.
Emerging Opportunities in AML Treatment Industry
Emerging opportunities in the AML treatment market include the development of personalized medicine approaches, the rise of innovative drug delivery systems, the increasing use of immunotherapy and CAR T-cell therapy, and the expansion into untapped markets. Early-stage clinical trials and emerging technologies are expected to shape future growth.
Leading Players in the AML Treatment Industry Market
- Daiichi Sankyo Company Limited
- Celgene Corporation (Note: Celgene is now part of Bristol Myers Squibb)
- Novartis AG
- Astellas Pharma Inc
- Teva Pharmaceutical Industries Ltd
- AbbVie Inc
- Sun Pharmaceutical Industries Ltd
- Fresenius SE & Co KGaA
- Viatris (Mylan NV)
- Pfizer Inc
Key Developments in AML Treatment Industry Industry
- May 2024: Nippon Shinyaku Co., Ltd. introduced Vyxeos Combination, an I.V. injection targeting high-risk AML patients in Japan. This launch expands treatment options for a challenging patient population.
- March 2024: Novartis India secured a distribution partner for Asciminib, designed to combat CML, signaling expansion into the Indian market for a targeted therapy.
Strategic Outlook for AML Treatment Industry Market
The AML treatment market exhibits significant future potential, driven by continuous innovation, expanding treatment options, and the growing need for more effective and personalized therapies. The focus on targeted therapies, immunotherapies, and personalized medicine will continue to drive market expansion. The increasing prevalence of AML and the development of novel diagnostic tools will further contribute to the growth of this market in the coming years.
AML Treatment Industry Segmentation
-
1. Therapy
-
1.1. Chemotherapy
- 1.1.1. Anthracycline Drugs
- 1.1.2. Alkylating Agents
- 1.1.3. Anti-metabolites
- 1.1.4. Other Chemotherapies
- 1.2. Targeted Therapy
- 1.3. Stem Cell Transplant
- 1.4. Other Therapies
-
1.1. Chemotherapy
-
2. Geography
- 2.1. China
- 2.2. Japan
- 2.3. India
- 2.4. Australia
- 2.5. South Korea
- 2.6. Rest of Asia-Pacific
AML Treatment Industry Segmentation By Geography
- 1. China
- 2. Japan
- 3. India
- 4. Australia
- 5. South Korea
- 6. Rest of Asia Pacific
AML Treatment Industry Regional Market Share
Geographic Coverage of AML Treatment Industry
AML Treatment Industry REPORT HIGHLIGHTS
| Aspects | Details |
|---|---|
| Study Period | 2020-2034 |
| Base Year | 2025 |
| Estimated Year | 2026 |
| Forecast Period | 2026-2034 |
| Historical Period | 2020-2025 |
| Growth Rate | CAGR of 6.46% from 2020-2034 |
| Segmentation |
|
Table of Contents
- 1. Introduction
- 1.1. Research Scope
- 1.2. Market Segmentation
- 1.3. Research Methodology
- 1.4. Definitions and Assumptions
- 2. Executive Summary
- 2.1. Introduction
- 3. Market Dynamics
- 3.1. Introduction
- 3.2. Market Drivers
- 3.2.1. High Incidence and Prevalence of Acute Myeloid Leukemia; Advancement in Pharmacology and Molecular Biology to Promote Drug Development
- 3.3. Market Restrains
- 3.3.1. Complications Related to Chemotherapy
- 3.4. Market Trends
- 3.4.1. The Chemotherapy Segment is Anticipated to Witness a Growth Over the Forecast Period
- 4. Market Factor Analysis
- 4.1. Porters Five Forces
- 4.2. Supply/Value Chain
- 4.3. PESTEL analysis
- 4.4. Market Entropy
- 4.5. Patent/Trademark Analysis
- 5. Global AML Treatment Industry Analysis, Insights and Forecast, 2020-2032
- 5.1. Market Analysis, Insights and Forecast - by Therapy
- 5.1.1. Chemotherapy
- 5.1.1.1. Anthracycline Drugs
- 5.1.1.2. Alkylating Agents
- 5.1.1.3. Anti-metabolites
- 5.1.1.4. Other Chemotherapies
- 5.1.2. Targeted Therapy
- 5.1.3. Stem Cell Transplant
- 5.1.4. Other Therapies
- 5.1.1. Chemotherapy
- 5.2. Market Analysis, Insights and Forecast - by Geography
- 5.2.1. China
- 5.2.2. Japan
- 5.2.3. India
- 5.2.4. Australia
- 5.2.5. South Korea
- 5.2.6. Rest of Asia-Pacific
- 5.3. Market Analysis, Insights and Forecast - by Region
- 5.3.1. China
- 5.3.2. Japan
- 5.3.3. India
- 5.3.4. Australia
- 5.3.5. South Korea
- 5.3.6. Rest of Asia Pacific
- 5.1. Market Analysis, Insights and Forecast - by Therapy
- 6. China AML Treatment Industry Analysis, Insights and Forecast, 2020-2032
- 6.1. Market Analysis, Insights and Forecast - by Therapy
- 6.1.1. Chemotherapy
- 6.1.1.1. Anthracycline Drugs
- 6.1.1.2. Alkylating Agents
- 6.1.1.3. Anti-metabolites
- 6.1.1.4. Other Chemotherapies
- 6.1.2. Targeted Therapy
- 6.1.3. Stem Cell Transplant
- 6.1.4. Other Therapies
- 6.1.1. Chemotherapy
- 6.2. Market Analysis, Insights and Forecast - by Geography
- 6.2.1. China
- 6.2.2. Japan
- 6.2.3. India
- 6.2.4. Australia
- 6.2.5. South Korea
- 6.2.6. Rest of Asia-Pacific
- 6.1. Market Analysis, Insights and Forecast - by Therapy
- 7. Japan AML Treatment Industry Analysis, Insights and Forecast, 2020-2032
- 7.1. Market Analysis, Insights and Forecast - by Therapy
- 7.1.1. Chemotherapy
- 7.1.1.1. Anthracycline Drugs
- 7.1.1.2. Alkylating Agents
- 7.1.1.3. Anti-metabolites
- 7.1.1.4. Other Chemotherapies
- 7.1.2. Targeted Therapy
- 7.1.3. Stem Cell Transplant
- 7.1.4. Other Therapies
- 7.1.1. Chemotherapy
- 7.2. Market Analysis, Insights and Forecast - by Geography
- 7.2.1. China
- 7.2.2. Japan
- 7.2.3. India
- 7.2.4. Australia
- 7.2.5. South Korea
- 7.2.6. Rest of Asia-Pacific
- 7.1. Market Analysis, Insights and Forecast - by Therapy
- 8. India AML Treatment Industry Analysis, Insights and Forecast, 2020-2032
- 8.1. Market Analysis, Insights and Forecast - by Therapy
- 8.1.1. Chemotherapy
- 8.1.1.1. Anthracycline Drugs
- 8.1.1.2. Alkylating Agents
- 8.1.1.3. Anti-metabolites
- 8.1.1.4. Other Chemotherapies
- 8.1.2. Targeted Therapy
- 8.1.3. Stem Cell Transplant
- 8.1.4. Other Therapies
- 8.1.1. Chemotherapy
- 8.2. Market Analysis, Insights and Forecast - by Geography
- 8.2.1. China
- 8.2.2. Japan
- 8.2.3. India
- 8.2.4. Australia
- 8.2.5. South Korea
- 8.2.6. Rest of Asia-Pacific
- 8.1. Market Analysis, Insights and Forecast - by Therapy
- 9. Australia AML Treatment Industry Analysis, Insights and Forecast, 2020-2032
- 9.1. Market Analysis, Insights and Forecast - by Therapy
- 9.1.1. Chemotherapy
- 9.1.1.1. Anthracycline Drugs
- 9.1.1.2. Alkylating Agents
- 9.1.1.3. Anti-metabolites
- 9.1.1.4. Other Chemotherapies
- 9.1.2. Targeted Therapy
- 9.1.3. Stem Cell Transplant
- 9.1.4. Other Therapies
- 9.1.1. Chemotherapy
- 9.2. Market Analysis, Insights and Forecast - by Geography
- 9.2.1. China
- 9.2.2. Japan
- 9.2.3. India
- 9.2.4. Australia
- 9.2.5. South Korea
- 9.2.6. Rest of Asia-Pacific
- 9.1. Market Analysis, Insights and Forecast - by Therapy
- 10. South Korea AML Treatment Industry Analysis, Insights and Forecast, 2020-2032
- 10.1. Market Analysis, Insights and Forecast - by Therapy
- 10.1.1. Chemotherapy
- 10.1.1.1. Anthracycline Drugs
- 10.1.1.2. Alkylating Agents
- 10.1.1.3. Anti-metabolites
- 10.1.1.4. Other Chemotherapies
- 10.1.2. Targeted Therapy
- 10.1.3. Stem Cell Transplant
- 10.1.4. Other Therapies
- 10.1.1. Chemotherapy
- 10.2. Market Analysis, Insights and Forecast - by Geography
- 10.2.1. China
- 10.2.2. Japan
- 10.2.3. India
- 10.2.4. Australia
- 10.2.5. South Korea
- 10.2.6. Rest of Asia-Pacific
- 10.1. Market Analysis, Insights and Forecast - by Therapy
- 11. Rest of Asia Pacific AML Treatment Industry Analysis, Insights and Forecast, 2020-2032
- 11.1. Market Analysis, Insights and Forecast - by Therapy
- 11.1.1. Chemotherapy
- 11.1.1.1. Anthracycline Drugs
- 11.1.1.2. Alkylating Agents
- 11.1.1.3. Anti-metabolites
- 11.1.1.4. Other Chemotherapies
- 11.1.2. Targeted Therapy
- 11.1.3. Stem Cell Transplant
- 11.1.4. Other Therapies
- 11.1.1. Chemotherapy
- 11.2. Market Analysis, Insights and Forecast - by Geography
- 11.2.1. China
- 11.2.2. Japan
- 11.2.3. India
- 11.2.4. Australia
- 11.2.5. South Korea
- 11.2.6. Rest of Asia-Pacific
- 11.1. Market Analysis, Insights and Forecast - by Therapy
- 12. Competitive Analysis
- 12.1. Global Market Share Analysis 2025
- 12.2. Company Profiles
- 12.2.1 Daiichi Sankyo Company Limited
- 12.2.1.1. Overview
- 12.2.1.2. Products
- 12.2.1.3. SWOT Analysis
- 12.2.1.4. Recent Developments
- 12.2.1.5. Financials (Based on Availability)
- 12.2.2 Celgene Corporation
- 12.2.2.1. Overview
- 12.2.2.2. Products
- 12.2.2.3. SWOT Analysis
- 12.2.2.4. Recent Developments
- 12.2.2.5. Financials (Based on Availability)
- 12.2.3 Novartis AG
- 12.2.3.1. Overview
- 12.2.3.2. Products
- 12.2.3.3. SWOT Analysis
- 12.2.3.4. Recent Developments
- 12.2.3.5. Financials (Based on Availability)
- 12.2.4 Astellas Pharma Inc
- 12.2.4.1. Overview
- 12.2.4.2. Products
- 12.2.4.3. SWOT Analysis
- 12.2.4.4. Recent Developments
- 12.2.4.5. Financials (Based on Availability)
- 12.2.5 Teva Pharmaceutical Industries Ltd
- 12.2.5.1. Overview
- 12.2.5.2. Products
- 12.2.5.3. SWOT Analysis
- 12.2.5.4. Recent Developments
- 12.2.5.5. Financials (Based on Availability)
- 12.2.6 AbbVie Inc
- 12.2.6.1. Overview
- 12.2.6.2. Products
- 12.2.6.3. SWOT Analysis
- 12.2.6.4. Recent Developments
- 12.2.6.5. Financials (Based on Availability)
- 12.2.7 Sun Pharmaceutical Industries Ltd
- 12.2.7.1. Overview
- 12.2.7.2. Products
- 12.2.7.3. SWOT Analysis
- 12.2.7.4. Recent Developments
- 12.2.7.5. Financials (Based on Availability)
- 12.2.8 Fresenius SE & Co KGaA
- 12.2.8.1. Overview
- 12.2.8.2. Products
- 12.2.8.3. SWOT Analysis
- 12.2.8.4. Recent Developments
- 12.2.8.5. Financials (Based on Availability)
- 12.2.9 Viatris (Mylan NV)
- 12.2.9.1. Overview
- 12.2.9.2. Products
- 12.2.9.3. SWOT Analysis
- 12.2.9.4. Recent Developments
- 12.2.9.5. Financials (Based on Availability)
- 12.2.10 Pfizer Inc
- 12.2.10.1. Overview
- 12.2.10.2. Products
- 12.2.10.3. SWOT Analysis
- 12.2.10.4. Recent Developments
- 12.2.10.5. Financials (Based on Availability)
- 12.2.1 Daiichi Sankyo Company Limited
List of Figures
- Figure 1: Global AML Treatment Industry Revenue Breakdown (Million, %) by Region 2025 & 2033
- Figure 2: Global AML Treatment Industry Volume Breakdown (K Unit, %) by Region 2025 & 2033
- Figure 3: China AML Treatment Industry Revenue (Million), by Therapy 2025 & 2033
- Figure 4: China AML Treatment Industry Volume (K Unit), by Therapy 2025 & 2033
- Figure 5: China AML Treatment Industry Revenue Share (%), by Therapy 2025 & 2033
- Figure 6: China AML Treatment Industry Volume Share (%), by Therapy 2025 & 2033
- Figure 7: China AML Treatment Industry Revenue (Million), by Geography 2025 & 2033
- Figure 8: China AML Treatment Industry Volume (K Unit), by Geography 2025 & 2033
- Figure 9: China AML Treatment Industry Revenue Share (%), by Geography 2025 & 2033
- Figure 10: China AML Treatment Industry Volume Share (%), by Geography 2025 & 2033
- Figure 11: China AML Treatment Industry Revenue (Million), by Country 2025 & 2033
- Figure 12: China AML Treatment Industry Volume (K Unit), by Country 2025 & 2033
- Figure 13: China AML Treatment Industry Revenue Share (%), by Country 2025 & 2033
- Figure 14: China AML Treatment Industry Volume Share (%), by Country 2025 & 2033
- Figure 15: Japan AML Treatment Industry Revenue (Million), by Therapy 2025 & 2033
- Figure 16: Japan AML Treatment Industry Volume (K Unit), by Therapy 2025 & 2033
- Figure 17: Japan AML Treatment Industry Revenue Share (%), by Therapy 2025 & 2033
- Figure 18: Japan AML Treatment Industry Volume Share (%), by Therapy 2025 & 2033
- Figure 19: Japan AML Treatment Industry Revenue (Million), by Geography 2025 & 2033
- Figure 20: Japan AML Treatment Industry Volume (K Unit), by Geography 2025 & 2033
- Figure 21: Japan AML Treatment Industry Revenue Share (%), by Geography 2025 & 2033
- Figure 22: Japan AML Treatment Industry Volume Share (%), by Geography 2025 & 2033
- Figure 23: Japan AML Treatment Industry Revenue (Million), by Country 2025 & 2033
- Figure 24: Japan AML Treatment Industry Volume (K Unit), by Country 2025 & 2033
- Figure 25: Japan AML Treatment Industry Revenue Share (%), by Country 2025 & 2033
- Figure 26: Japan AML Treatment Industry Volume Share (%), by Country 2025 & 2033
- Figure 27: India AML Treatment Industry Revenue (Million), by Therapy 2025 & 2033
- Figure 28: India AML Treatment Industry Volume (K Unit), by Therapy 2025 & 2033
- Figure 29: India AML Treatment Industry Revenue Share (%), by Therapy 2025 & 2033
- Figure 30: India AML Treatment Industry Volume Share (%), by Therapy 2025 & 2033
- Figure 31: India AML Treatment Industry Revenue (Million), by Geography 2025 & 2033
- Figure 32: India AML Treatment Industry Volume (K Unit), by Geography 2025 & 2033
- Figure 33: India AML Treatment Industry Revenue Share (%), by Geography 2025 & 2033
- Figure 34: India AML Treatment Industry Volume Share (%), by Geography 2025 & 2033
- Figure 35: India AML Treatment Industry Revenue (Million), by Country 2025 & 2033
- Figure 36: India AML Treatment Industry Volume (K Unit), by Country 2025 & 2033
- Figure 37: India AML Treatment Industry Revenue Share (%), by Country 2025 & 2033
- Figure 38: India AML Treatment Industry Volume Share (%), by Country 2025 & 2033
- Figure 39: Australia AML Treatment Industry Revenue (Million), by Therapy 2025 & 2033
- Figure 40: Australia AML Treatment Industry Volume (K Unit), by Therapy 2025 & 2033
- Figure 41: Australia AML Treatment Industry Revenue Share (%), by Therapy 2025 & 2033
- Figure 42: Australia AML Treatment Industry Volume Share (%), by Therapy 2025 & 2033
- Figure 43: Australia AML Treatment Industry Revenue (Million), by Geography 2025 & 2033
- Figure 44: Australia AML Treatment Industry Volume (K Unit), by Geography 2025 & 2033
- Figure 45: Australia AML Treatment Industry Revenue Share (%), by Geography 2025 & 2033
- Figure 46: Australia AML Treatment Industry Volume Share (%), by Geography 2025 & 2033
- Figure 47: Australia AML Treatment Industry Revenue (Million), by Country 2025 & 2033
- Figure 48: Australia AML Treatment Industry Volume (K Unit), by Country 2025 & 2033
- Figure 49: Australia AML Treatment Industry Revenue Share (%), by Country 2025 & 2033
- Figure 50: Australia AML Treatment Industry Volume Share (%), by Country 2025 & 2033
- Figure 51: South Korea AML Treatment Industry Revenue (Million), by Therapy 2025 & 2033
- Figure 52: South Korea AML Treatment Industry Volume (K Unit), by Therapy 2025 & 2033
- Figure 53: South Korea AML Treatment Industry Revenue Share (%), by Therapy 2025 & 2033
- Figure 54: South Korea AML Treatment Industry Volume Share (%), by Therapy 2025 & 2033
- Figure 55: South Korea AML Treatment Industry Revenue (Million), by Geography 2025 & 2033
- Figure 56: South Korea AML Treatment Industry Volume (K Unit), by Geography 2025 & 2033
- Figure 57: South Korea AML Treatment Industry Revenue Share (%), by Geography 2025 & 2033
- Figure 58: South Korea AML Treatment Industry Volume Share (%), by Geography 2025 & 2033
- Figure 59: South Korea AML Treatment Industry Revenue (Million), by Country 2025 & 2033
- Figure 60: South Korea AML Treatment Industry Volume (K Unit), by Country 2025 & 2033
- Figure 61: South Korea AML Treatment Industry Revenue Share (%), by Country 2025 & 2033
- Figure 62: South Korea AML Treatment Industry Volume Share (%), by Country 2025 & 2033
- Figure 63: Rest of Asia Pacific AML Treatment Industry Revenue (Million), by Therapy 2025 & 2033
- Figure 64: Rest of Asia Pacific AML Treatment Industry Volume (K Unit), by Therapy 2025 & 2033
- Figure 65: Rest of Asia Pacific AML Treatment Industry Revenue Share (%), by Therapy 2025 & 2033
- Figure 66: Rest of Asia Pacific AML Treatment Industry Volume Share (%), by Therapy 2025 & 2033
- Figure 67: Rest of Asia Pacific AML Treatment Industry Revenue (Million), by Geography 2025 & 2033
- Figure 68: Rest of Asia Pacific AML Treatment Industry Volume (K Unit), by Geography 2025 & 2033
- Figure 69: Rest of Asia Pacific AML Treatment Industry Revenue Share (%), by Geography 2025 & 2033
- Figure 70: Rest of Asia Pacific AML Treatment Industry Volume Share (%), by Geography 2025 & 2033
- Figure 71: Rest of Asia Pacific AML Treatment Industry Revenue (Million), by Country 2025 & 2033
- Figure 72: Rest of Asia Pacific AML Treatment Industry Volume (K Unit), by Country 2025 & 2033
- Figure 73: Rest of Asia Pacific AML Treatment Industry Revenue Share (%), by Country 2025 & 2033
- Figure 74: Rest of Asia Pacific AML Treatment Industry Volume Share (%), by Country 2025 & 2033
List of Tables
- Table 1: Global AML Treatment Industry Revenue Million Forecast, by Therapy 2020 & 2033
- Table 2: Global AML Treatment Industry Volume K Unit Forecast, by Therapy 2020 & 2033
- Table 3: Global AML Treatment Industry Revenue Million Forecast, by Geography 2020 & 2033
- Table 4: Global AML Treatment Industry Volume K Unit Forecast, by Geography 2020 & 2033
- Table 5: Global AML Treatment Industry Revenue Million Forecast, by Region 2020 & 2033
- Table 6: Global AML Treatment Industry Volume K Unit Forecast, by Region 2020 & 2033
- Table 7: Global AML Treatment Industry Revenue Million Forecast, by Therapy 2020 & 2033
- Table 8: Global AML Treatment Industry Volume K Unit Forecast, by Therapy 2020 & 2033
- Table 9: Global AML Treatment Industry Revenue Million Forecast, by Geography 2020 & 2033
- Table 10: Global AML Treatment Industry Volume K Unit Forecast, by Geography 2020 & 2033
- Table 11: Global AML Treatment Industry Revenue Million Forecast, by Country 2020 & 2033
- Table 12: Global AML Treatment Industry Volume K Unit Forecast, by Country 2020 & 2033
- Table 13: Global AML Treatment Industry Revenue Million Forecast, by Therapy 2020 & 2033
- Table 14: Global AML Treatment Industry Volume K Unit Forecast, by Therapy 2020 & 2033
- Table 15: Global AML Treatment Industry Revenue Million Forecast, by Geography 2020 & 2033
- Table 16: Global AML Treatment Industry Volume K Unit Forecast, by Geography 2020 & 2033
- Table 17: Global AML Treatment Industry Revenue Million Forecast, by Country 2020 & 2033
- Table 18: Global AML Treatment Industry Volume K Unit Forecast, by Country 2020 & 2033
- Table 19: Global AML Treatment Industry Revenue Million Forecast, by Therapy 2020 & 2033
- Table 20: Global AML Treatment Industry Volume K Unit Forecast, by Therapy 2020 & 2033
- Table 21: Global AML Treatment Industry Revenue Million Forecast, by Geography 2020 & 2033
- Table 22: Global AML Treatment Industry Volume K Unit Forecast, by Geography 2020 & 2033
- Table 23: Global AML Treatment Industry Revenue Million Forecast, by Country 2020 & 2033
- Table 24: Global AML Treatment Industry Volume K Unit Forecast, by Country 2020 & 2033
- Table 25: Global AML Treatment Industry Revenue Million Forecast, by Therapy 2020 & 2033
- Table 26: Global AML Treatment Industry Volume K Unit Forecast, by Therapy 2020 & 2033
- Table 27: Global AML Treatment Industry Revenue Million Forecast, by Geography 2020 & 2033
- Table 28: Global AML Treatment Industry Volume K Unit Forecast, by Geography 2020 & 2033
- Table 29: Global AML Treatment Industry Revenue Million Forecast, by Country 2020 & 2033
- Table 30: Global AML Treatment Industry Volume K Unit Forecast, by Country 2020 & 2033
- Table 31: Global AML Treatment Industry Revenue Million Forecast, by Therapy 2020 & 2033
- Table 32: Global AML Treatment Industry Volume K Unit Forecast, by Therapy 2020 & 2033
- Table 33: Global AML Treatment Industry Revenue Million Forecast, by Geography 2020 & 2033
- Table 34: Global AML Treatment Industry Volume K Unit Forecast, by Geography 2020 & 2033
- Table 35: Global AML Treatment Industry Revenue Million Forecast, by Country 2020 & 2033
- Table 36: Global AML Treatment Industry Volume K Unit Forecast, by Country 2020 & 2033
- Table 37: Global AML Treatment Industry Revenue Million Forecast, by Therapy 2020 & 2033
- Table 38: Global AML Treatment Industry Volume K Unit Forecast, by Therapy 2020 & 2033
- Table 39: Global AML Treatment Industry Revenue Million Forecast, by Geography 2020 & 2033
- Table 40: Global AML Treatment Industry Volume K Unit Forecast, by Geography 2020 & 2033
- Table 41: Global AML Treatment Industry Revenue Million Forecast, by Country 2020 & 2033
- Table 42: Global AML Treatment Industry Volume K Unit Forecast, by Country 2020 & 2033
Frequently Asked Questions
1. What is the projected Compound Annual Growth Rate (CAGR) of the AML Treatment Industry?
The projected CAGR is approximately 6.46%.
2. Which companies are prominent players in the AML Treatment Industry?
Key companies in the market include Daiichi Sankyo Company Limited, Celgene Corporation, Novartis AG, Astellas Pharma Inc, Teva Pharmaceutical Industries Ltd, AbbVie Inc, Sun Pharmaceutical Industries Ltd, Fresenius SE & Co KGaA, Viatris (Mylan NV), Pfizer Inc.
3. What are the main segments of the AML Treatment Industry?
The market segments include Therapy, Geography.
4. Can you provide details about the market size?
The market size is estimated to be USD 338.96 Million as of 2022.
5. What are some drivers contributing to market growth?
High Incidence and Prevalence of Acute Myeloid Leukemia; Advancement in Pharmacology and Molecular Biology to Promote Drug Development.
6. What are the notable trends driving market growth?
The Chemotherapy Segment is Anticipated to Witness a Growth Over the Forecast Period.
7. Are there any restraints impacting market growth?
Complications Related to Chemotherapy.
8. Can you provide examples of recent developments in the market?
May 2024 : Nippon Shinyaku Co., Ltd. introduced Vyxeos Combination, an I.V. injection (comprising Daunorubicin hydrochloride and cytarabine in a liposomal formulation), specifically targeting high-risk acute myeloid leukemia (AML) patients in Japan.
9. What pricing options are available for accessing the report?
Pricing options include single-user, multi-user, and enterprise licenses priced at USD 4750, USD 5250, and USD 8750 respectively.
10. Is the market size provided in terms of value or volume?
The market size is provided in terms of value, measured in Million and volume, measured in K Unit.
11. Are there any specific market keywords associated with the report?
Yes, the market keyword associated with the report is "AML Treatment Industry," which aids in identifying and referencing the specific market segment covered.
12. How do I determine which pricing option suits my needs best?
The pricing options vary based on user requirements and access needs. Individual users may opt for single-user licenses, while businesses requiring broader access may choose multi-user or enterprise licenses for cost-effective access to the report.
13. Are there any additional resources or data provided in the AML Treatment Industry report?
While the report offers comprehensive insights, it's advisable to review the specific contents or supplementary materials provided to ascertain if additional resources or data are available.
14. How can I stay updated on further developments or reports in the AML Treatment Industry?
To stay informed about further developments, trends, and reports in the AML Treatment Industry, consider subscribing to industry newsletters, following relevant companies and organizations, or regularly checking reputable industry news sources and publications.
Methodology
Step 1 - Identification of Relevant Samples Size from Population Database


Step 2 - Approaches for Defining Global Market Size (Value, Volume* & Price*)

Note*: In applicable scenarios
Step 3 - Data Sources
Primary Research
- Web Analytics
- Survey Reports
- Research Institute
- Latest Research Reports
- Opinion Leaders
Secondary Research
- Annual Reports
- White Paper
- Latest Press Release
- Industry Association
- Paid Database
- Investor Presentations

Step 4 - Data Triangulation
Involves using different sources of information in order to increase the validity of a study
These sources are likely to be stakeholders in a program - participants, other researchers, program staff, other community members, and so on.
Then we put all data in single framework & apply various statistical tools to find out the dynamic on the market.
During the analysis stage, feedback from the stakeholder groups would be compared to determine areas of agreement as well as areas of divergence