

Key Insights
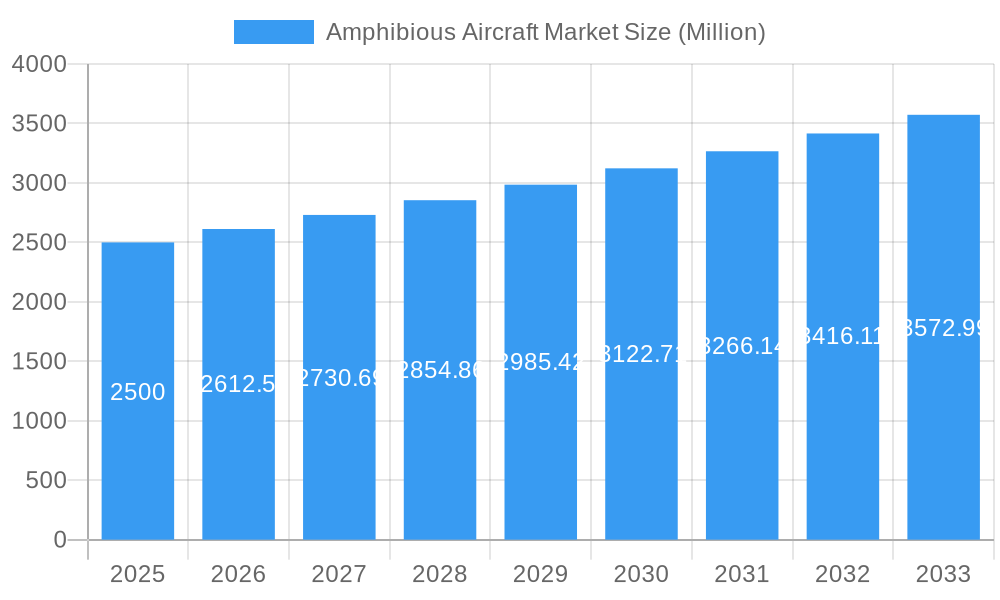
The amphibious aircraft market is experiencing robust expansion, driven by the increasing demand for versatile aircraft that can operate from both land and water. The market is projected to reach a size of 283.79 million by 2025, with a Compound Annual Growth Rate (CAGR) of 9.89%. Key growth drivers include the civilian segment's traction from rising tourism in remote areas and the military segment's utility in search and rescue, surveillance, and coastal patrol. Technological advancements in turboprop engines are enhancing efficiency and performance, further fueling market expansion. Leading players such as MVP Aero, ShinMaywa Industries, and AVIC are investing in R&D to improve aircraft features and expand market share. North America and Asia-Pacific are anticipated to lead market dominance due to high disposable incomes and infrastructure investments, with growth also expected in Europe and other regions driven by defense and emergency services spending.
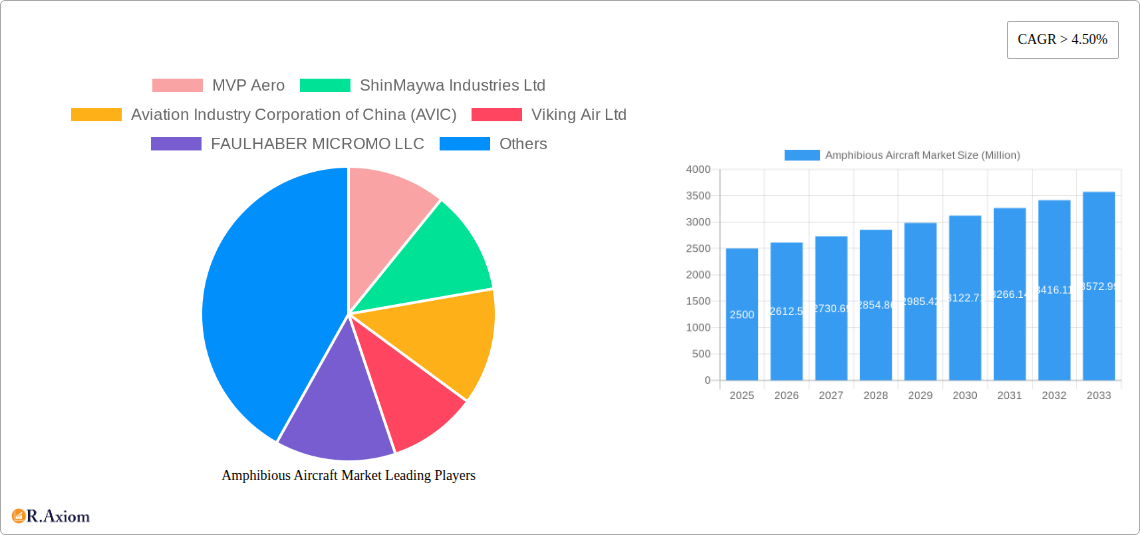
Amphibious Aircraft Market Market Size (In Million)
Market segmentation by application (civilian, military) and engine type (piston, turboprop) provides a granular view of growth. Turboprop engines are expected to lead market share due to superior performance and fuel efficiency, particularly for larger amphibious aircraft. The competitive landscape is dynamic, with established and emerging companies vying for dominance. Continued innovation in safety, operational cost reduction, and broader applications in both civilian and military sectors will be crucial for market success. Strategic partnerships and M&A activities are expected to shape competitive dynamics. Regulatory frameworks and environmental considerations will also significantly influence the market's future trajectory.
Amphibious Aircraft Market Company Market Share
Amphibious Aircraft Market: A Comprehensive Analysis (2019-2033)
This in-depth report provides a comprehensive analysis of the global Amphibious Aircraft market, offering invaluable insights for industry stakeholders, investors, and strategic decision-makers. The study covers the period 2019-2033, with 2025 as the base year and a forecast period of 2025-2033. The report leverages extensive primary and secondary research to deliver actionable intelligence on market size, segmentation, growth drivers, challenges, and competitive dynamics. Expect detailed analysis across key segments, including by application (civilian and military) and engine type (piston and turboprop).
Amphibious Aircraft Market Market Concentration & Innovation
The amphibious aircraft market exhibits a moderately concentrated landscape, with a few key players holding significant market share. MVP Aero, ShinMaywa Industries Ltd, and Aviation Industry Corporation of China (AVIC) are among the dominant players, collectively accounting for approximately xx% of the market in 2025. However, the market is also witnessing increased participation from smaller, specialized manufacturers, such as Viking Air Ltd and Atol Avion, who are focusing on niche segments. Market concentration is expected to shift slightly by 2033 with a predicted xx% increase in the market share of smaller manufacturers.
Innovation in the amphibious aircraft market is driven by advancements in materials science, engine technology, and avionics. Lightweight composite materials are being increasingly adopted to improve fuel efficiency and performance, while the integration of advanced avionics systems enhances safety and operational efficiency. Regulatory frameworks, particularly those concerning safety and environmental compliance, significantly influence technological advancements. The presence of substitute transportation modes, such as helicopters and boats, necessitates continuous innovation to maintain competitive advantage. Furthermore, M&A activities are playing a role in shaping the market landscape. Over the past five years (2019-2024), the total value of M&A deals in the amphibious aircraft sector is estimated to be around xx Million, with a focus on consolidation and technology acquisition. End-user trends, particularly towards increased demand for versatile and environmentally friendly aircraft, are shaping product development strategies.
Amphibious Aircraft Market Industry Trends & Insights
The global amphibious aircraft market is projected to experience significant growth during the forecast period (2025-2033), with a Compound Annual Growth Rate (CAGR) of xx%. This robust growth is primarily driven by increasing demand from both civilian and military sectors. The civilian segment is experiencing growth fueled by rising tourism, particularly in coastal and remote areas, and the expanding popularity of recreational flying. Military applications are driven by the need for versatile aircraft capable of operating in diverse terrains and environments. Technological disruptions, such as the development of more fuel-efficient engines and advanced flight control systems, are further stimulating market growth. Consumer preferences are shifting towards more comfortable, reliable, and environmentally friendly amphibious aircraft, leading manufacturers to prioritize these aspects in their product design and development efforts. Competitive dynamics are characterized by fierce competition among established players and emerging entrants, leading to price competition and innovation-driven product differentiation. Market penetration of amphibious aircraft is comparatively low compared to other general aviation segments, leaving significant room for expansion and growth potential.
Dominant Markets & Segments in Amphibious Aircraft Market
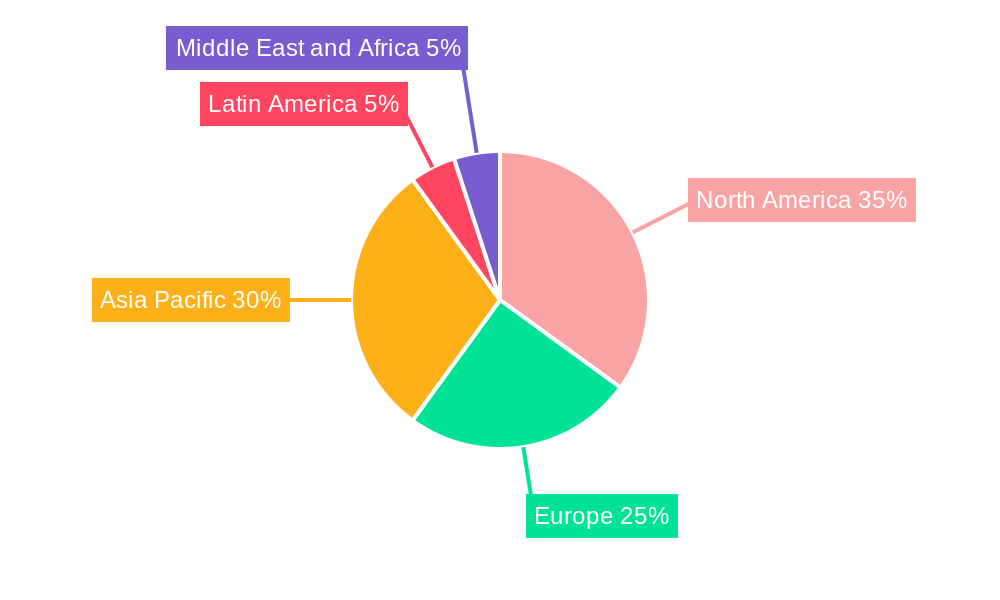
The North American region currently dominates the amphibious aircraft market, followed by Europe and Asia-Pacific. This dominance is largely attributed to factors such as robust economies, established general aviation infrastructure, and strong demand from both civilian and military sectors.
- Key Drivers in North America: Strong economic growth, well-developed aviation infrastructure, high disposable incomes supporting recreational flying, and significant military procurement.
- Key Drivers in Europe: High demand for amphibious aircraft from tourism and search and rescue operations, coupled with stringent safety regulations driving innovation.
- Key Drivers in Asia-Pacific: Rapid economic growth, rising tourism in coastal regions, and increasing military spending, contributing to market expansion.
The civilian segment holds a larger market share compared to the military segment, largely owing to the growth in recreational and tourism-related activities. In terms of engine type, the piston engine segment currently holds a larger market share due to lower cost, but the turboprop segment is expected to witness significant growth driven by demand for higher performance and longer range aircraft.
Amphibious Aircraft Market Product Developments
Recent product developments in the amphibious aircraft market focus on enhancing efficiency, safety, and versatility. Manufacturers are incorporating advanced materials, such as carbon fiber composites, to reduce weight and improve fuel economy. The integration of advanced avionics systems, including sophisticated flight control and navigation systems, is improving safety and operational efficiency. Improved designs for amphibious floats are leading to increased stability and reduced drag. These developments address various market needs, providing aircraft tailored for diverse applications, from personal recreational use to demanding search and rescue missions.
Report Scope & Segmentation Analysis
This report segments the amphibious aircraft market based on application (civilian and military) and engine type (piston and turboprop).
By Application:
Civilian: The civilian segment encompasses recreational, tourism, and commercial applications. This segment is projected to register significant growth during the forecast period, driven by increasing demand for recreational flying and tourism in remote areas. The market is expected to reach xx Million by 2033. Competitive dynamics are shaped by offerings varying in size, features, and price points.
Military: The military segment involves applications such as search and rescue, coastal patrol, and troop transport. Growth in this segment is driven by the need for versatile aircraft capable of operating in diverse environments. The segment is expected to reach xx Million by 2033 and is characterized by strict regulatory standards and competitive bidding processes.
By Engine Type:
Piston: The piston engine segment currently holds a larger market share due to lower cost and simpler maintenance. However, the segment's growth is expected to be slower compared to the turboprop segment.
Turboprop: The turboprop segment is expected to exhibit significant growth driven by the demand for higher performance, longer range, and improved fuel efficiency. This growth also reflects the increasing use of turboprop engines for military applications.
Key Drivers of Amphibious Aircraft Market Growth
Several factors are driving the growth of the amphibious aircraft market. These include the rising demand for versatile aircraft capable of operating in various terrains and environments, the increasing popularity of recreational flying and tourism in remote areas, and advancements in engine and materials technology, leading to improved fuel efficiency and performance. Government initiatives promoting tourism and infrastructure development in coastal regions are also contributing factors. Moreover, the growing need for efficient search and rescue operations and military applications are creating new opportunities.
Challenges in the Amphibious Aircraft Market Sector
The amphibious aircraft market faces challenges such as high initial costs, stringent regulatory requirements, and limited infrastructure in some regions. Supply chain disruptions also represent a significant hurdle in the production process. The intense competition among established and emerging players puts pressure on pricing and profitability. These factors collectively hinder market expansion and limit the overall growth potential. The estimated impact of these challenges is an average xx% reduction in expected annual sales from 2025 onwards.
Emerging Opportunities in Amphibious Aircraft Market
Emerging opportunities lie in the development of electric and hybrid-electric amphibious aircraft, offering significant advantages in terms of reduced emissions and operational costs. Expanding into new markets with developing aviation infrastructure, particularly in emerging economies, offers substantial growth potential. The rising demand for specialized applications, such as cargo transport and environmental monitoring, presents niche market opportunities. These emerging trends are estimated to positively impact market growth by xx% by 2033.
Leading Players in the Amphibious Aircraft Market Market
- MVP Aero
- ShinMaywa Industries Ltd
- Aviation Industry Corporation of China (AVIC)
- Viking Air Ltd
- FAULHABER MICROMO LLC
- Atol Avion
- Vickers Aircraft Company Limited
- LISA Airplanes
- United Aircraft Corporation
- Equator Aircraft AS
- Flywhale Aircraft GmbH & Co KG
- Aero Adventure LLC
- Seawings International
- ICON Aircraft Inc
Key Developments in Amphibious Aircraft Market Industry
- January 2023: MVP Aero announces the successful completion of its latest amphibious aircraft prototype.
- June 2022: Viking Air Ltd secures a significant contract for the supply of amphibious aircraft to a South American nation.
- October 2021: ShinMaywa Industries Ltd unveils a new design for improved amphibious floats.
- March 2020: Atol Avion secures funding for the development of a new hybrid-electric amphibious aircraft.
Strategic Outlook for Amphibious Aircraft Market Market
The future of the amphibious aircraft market looks promising, driven by continued technological advancements, increasing demand from diverse sectors, and the emergence of new markets. The focus on sustainability, with the development of electric and hybrid-electric aircraft, will significantly shape the market landscape. Companies that prioritize innovation, adapt to evolving regulatory environments, and cater to diverse end-user needs are expected to gain a strong competitive advantage. The market’s overall potential for growth is significant, particularly in regions with developing aviation infrastructure and growing tourism sectors.
Amphibious Aircraft Market Segmentation
- 1. Production Analysis
- 2. Consumption Analysis
- 3. Import Market Analysis (Value & Volume)
- 4. Export Market Analysis (Value & Volume)
- 5. Price Trend Analysis
Amphibious Aircraft Market Segmentation By Geography
-
1. North America
- 1.1. United States
- 1.2. Canada
- 1.3. Mexico
-
2. South America
- 2.1. Brazil
- 2.2. Argentina
- 2.3. Rest of South America
-
3. Europe
- 3.1. United Kingdom
- 3.2. Germany
- 3.3. France
- 3.4. Italy
- 3.5. Spain
- 3.6. Russia
- 3.7. Benelux
- 3.8. Nordics
- 3.9. Rest of Europe
-
4. Middle East & Africa
- 4.1. Turkey
- 4.2. Israel
- 4.3. GCC
- 4.4. North Africa
- 4.5. South Africa
- 4.6. Rest of Middle East & Africa
-
5. Asia Pacific
- 5.1. China
- 5.2. India
- 5.3. Japan
- 5.4. South Korea
- 5.5. ASEAN
- 5.6. Oceania
- 5.7. Rest of Asia Pacific
Amphibious Aircraft Market Regional Market Share
Geographic Coverage of Amphibious Aircraft Market
Amphibious Aircraft Market REPORT HIGHLIGHTS
| Aspects | Details |
|---|---|
| Study Period | 2020-2034 |
| Base Year | 2025 |
| Estimated Year | 2026 |
| Forecast Period | 2026-2034 |
| Historical Period | 2020-2025 |
| Growth Rate | CAGR of 9.89% from 2020-2034 |
| Segmentation |
|
Table of Contents
- 1. Introduction
- 1.1. Research Scope
- 1.2. Market Segmentation
- 1.3. Research Objective
- 1.4. Definitions and Assumptions
- 2. Executive Summary
- 2.1. Market Snapshot
- 3. Market Dynamics
- 3.1. Market Drivers
- 3.2. Market Restrains
- 3.3. Market Trends
- 3.4. Market Opportunities
- 4. Market Factor Analysis
- 4.1. Porters Five Forces
- 4.1.1. Bargaining Power of Suppliers
- 4.1.2. Bargaining Power of Buyers
- 4.1.3. Threat of New Entrants
- 4.1.4. Threat of Substitutes
- 4.1.5. Competitive Rivalry
- 4.2. PESTEL analysis
- 4.3. BCG Analysis
- 4.3.1. Stars (High Growth, High Market Share)
- 4.3.2. Cash Cows (Low Growth, High Market Share)
- 4.3.3. Question Mark (High Growth, Low Market Share)
- 4.3.4. Dogs (Low Growth, Low Market Share)
- 4.4. Ansoff Matrix Analysis
- 4.5. Supply Chain Analysis
- 4.6. Regulatory Landscape
- 4.7. Current Market Potential and Opportunity Assessment (TAM–SAM–SOM Framework)
- 4.8. RAX Analyst Note
- 4.1. Porters Five Forces
- 5. Market Analysis, Insights and Forecast 2021-2033
- 5.1. Market Analysis, Insights and Forecast - by Production Analysis
- 5.2. Market Analysis, Insights and Forecast - by Consumption Analysis
- 5.3. Market Analysis, Insights and Forecast - by Import Market Analysis (Value & Volume)
- 5.4. Market Analysis, Insights and Forecast - by Export Market Analysis (Value & Volume)
- 5.5. Market Analysis, Insights and Forecast - by Price Trend Analysis
- 5.6. Market Analysis, Insights and Forecast - by Region
- 5.6.1. North America
- 5.6.2. South America
- 5.6.3. Europe
- 5.6.4. Middle East & Africa
- 5.6.5. Asia Pacific
- 6. Global Amphibious Aircraft Market Analysis, Insights and Forecast, 2021-2033
- 6.1. Market Analysis, Insights and Forecast - by Production Analysis
- 6.2. Market Analysis, Insights and Forecast - by Consumption Analysis
- 6.3. Market Analysis, Insights and Forecast - by Import Market Analysis (Value & Volume)
- 6.4. Market Analysis, Insights and Forecast - by Export Market Analysis (Value & Volume)
- 6.5. Market Analysis, Insights and Forecast - by Price Trend Analysis
- 7. North America Amphibious Aircraft Market Analysis, Insights and Forecast, 2020-2032
- 7.1. Market Analysis, Insights and Forecast - by Production Analysis
- 7.2. Market Analysis, Insights and Forecast - by Consumption Analysis
- 7.3. Market Analysis, Insights and Forecast - by Import Market Analysis (Value & Volume)
- 7.4. Market Analysis, Insights and Forecast - by Export Market Analysis (Value & Volume)
- 7.5. Market Analysis, Insights and Forecast - by Price Trend Analysis
- 8. South America Amphibious Aircraft Market Analysis, Insights and Forecast, 2020-2032
- 8.1. Market Analysis, Insights and Forecast - by Production Analysis
- 8.2. Market Analysis, Insights and Forecast - by Consumption Analysis
- 8.3. Market Analysis, Insights and Forecast - by Import Market Analysis (Value & Volume)
- 8.4. Market Analysis, Insights and Forecast - by Export Market Analysis (Value & Volume)
- 8.5. Market Analysis, Insights and Forecast - by Price Trend Analysis
- 9. Europe Amphibious Aircraft Market Analysis, Insights and Forecast, 2020-2032
- 9.1. Market Analysis, Insights and Forecast - by Production Analysis
- 9.2. Market Analysis, Insights and Forecast - by Consumption Analysis
- 9.3. Market Analysis, Insights and Forecast - by Import Market Analysis (Value & Volume)
- 9.4. Market Analysis, Insights and Forecast - by Export Market Analysis (Value & Volume)
- 9.5. Market Analysis, Insights and Forecast - by Price Trend Analysis
- 10. Middle East & Africa Amphibious Aircraft Market Analysis, Insights and Forecast, 2020-2032
- 10.1. Market Analysis, Insights and Forecast - by Production Analysis
- 10.2. Market Analysis, Insights and Forecast - by Consumption Analysis
- 10.3. Market Analysis, Insights and Forecast - by Import Market Analysis (Value & Volume)
- 10.4. Market Analysis, Insights and Forecast - by Export Market Analysis (Value & Volume)
- 10.5. Market Analysis, Insights and Forecast - by Price Trend Analysis
- 11. Asia Pacific Amphibious Aircraft Market Analysis, Insights and Forecast, 2020-2032
- 11.1. Market Analysis, Insights and Forecast - by Production Analysis
- 11.2. Market Analysis, Insights and Forecast - by Consumption Analysis
- 11.3. Market Analysis, Insights and Forecast - by Import Market Analysis (Value & Volume)
- 11.4. Market Analysis, Insights and Forecast - by Export Market Analysis (Value & Volume)
- 11.5. Market Analysis, Insights and Forecast - by Price Trend Analysis
- 12. Competitive Analysis
- 12.1. Company Profiles
- 12.1.1 MVP Aero
- 12.1.1.1. Company Overview
- 12.1.1.2. Products
- 12.1.1.3. Company Financials
- 12.1.1.4. SWOT Analysis
- 12.1.2 ShinMaywa Industries Ltd
- 12.1.2.1. Company Overview
- 12.1.2.2. Products
- 12.1.2.3. Company Financials
- 12.1.2.4. SWOT Analysis
- 12.1.3 Aviation Industry Corporation of China (AVIC)
- 12.1.3.1. Company Overview
- 12.1.3.2. Products
- 12.1.3.3. Company Financials
- 12.1.3.4. SWOT Analysis
- 12.1.4 Viking Air Ltd
- 12.1.4.1. Company Overview
- 12.1.4.2. Products
- 12.1.4.3. Company Financials
- 12.1.4.4. SWOT Analysis
- 12.1.5 FAULHABER MICROMO LLC
- 12.1.5.1. Company Overview
- 12.1.5.2. Products
- 12.1.5.3. Company Financials
- 12.1.5.4. SWOT Analysis
- 12.1.6 Atol Avion
- 12.1.6.1. Company Overview
- 12.1.6.2. Products
- 12.1.6.3. Company Financials
- 12.1.6.4. SWOT Analysis
- 12.1.7 Vickers Aircraft Company Limited
- 12.1.7.1. Company Overview
- 12.1.7.2. Products
- 12.1.7.3. Company Financials
- 12.1.7.4. SWOT Analysis
- 12.1.8 LISA Airplanes
- 12.1.8.1. Company Overview
- 12.1.8.2. Products
- 12.1.8.3. Company Financials
- 12.1.8.4. SWOT Analysis
- 12.1.9 United Aircraft Corporation
- 12.1.9.1. Company Overview
- 12.1.9.2. Products
- 12.1.9.3. Company Financials
- 12.1.9.4. SWOT Analysis
- 12.1.10 Equator Aircraft AS
- 12.1.10.1. Company Overview
- 12.1.10.2. Products
- 12.1.10.3. Company Financials
- 12.1.10.4. SWOT Analysis
- 12.1.11 Flywhale Aircraft GmbH & Co KG
- 12.1.11.1. Company Overview
- 12.1.11.2. Products
- 12.1.11.3. Company Financials
- 12.1.11.4. SWOT Analysis
- 12.1.12 Aero Adventure LLC
- 12.1.12.1. Company Overview
- 12.1.12.2. Products
- 12.1.12.3. Company Financials
- 12.1.12.4. SWOT Analysis
- 12.1.13 Seawings International
- 12.1.13.1. Company Overview
- 12.1.13.2. Products
- 12.1.13.3. Company Financials
- 12.1.13.4. SWOT Analysis
- 12.1.14 ICON Aircraft Inc
- 12.1.14.1. Company Overview
- 12.1.14.2. Products
- 12.1.14.3. Company Financials
- 12.1.14.4. SWOT Analysis
- 12.1.1 MVP Aero
- 12.2. Market Entropy
- 12.2.1 Company's Key Areas Served
- 12.2.2 Recent Developments
- 12.3. Company Market Share Analysis 2025
- 12.3.1 Top 5 Companies Market Share Analysis
- 12.3.2 Top 3 Companies Market Share Analysis
- 12.4. List of Potential Customers
- 13. Research Methodology
List of Figures
- Figure 1: Global Amphibious Aircraft Market Revenue Breakdown (million, %) by Region 2025 & 2033
- Figure 2: North America Amphibious Aircraft Market Revenue (million), by Production Analysis 2025 & 2033
- Figure 3: North America Amphibious Aircraft Market Revenue Share (%), by Production Analysis 2025 & 2033
- Figure 4: North America Amphibious Aircraft Market Revenue (million), by Consumption Analysis 2025 & 2033
- Figure 5: North America Amphibious Aircraft Market Revenue Share (%), by Consumption Analysis 2025 & 2033
- Figure 6: North America Amphibious Aircraft Market Revenue (million), by Import Market Analysis (Value & Volume) 2025 & 2033
- Figure 7: North America Amphibious Aircraft Market Revenue Share (%), by Import Market Analysis (Value & Volume) 2025 & 2033
- Figure 8: North America Amphibious Aircraft Market Revenue (million), by Export Market Analysis (Value & Volume) 2025 & 2033
- Figure 9: North America Amphibious Aircraft Market Revenue Share (%), by Export Market Analysis (Value & Volume) 2025 & 2033
- Figure 10: North America Amphibious Aircraft Market Revenue (million), by Price Trend Analysis 2025 & 2033
- Figure 11: North America Amphibious Aircraft Market Revenue Share (%), by Price Trend Analysis 2025 & 2033
- Figure 12: North America Amphibious Aircraft Market Revenue (million), by Country 2025 & 2033
- Figure 13: North America Amphibious Aircraft Market Revenue Share (%), by Country 2025 & 2033
- Figure 14: South America Amphibious Aircraft Market Revenue (million), by Production Analysis 2025 & 2033
- Figure 15: South America Amphibious Aircraft Market Revenue Share (%), by Production Analysis 2025 & 2033
- Figure 16: South America Amphibious Aircraft Market Revenue (million), by Consumption Analysis 2025 & 2033
- Figure 17: South America Amphibious Aircraft Market Revenue Share (%), by Consumption Analysis 2025 & 2033
- Figure 18: South America Amphibious Aircraft Market Revenue (million), by Import Market Analysis (Value & Volume) 2025 & 2033
- Figure 19: South America Amphibious Aircraft Market Revenue Share (%), by Import Market Analysis (Value & Volume) 2025 & 2033
- Figure 20: South America Amphibious Aircraft Market Revenue (million), by Export Market Analysis (Value & Volume) 2025 & 2033
- Figure 21: South America Amphibious Aircraft Market Revenue Share (%), by Export Market Analysis (Value & Volume) 2025 & 2033
- Figure 22: South America Amphibious Aircraft Market Revenue (million), by Price Trend Analysis 2025 & 2033
- Figure 23: South America Amphibious Aircraft Market Revenue Share (%), by Price Trend Analysis 2025 & 2033
- Figure 24: South America Amphibious Aircraft Market Revenue (million), by Country 2025 & 2033
- Figure 25: South America Amphibious Aircraft Market Revenue Share (%), by Country 2025 & 2033
- Figure 26: Europe Amphibious Aircraft Market Revenue (million), by Production Analysis 2025 & 2033
- Figure 27: Europe Amphibious Aircraft Market Revenue Share (%), by Production Analysis 2025 & 2033
- Figure 28: Europe Amphibious Aircraft Market Revenue (million), by Consumption Analysis 2025 & 2033
- Figure 29: Europe Amphibious Aircraft Market Revenue Share (%), by Consumption Analysis 2025 & 2033
- Figure 30: Europe Amphibious Aircraft Market Revenue (million), by Import Market Analysis (Value & Volume) 2025 & 2033
- Figure 31: Europe Amphibious Aircraft Market Revenue Share (%), by Import Market Analysis (Value & Volume) 2025 & 2033
- Figure 32: Europe Amphibious Aircraft Market Revenue (million), by Export Market Analysis (Value & Volume) 2025 & 2033
- Figure 33: Europe Amphibious Aircraft Market Revenue Share (%), by Export Market Analysis (Value & Volume) 2025 & 2033
- Figure 34: Europe Amphibious Aircraft Market Revenue (million), by Price Trend Analysis 2025 & 2033
- Figure 35: Europe Amphibious Aircraft Market Revenue Share (%), by Price Trend Analysis 2025 & 2033
- Figure 36: Europe Amphibious Aircraft Market Revenue (million), by Country 2025 & 2033
- Figure 37: Europe Amphibious Aircraft Market Revenue Share (%), by Country 2025 & 2033
- Figure 38: Middle East & Africa Amphibious Aircraft Market Revenue (million), by Production Analysis 2025 & 2033
- Figure 39: Middle East & Africa Amphibious Aircraft Market Revenue Share (%), by Production Analysis 2025 & 2033
- Figure 40: Middle East & Africa Amphibious Aircraft Market Revenue (million), by Consumption Analysis 2025 & 2033
- Figure 41: Middle East & Africa Amphibious Aircraft Market Revenue Share (%), by Consumption Analysis 2025 & 2033
- Figure 42: Middle East & Africa Amphibious Aircraft Market Revenue (million), by Import Market Analysis (Value & Volume) 2025 & 2033
- Figure 43: Middle East & Africa Amphibious Aircraft Market Revenue Share (%), by Import Market Analysis (Value & Volume) 2025 & 2033
- Figure 44: Middle East & Africa Amphibious Aircraft Market Revenue (million), by Export Market Analysis (Value & Volume) 2025 & 2033
- Figure 45: Middle East & Africa Amphibious Aircraft Market Revenue Share (%), by Export Market Analysis (Value & Volume) 2025 & 2033
- Figure 46: Middle East & Africa Amphibious Aircraft Market Revenue (million), by Price Trend Analysis 2025 & 2033
- Figure 47: Middle East & Africa Amphibious Aircraft Market Revenue Share (%), by Price Trend Analysis 2025 & 2033
- Figure 48: Middle East & Africa Amphibious Aircraft Market Revenue (million), by Country 2025 & 2033
- Figure 49: Middle East & Africa Amphibious Aircraft Market Revenue Share (%), by Country 2025 & 2033
- Figure 50: Asia Pacific Amphibious Aircraft Market Revenue (million), by Production Analysis 2025 & 2033
- Figure 51: Asia Pacific Amphibious Aircraft Market Revenue Share (%), by Production Analysis 2025 & 2033
- Figure 52: Asia Pacific Amphibious Aircraft Market Revenue (million), by Consumption Analysis 2025 & 2033
- Figure 53: Asia Pacific Amphibious Aircraft Market Revenue Share (%), by Consumption Analysis 2025 & 2033
- Figure 54: Asia Pacific Amphibious Aircraft Market Revenue (million), by Import Market Analysis (Value & Volume) 2025 & 2033
- Figure 55: Asia Pacific Amphibious Aircraft Market Revenue Share (%), by Import Market Analysis (Value & Volume) 2025 & 2033
- Figure 56: Asia Pacific Amphibious Aircraft Market Revenue (million), by Export Market Analysis (Value & Volume) 2025 & 2033
- Figure 57: Asia Pacific Amphibious Aircraft Market Revenue Share (%), by Export Market Analysis (Value & Volume) 2025 & 2033
- Figure 58: Asia Pacific Amphibious Aircraft Market Revenue (million), by Price Trend Analysis 2025 & 2033
- Figure 59: Asia Pacific Amphibious Aircraft Market Revenue Share (%), by Price Trend Analysis 2025 & 2033
- Figure 60: Asia Pacific Amphibious Aircraft Market Revenue (million), by Country 2025 & 2033
- Figure 61: Asia Pacific Amphibious Aircraft Market Revenue Share (%), by Country 2025 & 2033
List of Tables
- Table 1: Global Amphibious Aircraft Market Revenue million Forecast, by Production Analysis 2020 & 2033
- Table 2: Global Amphibious Aircraft Market Revenue million Forecast, by Consumption Analysis 2020 & 2033
- Table 3: Global Amphibious Aircraft Market Revenue million Forecast, by Import Market Analysis (Value & Volume) 2020 & 2033
- Table 4: Global Amphibious Aircraft Market Revenue million Forecast, by Export Market Analysis (Value & Volume) 2020 & 2033
- Table 5: Global Amphibious Aircraft Market Revenue million Forecast, by Price Trend Analysis 2020 & 2033
- Table 6: Global Amphibious Aircraft Market Revenue million Forecast, by Region 2020 & 2033
- Table 7: Global Amphibious Aircraft Market Revenue million Forecast, by Production Analysis 2020 & 2033
- Table 8: Global Amphibious Aircraft Market Revenue million Forecast, by Consumption Analysis 2020 & 2033
- Table 9: Global Amphibious Aircraft Market Revenue million Forecast, by Import Market Analysis (Value & Volume) 2020 & 2033
- Table 10: Global Amphibious Aircraft Market Revenue million Forecast, by Export Market Analysis (Value & Volume) 2020 & 2033
- Table 11: Global Amphibious Aircraft Market Revenue million Forecast, by Price Trend Analysis 2020 & 2033
- Table 12: Global Amphibious Aircraft Market Revenue million Forecast, by Country 2020 & 2033
- Table 13: United States Amphibious Aircraft Market Revenue (million) Forecast, by Application 2020 & 2033
- Table 14: Canada Amphibious Aircraft Market Revenue (million) Forecast, by Application 2020 & 2033
- Table 15: Mexico Amphibious Aircraft Market Revenue (million) Forecast, by Application 2020 & 2033
- Table 16: Global Amphibious Aircraft Market Revenue million Forecast, by Production Analysis 2020 & 2033
- Table 17: Global Amphibious Aircraft Market Revenue million Forecast, by Consumption Analysis 2020 & 2033
- Table 18: Global Amphibious Aircraft Market Revenue million Forecast, by Import Market Analysis (Value & Volume) 2020 & 2033
- Table 19: Global Amphibious Aircraft Market Revenue million Forecast, by Export Market Analysis (Value & Volume) 2020 & 2033
- Table 20: Global Amphibious Aircraft Market Revenue million Forecast, by Price Trend Analysis 2020 & 2033
- Table 21: Global Amphibious Aircraft Market Revenue million Forecast, by Country 2020 & 2033
- Table 22: Brazil Amphibious Aircraft Market Revenue (million) Forecast, by Application 2020 & 2033
- Table 23: Argentina Amphibious Aircraft Market Revenue (million) Forecast, by Application 2020 & 2033
- Table 24: Rest of South America Amphibious Aircraft Market Revenue (million) Forecast, by Application 2020 & 2033
- Table 25: Global Amphibious Aircraft Market Revenue million Forecast, by Production Analysis 2020 & 2033
- Table 26: Global Amphibious Aircraft Market Revenue million Forecast, by Consumption Analysis 2020 & 2033
- Table 27: Global Amphibious Aircraft Market Revenue million Forecast, by Import Market Analysis (Value & Volume) 2020 & 2033
- Table 28: Global Amphibious Aircraft Market Revenue million Forecast, by Export Market Analysis (Value & Volume) 2020 & 2033
- Table 29: Global Amphibious Aircraft Market Revenue million Forecast, by Price Trend Analysis 2020 & 2033
- Table 30: Global Amphibious Aircraft Market Revenue million Forecast, by Country 2020 & 2033
- Table 31: United Kingdom Amphibious Aircraft Market Revenue (million) Forecast, by Application 2020 & 2033
- Table 32: Germany Amphibious Aircraft Market Revenue (million) Forecast, by Application 2020 & 2033
- Table 33: France Amphibious Aircraft Market Revenue (million) Forecast, by Application 2020 & 2033
- Table 34: Italy Amphibious Aircraft Market Revenue (million) Forecast, by Application 2020 & 2033
- Table 35: Spain Amphibious Aircraft Market Revenue (million) Forecast, by Application 2020 & 2033
- Table 36: Russia Amphibious Aircraft Market Revenue (million) Forecast, by Application 2020 & 2033
- Table 37: Benelux Amphibious Aircraft Market Revenue (million) Forecast, by Application 2020 & 2033
- Table 38: Nordics Amphibious Aircraft Market Revenue (million) Forecast, by Application 2020 & 2033
- Table 39: Rest of Europe Amphibious Aircraft Market Revenue (million) Forecast, by Application 2020 & 2033
- Table 40: Global Amphibious Aircraft Market Revenue million Forecast, by Production Analysis 2020 & 2033
- Table 41: Global Amphibious Aircraft Market Revenue million Forecast, by Consumption Analysis 2020 & 2033
- Table 42: Global Amphibious Aircraft Market Revenue million Forecast, by Import Market Analysis (Value & Volume) 2020 & 2033
- Table 43: Global Amphibious Aircraft Market Revenue million Forecast, by Export Market Analysis (Value & Volume) 2020 & 2033
- Table 44: Global Amphibious Aircraft Market Revenue million Forecast, by Price Trend Analysis 2020 & 2033
- Table 45: Global Amphibious Aircraft Market Revenue million Forecast, by Country 2020 & 2033
- Table 46: Turkey Amphibious Aircraft Market Revenue (million) Forecast, by Application 2020 & 2033
- Table 47: Israel Amphibious Aircraft Market Revenue (million) Forecast, by Application 2020 & 2033
- Table 48: GCC Amphibious Aircraft Market Revenue (million) Forecast, by Application 2020 & 2033
- Table 49: North Africa Amphibious Aircraft Market Revenue (million) Forecast, by Application 2020 & 2033
- Table 50: South Africa Amphibious Aircraft Market Revenue (million) Forecast, by Application 2020 & 2033
- Table 51: Rest of Middle East & Africa Amphibious Aircraft Market Revenue (million) Forecast, by Application 2020 & 2033
- Table 52: Global Amphibious Aircraft Market Revenue million Forecast, by Production Analysis 2020 & 2033
- Table 53: Global Amphibious Aircraft Market Revenue million Forecast, by Consumption Analysis 2020 & 2033
- Table 54: Global Amphibious Aircraft Market Revenue million Forecast, by Import Market Analysis (Value & Volume) 2020 & 2033
- Table 55: Global Amphibious Aircraft Market Revenue million Forecast, by Export Market Analysis (Value & Volume) 2020 & 2033
- Table 56: Global Amphibious Aircraft Market Revenue million Forecast, by Price Trend Analysis 2020 & 2033
- Table 57: Global Amphibious Aircraft Market Revenue million Forecast, by Country 2020 & 2033
- Table 58: China Amphibious Aircraft Market Revenue (million) Forecast, by Application 2020 & 2033
- Table 59: India Amphibious Aircraft Market Revenue (million) Forecast, by Application 2020 & 2033
- Table 60: Japan Amphibious Aircraft Market Revenue (million) Forecast, by Application 2020 & 2033
- Table 61: South Korea Amphibious Aircraft Market Revenue (million) Forecast, by Application 2020 & 2033
- Table 62: ASEAN Amphibious Aircraft Market Revenue (million) Forecast, by Application 2020 & 2033
- Table 63: Oceania Amphibious Aircraft Market Revenue (million) Forecast, by Application 2020 & 2033
- Table 64: Rest of Asia Pacific Amphibious Aircraft Market Revenue (million) Forecast, by Application 2020 & 2033
Frequently Asked Questions
1. What is the projected Compound Annual Growth Rate (CAGR) of the Amphibious Aircraft Market?
The projected CAGR is approximately 9.89%.
2. Which companies are prominent players in the Amphibious Aircraft Market?
Key companies in the market include MVP Aero, ShinMaywa Industries Ltd, Aviation Industry Corporation of China (AVIC), Viking Air Ltd, FAULHABER MICROMO LLC, Atol Avion, Vickers Aircraft Company Limited, LISA Airplanes, United Aircraft Corporation, Equator Aircraft AS, Flywhale Aircraft GmbH & Co KG, Aero Adventure LLC, Seawings International, ICON Aircraft Inc.
3. What are the main segments of the Amphibious Aircraft Market?
The market segments include Production Analysis, Consumption Analysis, Import Market Analysis (Value & Volume), Export Market Analysis (Value & Volume), Price Trend Analysis.
4. Can you provide details about the market size?
The market size is estimated to be USD 283.79 million as of 2022.
5. What are some drivers contributing to market growth?
Increase in Internet of Things (IoT) and Autonomous Systems; Rise in Demand for Military and Defense Satellite Communication Solutions.
6. What are the notable trends driving market growth?
Military Segment of the Market is Expected to Witness Decent Growth Rate During the Forecast Period.
7. Are there any restraints impacting market growth?
Cybersecurity Threats to Satellite Communication; Interference in Transmission of Data.
8. Can you provide examples of recent developments in the market?
N/A
9. What pricing options are available for accessing the report?
Pricing options include single-user, multi-user, and enterprise licenses priced at USD 4750, USD 5250, and USD 8750 respectively.
10. Is the market size provided in terms of value or volume?
The market size is provided in terms of value, measured in million.
11. Are there any specific market keywords associated with the report?
Yes, the market keyword associated with the report is "Amphibious Aircraft Market," which aids in identifying and referencing the specific market segment covered.
12. How do I determine which pricing option suits my needs best?
The pricing options vary based on user requirements and access needs. Individual users may opt for single-user licenses, while businesses requiring broader access may choose multi-user or enterprise licenses for cost-effective access to the report.
13. Are there any additional resources or data provided in the Amphibious Aircraft Market report?
While the report offers comprehensive insights, it's advisable to review the specific contents or supplementary materials provided to ascertain if additional resources or data are available.
14. How can I stay updated on further developments or reports in the Amphibious Aircraft Market?
To stay informed about further developments, trends, and reports in the Amphibious Aircraft Market, consider subscribing to industry newsletters, following relevant companies and organizations, or regularly checking reputable industry news sources and publications.
Methodology
Step 1 - Identification of Relevant Samples Size from Population Database


Step 2 - Approaches for Defining Global Market Size (Value, Volume* & Price*)

Note*: In applicable scenarios
Step 3 - Data Sources
Primary Research
- Web Analytics
- Survey Reports
- Research Institute
- Latest Research Reports
- Opinion Leaders
Secondary Research
- Annual Reports
- White Paper
- Latest Press Release
- Industry Association
- Paid Database
- Investor Presentations

Step 4 - Data Triangulation
Involves using different sources of information in order to increase the validity of a study
These sources are likely to be stakeholders in a program - participants, other researchers, program staff, other community members, and so on.
Then we put all data in single framework & apply various statistical tools to find out the dynamic on the market.
During the analysis stage, feedback from the stakeholder groups would be compared to determine areas of agreement as well as areas of divergence