

Key Insights
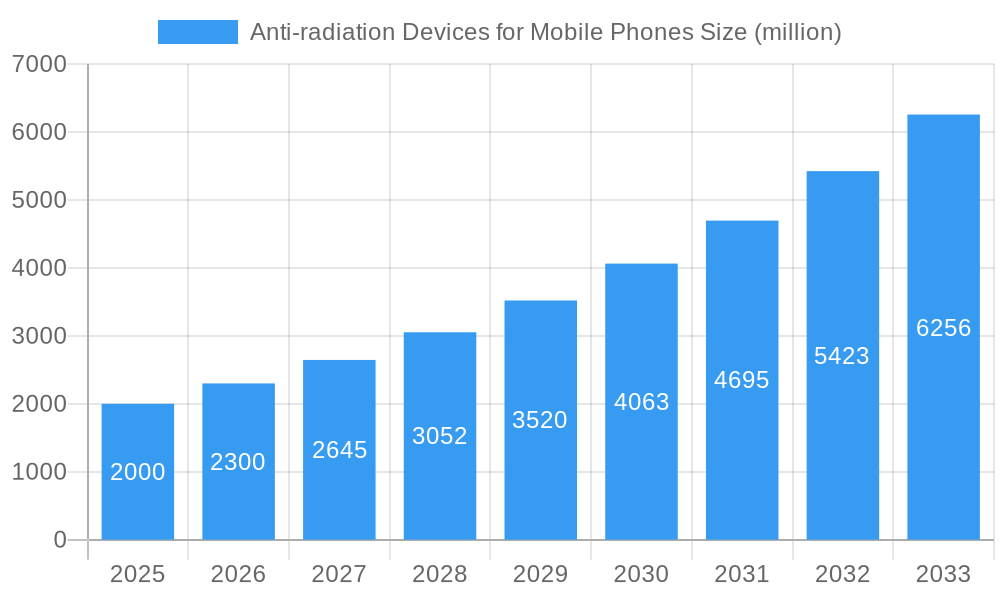
The global anti-radiation device market for mobile phones is poised for significant expansion, driven by heightened consumer awareness of electromagnetic radiation (EMR) risks associated with smartphones. The market, valued at $13.33 billion in the base year of 2025, is projected to achieve a robust Compound Annual Growth Rate (CAGR) of 15.99% between 2025 and 2033. This sustained growth is attributed to increasing smartphone adoption, amplified health consciousness regarding EMR, and the expanding array of protective solutions including cases, stickers, and shields. Product innovation, featuring advanced shielding materials and enhanced aesthetics, is also a key market driver. Market segmentation by product type further supports diverse consumer needs and market penetration.
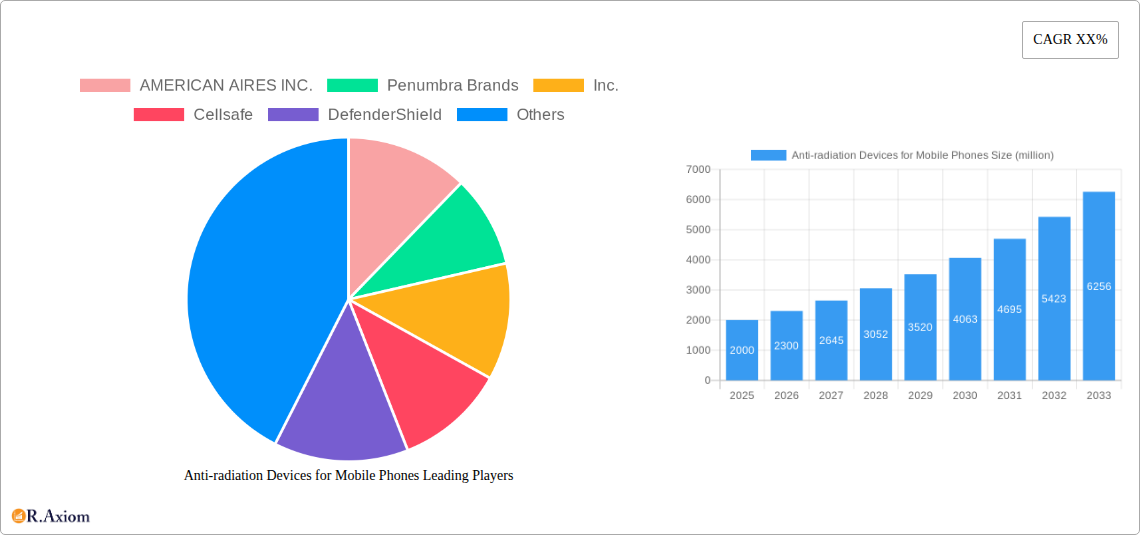
Anti-radiation Devices for Mobile Phones Market Size (In Billion)
Despite positive growth trajectories, the market faces certain constraints. Consumer skepticism regarding the proven efficacy of anti-radiation devices and the premium pricing of some advanced solutions present adoption hurdles. Varying regional regulations for product marketing and labeling also add complexity. Nevertheless, the escalating demand for health-conscious products and continuous advancements in EMF shielding technologies are anticipated to fuel continued market growth. Key industry players, such as AMERICAN AIRES INC. and Penumbra Brands, Inc., are at the forefront of innovation, adapting to evolving consumer preferences and regulatory landscapes.
Anti-radiation Devices for Mobile Phones Company Market Share
Anti-Radiation Devices for Mobile Phones Market Report: 2019-2033
This comprehensive report provides an in-depth analysis of the global anti-radiation devices for mobile phones market, offering invaluable insights for industry stakeholders, investors, and researchers. The study period spans from 2019 to 2033, with 2025 serving as both the base and estimated year. The forecast period covers 2025-2033, while the historical period encompasses 2019-2024. The report analyzes market dynamics, competitive landscape, growth drivers, and emerging opportunities, utilizing data-driven analysis and projections to paint a comprehensive picture of this evolving market. Key companies included in this analysis are AMERICAN AIRES INC., Penumbra Brands, Inc., Cellsafe, DefenderShield, Syenergy Environics, Tech Wellness, Aires Tech, RadiArmor, RF Safe Corporation, SafeSleeve Anti-Radiation Cases, and Waves Protect Corp. The report projects a market size of xx million by 2033.
Anti-radiation Devices for Mobile Phones Market Concentration & Innovation
The anti-radiation devices for mobile phones market exhibits a moderately fragmented landscape. While a few key players dominate significant market share, numerous smaller companies and startups contribute to the overall market dynamics. Market concentration is expected to shift slightly towards consolidation in the coming years, driven by mergers and acquisitions (M&A) activities. Several factors contribute to this dynamic, including the increasing demand for innovative products, stringent regulatory frameworks, and the need for companies to expand their product portfolios and geographic reach.
- Market Share: The top five players account for an estimated xx% of the global market share in 2025.
- M&A Activity: The past five years have witnessed a surge in M&A activity, with deal values exceeding $xx million. These acquisitions have primarily been focused on expanding product lines and accessing new markets.
- Innovation Drivers: Consumer demand for enhanced safety and health features is driving innovation in materials, designs, and functionalities of anti-radiation devices. Technological advancements in shielding materials and miniaturization are key drivers.
- Regulatory Frameworks: Government regulations related to electromagnetic field (EMF) exposure are influencing product development and market entry. Compliance with these regulations is crucial for market success.
- Product Substitutes: Limited viable substitutes exist for anti-radiation devices. However, alternatives like reducing phone usage or choosing phones with lower SAR ratings are gaining traction.
- End-User Trends: The increasing awareness about the potential health risks associated with EMF exposure is driving demand amongst health-conscious consumers.
Anti-radiation Devices for Mobile Phones Industry Trends & Insights
The global anti-radiation devices for mobile phones market is experiencing significant growth, driven by escalating health concerns related to prolonged mobile phone usage. This trend is supported by rising smartphone penetration across the globe and increased awareness of potential health risks associated with EMF radiation. The market is characterized by a steady Compound Annual Growth Rate (CAGR) of xx% during the forecast period. Market penetration, while still relatively low in many regions, is expected to increase significantly due to heightened consumer awareness and technological advancements. The market is witnessing technological disruptions with the emergence of new materials and shielding technologies. Consumer preferences are shifting towards sleek designs, seamless integration with existing devices, and advanced features offering enhanced protection.
Dominant Markets & Segments in Anti-radiation Devices for Mobile Phones
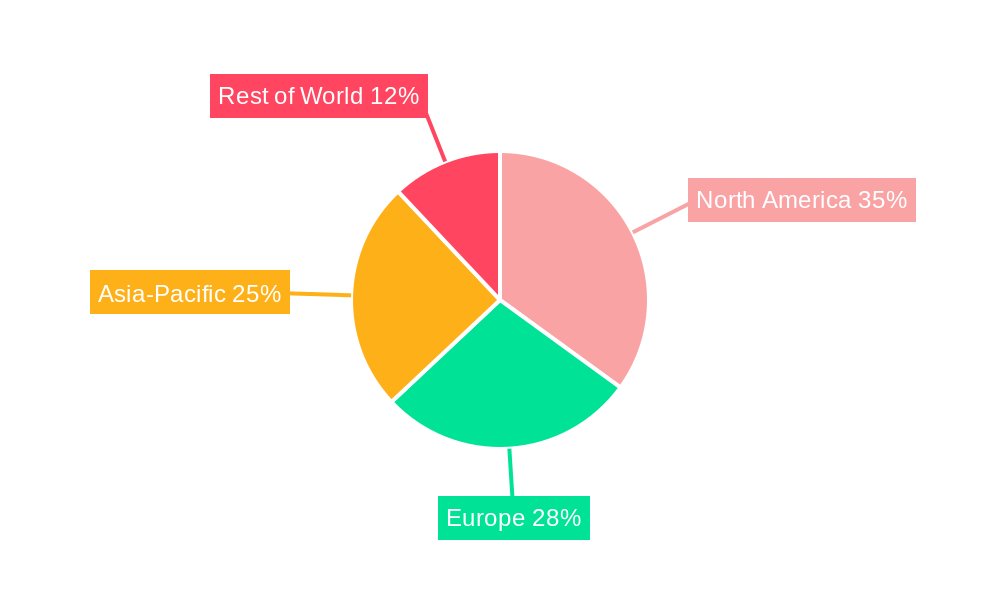
The North American market holds the dominant position in the global anti-radiation devices for mobile phones market, driven by high smartphone penetration, strong regulatory frameworks, and increased consumer awareness. European markets are also exhibiting robust growth. Key drivers fueling this dominance include:
- Strong Economic Conditions: High disposable incomes enable consumers to invest in these protective devices.
- Robust Infrastructure: Well-developed distribution networks facilitate wider market reach.
- Stringent Regulatory Frameworks: Regulations addressing EMF emissions are pushing the adoption of anti-radiation devices.
- High Consumer Awareness: Public awareness campaigns on the health effects of EMF radiation have played a crucial role.
Detailed analysis shows that the North American market holds xx% of the global market share in 2025, driven by high disposable income and the presence of several key market players.
Anti-radiation Devices for Mobile Phones Product Developments
Recent product innovations focus on enhancing shielding effectiveness, improving aesthetics, and integrating additional functionalities. Companies are incorporating advanced materials like carbon fiber and specialized polymers to boost radiation protection. Moreover, integrating anti-radiation features into existing products, such as phone cases and accessories, increases market appeal and convenience. These developments significantly enhance the competitive landscape, making the devices more attractive and effective.
Report Scope & Segmentation Analysis
This report segments the market based on device type (cases, stickers, pouches), material (carbon fiber, silver-coated fabrics), and end-user (individuals, organizations). Each segment is analyzed based on its market size, growth projections, and competitive dynamics. Growth projections for each segment vary depending on specific factors influencing each market sector. For instance, the case segment is projected to have a CAGR of xx%, driven by convenience and aesthetic appeal, whereas the pouches segment's growth is expected to be moderately slower due to perceived bulkiness.
Key Drivers of Anti-radiation Devices for Mobile Phones Growth
Several factors contribute to the market's growth. Firstly, increasing concerns about the potential health effects of long-term mobile phone exposure are driving demand. Secondly, advancements in shielding materials and technologies continue to improve device effectiveness. Thirdly, government regulations and public awareness campaigns are contributing to increased adoption.
Challenges in the Anti-radiation Devices for Mobile Phones Sector
The market faces challenges such as the lack of conclusive scientific evidence regarding EMF radiation's long-term effects. Supply chain disruptions impacting raw material availability can cause price fluctuations. Intense competition among numerous players requires constant innovation and product differentiation. Regulatory inconsistencies across different regions impose compliance challenges for manufacturers.
Emerging Opportunities in Anti-radiation Devices for Mobile Phones
Emerging opportunities include expanding into new markets with rising smartphone penetration rates. The development of innovative products tailored to specific end-user segments like children and pregnant women presents a significant market opportunity. Integration of anti-radiation technology into other electronic devices beyond mobile phones offers significant growth potential.
Leading Players in the Anti-radiation Devices for Mobile Phones Market
- AMERICAN AIRES INC.
- Penumbra Brands, Inc.
- Cellsafe
- DefenderShield
- Syenergy Environics
- Tech Wellness
- Aires Tech
- RadiArmor
- RF Safe Corporation
- SafeSleeve Anti-Radiation Cases
- Waves Protect Corp.
Key Developments in Anti-radiation Devices for Mobile Phones Industry
- 2022-Q4: DefenderShield launched a new range of anti-radiation phone cases incorporating advanced shielding materials.
- 2023-Q1: Aires Tech announced a strategic partnership with a major mobile phone accessory retailer, expanding its market reach.
- 2023-Q3: Several industry players initiated collaborative efforts to establish standardized testing procedures for anti-radiation devices.
Strategic Outlook for Anti-radiation Devices for Mobile Phones Market
The market is poised for sustained growth fueled by increasing consumer awareness, technological advancements, and stringent regulatory frameworks. Opportunities lie in developing innovative solutions, expanding into new markets, and establishing strong brand identities. Strategic partnerships and acquisitions will play a crucial role in shaping the future competitive landscape of this industry.
Anti-radiation Devices for Mobile Phones Segmentation
-
1. Application
- 1.1. Online Retail
- 1.2. Offline Retail
-
2. Types
- 2.1. Chip
- 2.2. Sticker
- 2.3. Case
- 2.4. Others
Anti-radiation Devices for Mobile Phones Segmentation By Geography
-
1. North America
- 1.1. United States
- 1.2. Canada
- 1.3. Mexico
-
2. South America
- 2.1. Brazil
- 2.2. Argentina
- 2.3. Rest of South America
-
3. Europe
- 3.1. United Kingdom
- 3.2. Germany
- 3.3. France
- 3.4. Italy
- 3.5. Spain
- 3.6. Russia
- 3.7. Benelux
- 3.8. Nordics
- 3.9. Rest of Europe
-
4. Middle East & Africa
- 4.1. Turkey
- 4.2. Israel
- 4.3. GCC
- 4.4. North Africa
- 4.5. South Africa
- 4.6. Rest of Middle East & Africa
-
5. Asia Pacific
- 5.1. China
- 5.2. India
- 5.3. Japan
- 5.4. South Korea
- 5.5. ASEAN
- 5.6. Oceania
- 5.7. Rest of Asia Pacific
Anti-radiation Devices for Mobile Phones Regional Market Share
Geographic Coverage of Anti-radiation Devices for Mobile Phones
Anti-radiation Devices for Mobile Phones REPORT HIGHLIGHTS
| Aspects | Details |
|---|---|
| Study Period | 2020-2034 |
| Base Year | 2025 |
| Estimated Year | 2026 |
| Forecast Period | 2026-2034 |
| Historical Period | 2020-2025 |
| Growth Rate | CAGR of 15.99% from 2020-2034 |
| Segmentation |
|
Table of Contents
- 1. Introduction
- 1.1. Research Scope
- 1.2. Market Segmentation
- 1.3. Research Methodology
- 1.4. Definitions and Assumptions
- 2. Executive Summary
- 2.1. Introduction
- 3. Market Dynamics
- 3.1. Introduction
- 3.2. Market Drivers
- 3.3. Market Restrains
- 3.4. Market Trends
- 4. Market Factor Analysis
- 4.1. Porters Five Forces
- 4.2. Supply/Value Chain
- 4.3. PESTEL analysis
- 4.4. Market Entropy
- 4.5. Patent/Trademark Analysis
- 5. Global Anti-radiation Devices for Mobile Phones Analysis, Insights and Forecast, 2020-2032
- 5.1. Market Analysis, Insights and Forecast - by Application
- 5.1.1. Online Retail
- 5.1.2. Offline Retail
- 5.2. Market Analysis, Insights and Forecast - by Types
- 5.2.1. Chip
- 5.2.2. Sticker
- 5.2.3. Case
- 5.2.4. Others
- 5.3. Market Analysis, Insights and Forecast - by Region
- 5.3.1. North America
- 5.3.2. South America
- 5.3.3. Europe
- 5.3.4. Middle East & Africa
- 5.3.5. Asia Pacific
- 5.1. Market Analysis, Insights and Forecast - by Application
- 6. North America Anti-radiation Devices for Mobile Phones Analysis, Insights and Forecast, 2020-2032
- 6.1. Market Analysis, Insights and Forecast - by Application
- 6.1.1. Online Retail
- 6.1.2. Offline Retail
- 6.2. Market Analysis, Insights and Forecast - by Types
- 6.2.1. Chip
- 6.2.2. Sticker
- 6.2.3. Case
- 6.2.4. Others
- 6.1. Market Analysis, Insights and Forecast - by Application
- 7. South America Anti-radiation Devices for Mobile Phones Analysis, Insights and Forecast, 2020-2032
- 7.1. Market Analysis, Insights and Forecast - by Application
- 7.1.1. Online Retail
- 7.1.2. Offline Retail
- 7.2. Market Analysis, Insights and Forecast - by Types
- 7.2.1. Chip
- 7.2.2. Sticker
- 7.2.3. Case
- 7.2.4. Others
- 7.1. Market Analysis, Insights and Forecast - by Application
- 8. Europe Anti-radiation Devices for Mobile Phones Analysis, Insights and Forecast, 2020-2032
- 8.1. Market Analysis, Insights and Forecast - by Application
- 8.1.1. Online Retail
- 8.1.2. Offline Retail
- 8.2. Market Analysis, Insights and Forecast - by Types
- 8.2.1. Chip
- 8.2.2. Sticker
- 8.2.3. Case
- 8.2.4. Others
- 8.1. Market Analysis, Insights and Forecast - by Application
- 9. Middle East & Africa Anti-radiation Devices for Mobile Phones Analysis, Insights and Forecast, 2020-2032
- 9.1. Market Analysis, Insights and Forecast - by Application
- 9.1.1. Online Retail
- 9.1.2. Offline Retail
- 9.2. Market Analysis, Insights and Forecast - by Types
- 9.2.1. Chip
- 9.2.2. Sticker
- 9.2.3. Case
- 9.2.4. Others
- 9.1. Market Analysis, Insights and Forecast - by Application
- 10. Asia Pacific Anti-radiation Devices for Mobile Phones Analysis, Insights and Forecast, 2020-2032
- 10.1. Market Analysis, Insights and Forecast - by Application
- 10.1.1. Online Retail
- 10.1.2. Offline Retail
- 10.2. Market Analysis, Insights and Forecast - by Types
- 10.2.1. Chip
- 10.2.2. Sticker
- 10.2.3. Case
- 10.2.4. Others
- 10.1. Market Analysis, Insights and Forecast - by Application
- 11. Competitive Analysis
- 11.1. Global Market Share Analysis 2025
- 11.2. Company Profiles
- 11.2.1 AMERICAN AIRES INC.
- 11.2.1.1. Overview
- 11.2.1.2. Products
- 11.2.1.3. SWOT Analysis
- 11.2.1.4. Recent Developments
- 11.2.1.5. Financials (Based on Availability)
- 11.2.2 Penumbra Brands
- 11.2.2.1. Overview
- 11.2.2.2. Products
- 11.2.2.3. SWOT Analysis
- 11.2.2.4. Recent Developments
- 11.2.2.5. Financials (Based on Availability)
- 11.2.3 Inc.
- 11.2.3.1. Overview
- 11.2.3.2. Products
- 11.2.3.3. SWOT Analysis
- 11.2.3.4. Recent Developments
- 11.2.3.5. Financials (Based on Availability)
- 11.2.4 Cellsafe
- 11.2.4.1. Overview
- 11.2.4.2. Products
- 11.2.4.3. SWOT Analysis
- 11.2.4.4. Recent Developments
- 11.2.4.5. Financials (Based on Availability)
- 11.2.5 DefenderShield
- 11.2.5.1. Overview
- 11.2.5.2. Products
- 11.2.5.3. SWOT Analysis
- 11.2.5.4. Recent Developments
- 11.2.5.5. Financials (Based on Availability)
- 11.2.6 Syenergy Environics
- 11.2.6.1. Overview
- 11.2.6.2. Products
- 11.2.6.3. SWOT Analysis
- 11.2.6.4. Recent Developments
- 11.2.6.5. Financials (Based on Availability)
- 11.2.7 Tech Wellness
- 11.2.7.1. Overview
- 11.2.7.2. Products
- 11.2.7.3. SWOT Analysis
- 11.2.7.4. Recent Developments
- 11.2.7.5. Financials (Based on Availability)
- 11.2.8 Aires Tech
- 11.2.8.1. Overview
- 11.2.8.2. Products
- 11.2.8.3. SWOT Analysis
- 11.2.8.4. Recent Developments
- 11.2.8.5. Financials (Based on Availability)
- 11.2.9 RadiArmor
- 11.2.9.1. Overview
- 11.2.9.2. Products
- 11.2.9.3. SWOT Analysis
- 11.2.9.4. Recent Developments
- 11.2.9.5. Financials (Based on Availability)
- 11.2.10 RF Safe Corporation
- 11.2.10.1. Overview
- 11.2.10.2. Products
- 11.2.10.3. SWOT Analysis
- 11.2.10.4. Recent Developments
- 11.2.10.5. Financials (Based on Availability)
- 11.2.11 SafeSleeve Anti-Radiation Cases
- 11.2.11.1. Overview
- 11.2.11.2. Products
- 11.2.11.3. SWOT Analysis
- 11.2.11.4. Recent Developments
- 11.2.11.5. Financials (Based on Availability)
- 11.2.12 Waves Protect Corp.
- 11.2.12.1. Overview
- 11.2.12.2. Products
- 11.2.12.3. SWOT Analysis
- 11.2.12.4. Recent Developments
- 11.2.12.5. Financials (Based on Availability)
- 11.2.1 AMERICAN AIRES INC.
List of Figures
- Figure 1: Global Anti-radiation Devices for Mobile Phones Revenue Breakdown (billion, %) by Region 2025 & 2033
- Figure 2: Global Anti-radiation Devices for Mobile Phones Volume Breakdown (K, %) by Region 2025 & 2033
- Figure 3: North America Anti-radiation Devices for Mobile Phones Revenue (billion), by Application 2025 & 2033
- Figure 4: North America Anti-radiation Devices for Mobile Phones Volume (K), by Application 2025 & 2033
- Figure 5: North America Anti-radiation Devices for Mobile Phones Revenue Share (%), by Application 2025 & 2033
- Figure 6: North America Anti-radiation Devices for Mobile Phones Volume Share (%), by Application 2025 & 2033
- Figure 7: North America Anti-radiation Devices for Mobile Phones Revenue (billion), by Types 2025 & 2033
- Figure 8: North America Anti-radiation Devices for Mobile Phones Volume (K), by Types 2025 & 2033
- Figure 9: North America Anti-radiation Devices for Mobile Phones Revenue Share (%), by Types 2025 & 2033
- Figure 10: North America Anti-radiation Devices for Mobile Phones Volume Share (%), by Types 2025 & 2033
- Figure 11: North America Anti-radiation Devices for Mobile Phones Revenue (billion), by Country 2025 & 2033
- Figure 12: North America Anti-radiation Devices for Mobile Phones Volume (K), by Country 2025 & 2033
- Figure 13: North America Anti-radiation Devices for Mobile Phones Revenue Share (%), by Country 2025 & 2033
- Figure 14: North America Anti-radiation Devices for Mobile Phones Volume Share (%), by Country 2025 & 2033
- Figure 15: South America Anti-radiation Devices for Mobile Phones Revenue (billion), by Application 2025 & 2033
- Figure 16: South America Anti-radiation Devices for Mobile Phones Volume (K), by Application 2025 & 2033
- Figure 17: South America Anti-radiation Devices for Mobile Phones Revenue Share (%), by Application 2025 & 2033
- Figure 18: South America Anti-radiation Devices for Mobile Phones Volume Share (%), by Application 2025 & 2033
- Figure 19: South America Anti-radiation Devices for Mobile Phones Revenue (billion), by Types 2025 & 2033
- Figure 20: South America Anti-radiation Devices for Mobile Phones Volume (K), by Types 2025 & 2033
- Figure 21: South America Anti-radiation Devices for Mobile Phones Revenue Share (%), by Types 2025 & 2033
- Figure 22: South America Anti-radiation Devices for Mobile Phones Volume Share (%), by Types 2025 & 2033
- Figure 23: South America Anti-radiation Devices for Mobile Phones Revenue (billion), by Country 2025 & 2033
- Figure 24: South America Anti-radiation Devices for Mobile Phones Volume (K), by Country 2025 & 2033
- Figure 25: South America Anti-radiation Devices for Mobile Phones Revenue Share (%), by Country 2025 & 2033
- Figure 26: South America Anti-radiation Devices for Mobile Phones Volume Share (%), by Country 2025 & 2033
- Figure 27: Europe Anti-radiation Devices for Mobile Phones Revenue (billion), by Application 2025 & 2033
- Figure 28: Europe Anti-radiation Devices for Mobile Phones Volume (K), by Application 2025 & 2033
- Figure 29: Europe Anti-radiation Devices for Mobile Phones Revenue Share (%), by Application 2025 & 2033
- Figure 30: Europe Anti-radiation Devices for Mobile Phones Volume Share (%), by Application 2025 & 2033
- Figure 31: Europe Anti-radiation Devices for Mobile Phones Revenue (billion), by Types 2025 & 2033
- Figure 32: Europe Anti-radiation Devices for Mobile Phones Volume (K), by Types 2025 & 2033
- Figure 33: Europe Anti-radiation Devices for Mobile Phones Revenue Share (%), by Types 2025 & 2033
- Figure 34: Europe Anti-radiation Devices for Mobile Phones Volume Share (%), by Types 2025 & 2033
- Figure 35: Europe Anti-radiation Devices for Mobile Phones Revenue (billion), by Country 2025 & 2033
- Figure 36: Europe Anti-radiation Devices for Mobile Phones Volume (K), by Country 2025 & 2033
- Figure 37: Europe Anti-radiation Devices for Mobile Phones Revenue Share (%), by Country 2025 & 2033
- Figure 38: Europe Anti-radiation Devices for Mobile Phones Volume Share (%), by Country 2025 & 2033
- Figure 39: Middle East & Africa Anti-radiation Devices for Mobile Phones Revenue (billion), by Application 2025 & 2033
- Figure 40: Middle East & Africa Anti-radiation Devices for Mobile Phones Volume (K), by Application 2025 & 2033
- Figure 41: Middle East & Africa Anti-radiation Devices for Mobile Phones Revenue Share (%), by Application 2025 & 2033
- Figure 42: Middle East & Africa Anti-radiation Devices for Mobile Phones Volume Share (%), by Application 2025 & 2033
- Figure 43: Middle East & Africa Anti-radiation Devices for Mobile Phones Revenue (billion), by Types 2025 & 2033
- Figure 44: Middle East & Africa Anti-radiation Devices for Mobile Phones Volume (K), by Types 2025 & 2033
- Figure 45: Middle East & Africa Anti-radiation Devices for Mobile Phones Revenue Share (%), by Types 2025 & 2033
- Figure 46: Middle East & Africa Anti-radiation Devices for Mobile Phones Volume Share (%), by Types 2025 & 2033
- Figure 47: Middle East & Africa Anti-radiation Devices for Mobile Phones Revenue (billion), by Country 2025 & 2033
- Figure 48: Middle East & Africa Anti-radiation Devices for Mobile Phones Volume (K), by Country 2025 & 2033
- Figure 49: Middle East & Africa Anti-radiation Devices for Mobile Phones Revenue Share (%), by Country 2025 & 2033
- Figure 50: Middle East & Africa Anti-radiation Devices for Mobile Phones Volume Share (%), by Country 2025 & 2033
- Figure 51: Asia Pacific Anti-radiation Devices for Mobile Phones Revenue (billion), by Application 2025 & 2033
- Figure 52: Asia Pacific Anti-radiation Devices for Mobile Phones Volume (K), by Application 2025 & 2033
- Figure 53: Asia Pacific Anti-radiation Devices for Mobile Phones Revenue Share (%), by Application 2025 & 2033
- Figure 54: Asia Pacific Anti-radiation Devices for Mobile Phones Volume Share (%), by Application 2025 & 2033
- Figure 55: Asia Pacific Anti-radiation Devices for Mobile Phones Revenue (billion), by Types 2025 & 2033
- Figure 56: Asia Pacific Anti-radiation Devices for Mobile Phones Volume (K), by Types 2025 & 2033
- Figure 57: Asia Pacific Anti-radiation Devices for Mobile Phones Revenue Share (%), by Types 2025 & 2033
- Figure 58: Asia Pacific Anti-radiation Devices for Mobile Phones Volume Share (%), by Types 2025 & 2033
- Figure 59: Asia Pacific Anti-radiation Devices for Mobile Phones Revenue (billion), by Country 2025 & 2033
- Figure 60: Asia Pacific Anti-radiation Devices for Mobile Phones Volume (K), by Country 2025 & 2033
- Figure 61: Asia Pacific Anti-radiation Devices for Mobile Phones Revenue Share (%), by Country 2025 & 2033
- Figure 62: Asia Pacific Anti-radiation Devices for Mobile Phones Volume Share (%), by Country 2025 & 2033
List of Tables
- Table 1: Global Anti-radiation Devices for Mobile Phones Revenue billion Forecast, by Application 2020 & 2033
- Table 2: Global Anti-radiation Devices for Mobile Phones Volume K Forecast, by Application 2020 & 2033
- Table 3: Global Anti-radiation Devices for Mobile Phones Revenue billion Forecast, by Types 2020 & 2033
- Table 4: Global Anti-radiation Devices for Mobile Phones Volume K Forecast, by Types 2020 & 2033
- Table 5: Global Anti-radiation Devices for Mobile Phones Revenue billion Forecast, by Region 2020 & 2033
- Table 6: Global Anti-radiation Devices for Mobile Phones Volume K Forecast, by Region 2020 & 2033
- Table 7: Global Anti-radiation Devices for Mobile Phones Revenue billion Forecast, by Application 2020 & 2033
- Table 8: Global Anti-radiation Devices for Mobile Phones Volume K Forecast, by Application 2020 & 2033
- Table 9: Global Anti-radiation Devices for Mobile Phones Revenue billion Forecast, by Types 2020 & 2033
- Table 10: Global Anti-radiation Devices for Mobile Phones Volume K Forecast, by Types 2020 & 2033
- Table 11: Global Anti-radiation Devices for Mobile Phones Revenue billion Forecast, by Country 2020 & 2033
- Table 12: Global Anti-radiation Devices for Mobile Phones Volume K Forecast, by Country 2020 & 2033
- Table 13: United States Anti-radiation Devices for Mobile Phones Revenue (billion) Forecast, by Application 2020 & 2033
- Table 14: United States Anti-radiation Devices for Mobile Phones Volume (K) Forecast, by Application 2020 & 2033
- Table 15: Canada Anti-radiation Devices for Mobile Phones Revenue (billion) Forecast, by Application 2020 & 2033
- Table 16: Canada Anti-radiation Devices for Mobile Phones Volume (K) Forecast, by Application 2020 & 2033
- Table 17: Mexico Anti-radiation Devices for Mobile Phones Revenue (billion) Forecast, by Application 2020 & 2033
- Table 18: Mexico Anti-radiation Devices for Mobile Phones Volume (K) Forecast, by Application 2020 & 2033
- Table 19: Global Anti-radiation Devices for Mobile Phones Revenue billion Forecast, by Application 2020 & 2033
- Table 20: Global Anti-radiation Devices for Mobile Phones Volume K Forecast, by Application 2020 & 2033
- Table 21: Global Anti-radiation Devices for Mobile Phones Revenue billion Forecast, by Types 2020 & 2033
- Table 22: Global Anti-radiation Devices for Mobile Phones Volume K Forecast, by Types 2020 & 2033
- Table 23: Global Anti-radiation Devices for Mobile Phones Revenue billion Forecast, by Country 2020 & 2033
- Table 24: Global Anti-radiation Devices for Mobile Phones Volume K Forecast, by Country 2020 & 2033
- Table 25: Brazil Anti-radiation Devices for Mobile Phones Revenue (billion) Forecast, by Application 2020 & 2033
- Table 26: Brazil Anti-radiation Devices for Mobile Phones Volume (K) Forecast, by Application 2020 & 2033
- Table 27: Argentina Anti-radiation Devices for Mobile Phones Revenue (billion) Forecast, by Application 2020 & 2033
- Table 28: Argentina Anti-radiation Devices for Mobile Phones Volume (K) Forecast, by Application 2020 & 2033
- Table 29: Rest of South America Anti-radiation Devices for Mobile Phones Revenue (billion) Forecast, by Application 2020 & 2033
- Table 30: Rest of South America Anti-radiation Devices for Mobile Phones Volume (K) Forecast, by Application 2020 & 2033
- Table 31: Global Anti-radiation Devices for Mobile Phones Revenue billion Forecast, by Application 2020 & 2033
- Table 32: Global Anti-radiation Devices for Mobile Phones Volume K Forecast, by Application 2020 & 2033
- Table 33: Global Anti-radiation Devices for Mobile Phones Revenue billion Forecast, by Types 2020 & 2033
- Table 34: Global Anti-radiation Devices for Mobile Phones Volume K Forecast, by Types 2020 & 2033
- Table 35: Global Anti-radiation Devices for Mobile Phones Revenue billion Forecast, by Country 2020 & 2033
- Table 36: Global Anti-radiation Devices for Mobile Phones Volume K Forecast, by Country 2020 & 2033
- Table 37: United Kingdom Anti-radiation Devices for Mobile Phones Revenue (billion) Forecast, by Application 2020 & 2033
- Table 38: United Kingdom Anti-radiation Devices for Mobile Phones Volume (K) Forecast, by Application 2020 & 2033
- Table 39: Germany Anti-radiation Devices for Mobile Phones Revenue (billion) Forecast, by Application 2020 & 2033
- Table 40: Germany Anti-radiation Devices for Mobile Phones Volume (K) Forecast, by Application 2020 & 2033
- Table 41: France Anti-radiation Devices for Mobile Phones Revenue (billion) Forecast, by Application 2020 & 2033
- Table 42: France Anti-radiation Devices for Mobile Phones Volume (K) Forecast, by Application 2020 & 2033
- Table 43: Italy Anti-radiation Devices for Mobile Phones Revenue (billion) Forecast, by Application 2020 & 2033
- Table 44: Italy Anti-radiation Devices for Mobile Phones Volume (K) Forecast, by Application 2020 & 2033
- Table 45: Spain Anti-radiation Devices for Mobile Phones Revenue (billion) Forecast, by Application 2020 & 2033
- Table 46: Spain Anti-radiation Devices for Mobile Phones Volume (K) Forecast, by Application 2020 & 2033
- Table 47: Russia Anti-radiation Devices for Mobile Phones Revenue (billion) Forecast, by Application 2020 & 2033
- Table 48: Russia Anti-radiation Devices for Mobile Phones Volume (K) Forecast, by Application 2020 & 2033
- Table 49: Benelux Anti-radiation Devices for Mobile Phones Revenue (billion) Forecast, by Application 2020 & 2033
- Table 50: Benelux Anti-radiation Devices for Mobile Phones Volume (K) Forecast, by Application 2020 & 2033
- Table 51: Nordics Anti-radiation Devices for Mobile Phones Revenue (billion) Forecast, by Application 2020 & 2033
- Table 52: Nordics Anti-radiation Devices for Mobile Phones Volume (K) Forecast, by Application 2020 & 2033
- Table 53: Rest of Europe Anti-radiation Devices for Mobile Phones Revenue (billion) Forecast, by Application 2020 & 2033
- Table 54: Rest of Europe Anti-radiation Devices for Mobile Phones Volume (K) Forecast, by Application 2020 & 2033
- Table 55: Global Anti-radiation Devices for Mobile Phones Revenue billion Forecast, by Application 2020 & 2033
- Table 56: Global Anti-radiation Devices for Mobile Phones Volume K Forecast, by Application 2020 & 2033
- Table 57: Global Anti-radiation Devices for Mobile Phones Revenue billion Forecast, by Types 2020 & 2033
- Table 58: Global Anti-radiation Devices for Mobile Phones Volume K Forecast, by Types 2020 & 2033
- Table 59: Global Anti-radiation Devices for Mobile Phones Revenue billion Forecast, by Country 2020 & 2033
- Table 60: Global Anti-radiation Devices for Mobile Phones Volume K Forecast, by Country 2020 & 2033
- Table 61: Turkey Anti-radiation Devices for Mobile Phones Revenue (billion) Forecast, by Application 2020 & 2033
- Table 62: Turkey Anti-radiation Devices for Mobile Phones Volume (K) Forecast, by Application 2020 & 2033
- Table 63: Israel Anti-radiation Devices for Mobile Phones Revenue (billion) Forecast, by Application 2020 & 2033
- Table 64: Israel Anti-radiation Devices for Mobile Phones Volume (K) Forecast, by Application 2020 & 2033
- Table 65: GCC Anti-radiation Devices for Mobile Phones Revenue (billion) Forecast, by Application 2020 & 2033
- Table 66: GCC Anti-radiation Devices for Mobile Phones Volume (K) Forecast, by Application 2020 & 2033
- Table 67: North Africa Anti-radiation Devices for Mobile Phones Revenue (billion) Forecast, by Application 2020 & 2033
- Table 68: North Africa Anti-radiation Devices for Mobile Phones Volume (K) Forecast, by Application 2020 & 2033
- Table 69: South Africa Anti-radiation Devices for Mobile Phones Revenue (billion) Forecast, by Application 2020 & 2033
- Table 70: South Africa Anti-radiation Devices for Mobile Phones Volume (K) Forecast, by Application 2020 & 2033
- Table 71: Rest of Middle East & Africa Anti-radiation Devices for Mobile Phones Revenue (billion) Forecast, by Application 2020 & 2033
- Table 72: Rest of Middle East & Africa Anti-radiation Devices for Mobile Phones Volume (K) Forecast, by Application 2020 & 2033
- Table 73: Global Anti-radiation Devices for Mobile Phones Revenue billion Forecast, by Application 2020 & 2033
- Table 74: Global Anti-radiation Devices for Mobile Phones Volume K Forecast, by Application 2020 & 2033
- Table 75: Global Anti-radiation Devices for Mobile Phones Revenue billion Forecast, by Types 2020 & 2033
- Table 76: Global Anti-radiation Devices for Mobile Phones Volume K Forecast, by Types 2020 & 2033
- Table 77: Global Anti-radiation Devices for Mobile Phones Revenue billion Forecast, by Country 2020 & 2033
- Table 78: Global Anti-radiation Devices for Mobile Phones Volume K Forecast, by Country 2020 & 2033
- Table 79: China Anti-radiation Devices for Mobile Phones Revenue (billion) Forecast, by Application 2020 & 2033
- Table 80: China Anti-radiation Devices for Mobile Phones Volume (K) Forecast, by Application 2020 & 2033
- Table 81: India Anti-radiation Devices for Mobile Phones Revenue (billion) Forecast, by Application 2020 & 2033
- Table 82: India Anti-radiation Devices for Mobile Phones Volume (K) Forecast, by Application 2020 & 2033
- Table 83: Japan Anti-radiation Devices for Mobile Phones Revenue (billion) Forecast, by Application 2020 & 2033
- Table 84: Japan Anti-radiation Devices for Mobile Phones Volume (K) Forecast, by Application 2020 & 2033
- Table 85: South Korea Anti-radiation Devices for Mobile Phones Revenue (billion) Forecast, by Application 2020 & 2033
- Table 86: South Korea Anti-radiation Devices for Mobile Phones Volume (K) Forecast, by Application 2020 & 2033
- Table 87: ASEAN Anti-radiation Devices for Mobile Phones Revenue (billion) Forecast, by Application 2020 & 2033
- Table 88: ASEAN Anti-radiation Devices for Mobile Phones Volume (K) Forecast, by Application 2020 & 2033
- Table 89: Oceania Anti-radiation Devices for Mobile Phones Revenue (billion) Forecast, by Application 2020 & 2033
- Table 90: Oceania Anti-radiation Devices for Mobile Phones Volume (K) Forecast, by Application 2020 & 2033
- Table 91: Rest of Asia Pacific Anti-radiation Devices for Mobile Phones Revenue (billion) Forecast, by Application 2020 & 2033
- Table 92: Rest of Asia Pacific Anti-radiation Devices for Mobile Phones Volume (K) Forecast, by Application 2020 & 2033
Frequently Asked Questions
1. What is the projected Compound Annual Growth Rate (CAGR) of the Anti-radiation Devices for Mobile Phones?
The projected CAGR is approximately 15.99%.
2. Which companies are prominent players in the Anti-radiation Devices for Mobile Phones?
Key companies in the market include AMERICAN AIRES INC., Penumbra Brands, Inc., Cellsafe, DefenderShield, Syenergy Environics, Tech Wellness, Aires Tech, RadiArmor, RF Safe Corporation, SafeSleeve Anti-Radiation Cases, Waves Protect Corp..
3. What are the main segments of the Anti-radiation Devices for Mobile Phones?
The market segments include Application, Types.
4. Can you provide details about the market size?
The market size is estimated to be USD 13.33 billion as of 2022.
5. What are some drivers contributing to market growth?
N/A
6. What are the notable trends driving market growth?
N/A
7. Are there any restraints impacting market growth?
N/A
8. Can you provide examples of recent developments in the market?
N/A
9. What pricing options are available for accessing the report?
Pricing options include single-user, multi-user, and enterprise licenses priced at USD 3350.00, USD 5025.00, and USD 6700.00 respectively.
10. Is the market size provided in terms of value or volume?
The market size is provided in terms of value, measured in billion and volume, measured in K.
11. Are there any specific market keywords associated with the report?
Yes, the market keyword associated with the report is "Anti-radiation Devices for Mobile Phones," which aids in identifying and referencing the specific market segment covered.
12. How do I determine which pricing option suits my needs best?
The pricing options vary based on user requirements and access needs. Individual users may opt for single-user licenses, while businesses requiring broader access may choose multi-user or enterprise licenses for cost-effective access to the report.
13. Are there any additional resources or data provided in the Anti-radiation Devices for Mobile Phones report?
While the report offers comprehensive insights, it's advisable to review the specific contents or supplementary materials provided to ascertain if additional resources or data are available.
14. How can I stay updated on further developments or reports in the Anti-radiation Devices for Mobile Phones?
To stay informed about further developments, trends, and reports in the Anti-radiation Devices for Mobile Phones, consider subscribing to industry newsletters, following relevant companies and organizations, or regularly checking reputable industry news sources and publications.
Methodology
Step 1 - Identification of Relevant Samples Size from Population Database


Step 2 - Approaches for Defining Global Market Size (Value, Volume* & Price*)

Note*: In applicable scenarios
Step 3 - Data Sources
Primary Research
- Web Analytics
- Survey Reports
- Research Institute
- Latest Research Reports
- Opinion Leaders
Secondary Research
- Annual Reports
- White Paper
- Latest Press Release
- Industry Association
- Paid Database
- Investor Presentations

Step 4 - Data Triangulation
Involves using different sources of information in order to increase the validity of a study
These sources are likely to be stakeholders in a program - participants, other researchers, program staff, other community members, and so on.
Then we put all data in single framework & apply various statistical tools to find out the dynamic on the market.
During the analysis stage, feedback from the stakeholder groups would be compared to determine areas of agreement as well as areas of divergence