Key Insights
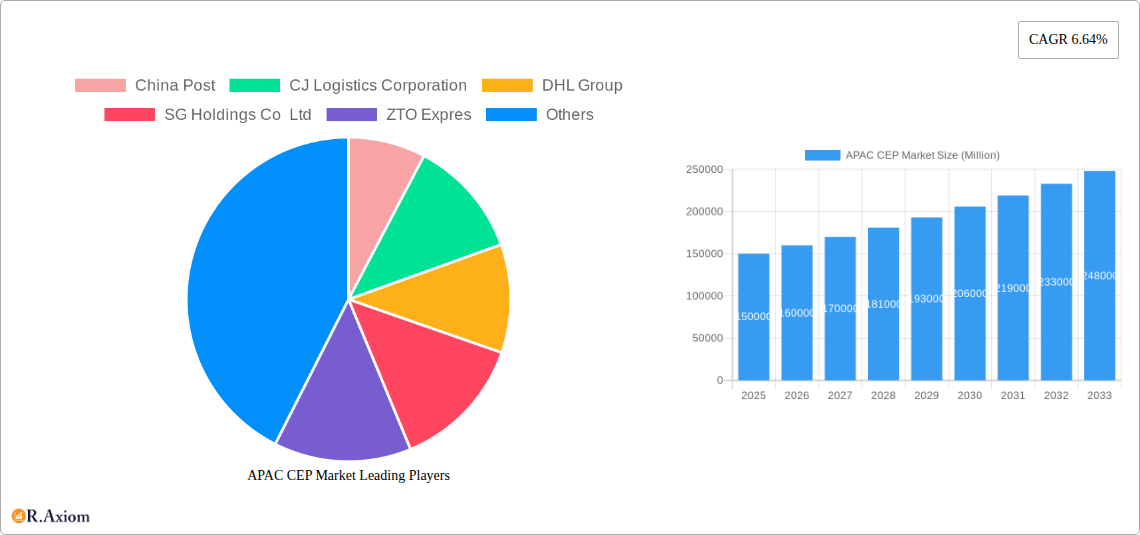
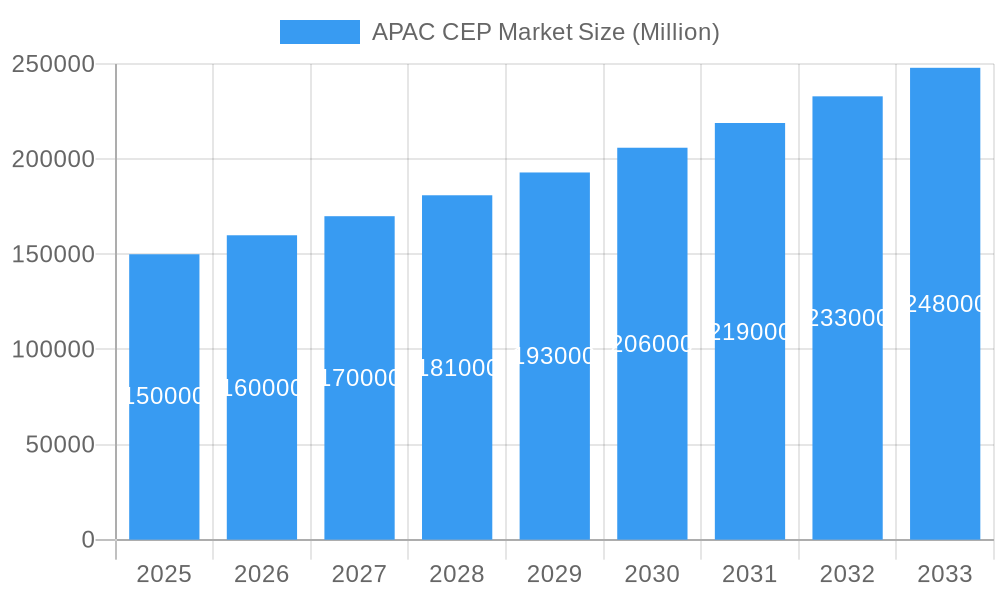
The Asia-Pacific (APAC) Courier, Express, and Parcel (CEP) market is experiencing robust growth, driven by the burgeoning e-commerce sector, expanding financial services, and the increasing adoption of express delivery options across various industries. The market's 6.64% CAGR reflects a significant expansion, projected to reach substantial value by 2033. Key growth drivers include the rise of online shopping, particularly in countries like China and India, fueling demand for faster and more reliable delivery services. Furthermore, the growth of businesses utilizing B2B and B2C models across various industries, from healthcare and manufacturing to e-commerce and financial services, is significantly contributing to the market expansion. Technological advancements, such as improved logistics management systems and the expansion of delivery networks, are also playing a crucial role. While challenges remain, including infrastructure limitations in some regions and fluctuating fuel prices, the overall market outlook is positive, with continued growth anticipated across all segments.
APAC CEP Market Market Size (In Billion)
The market segmentation reveals diverse opportunities. E-commerce remains the dominant end-user industry, with a substantial share of the market. Air transport maintains a significant position in the mode of transport segment, especially for international shipments demanding speed. However, road transport is also experiencing growth, particularly for domestic deliveries and heavier shipments, contributing to its share of the market. The regional analysis indicates that China, India, and other rapidly developing economies in APAC represent significant market opportunities due to their high population density, burgeoning middle class, and increasing disposable income levels. International shipments are increasingly important, reflecting the globalization of trade and cross-border e-commerce. The dominance of large established players like DHL and FedEx alongside regional players highlights the competitive dynamics of the APAC CEP market, and new market entrants will need a clear differentiation strategy to succeed.
APAC CEP Market Company Market Share
This in-depth report provides a comprehensive analysis of the Asia-Pacific (APAC) Courier, Express, and Parcel (CEP) market, offering invaluable insights for industry stakeholders, investors, and strategic planners. The report covers the period from 2019 to 2033, with a focus on the 2025-2033 forecast period. Key segments analyzed include mode of transport, end-user industry, country, destination, speed of delivery, shipment model, and shipment weight. Leading players such as China Post, CJ Logistics Corporation, DHL Group, and others are profiled, providing a detailed competitive landscape analysis.
APAC CEP Market Market Concentration & Innovation
The APAC CEP market exhibits a moderately concentrated landscape, with a few dominant players holding significant market share. China's domestic players, including SF Express and ZTO Express, command substantial portions of the market, especially in the B2C segment fueled by the booming e-commerce sector. Global giants like DHL and FedEx also maintain significant presence, particularly in international shipments. Market share fluctuations are observed due to intense competition and the emergence of niche players. The estimated market share for SF Express in 2025 is xx%, followed by China Post at xx%, and DHL at xx%. Mergers and acquisitions (M&A) activity remains relatively high, with deal values exceeding $xx Million in 2024. Key M&A activities observed in recent years include strategic partnerships aimed at expanding logistics networks and enhancing technological capabilities.
- Innovation Drivers: Technological advancements, such as automation, AI, and drone delivery, are transforming the CEP industry. Regulations promoting digitalization and cross-border e-commerce are also driving innovation.
- Regulatory Frameworks: Varying regulatory landscapes across APAC countries impact operational efficiency and compliance. Harmonization efforts are underway to streamline cross-border shipments.
- Product Substitutes: While traditional CEP services remain dominant, alternative delivery models, such as crowdsourced delivery and autonomous vehicles, are emerging as potential substitutes.
- End-User Trends: The increasing preference for faster delivery speeds, real-time tracking, and enhanced customer service is driving innovation in the CEP sector.
- M&A Activities: Consolidation is likely to continue as companies seek to expand their market reach and optimize operations through strategic partnerships and acquisitions.
APAC CEP Market Industry Trends & Insights
The APAC CEP market is experiencing robust growth, driven by the rapid expansion of e-commerce, increasing urbanization, and rising consumer disposable incomes. The market is expected to register a Compound Annual Growth Rate (CAGR) of xx% during the forecast period (2025-2033). Technological disruptions, such as the adoption of automated sorting systems and AI-powered route optimization, are significantly enhancing efficiency and reducing delivery times. Consumer preferences are shifting towards faster, more reliable, and convenient delivery options, including same-day and next-day delivery services. Intense competition among established players and emerging players is further driving innovation and market penetration. The market penetration rate in key markets like China and India is exceeding xx%.
Dominant Markets & Segments in APAC CEP Market
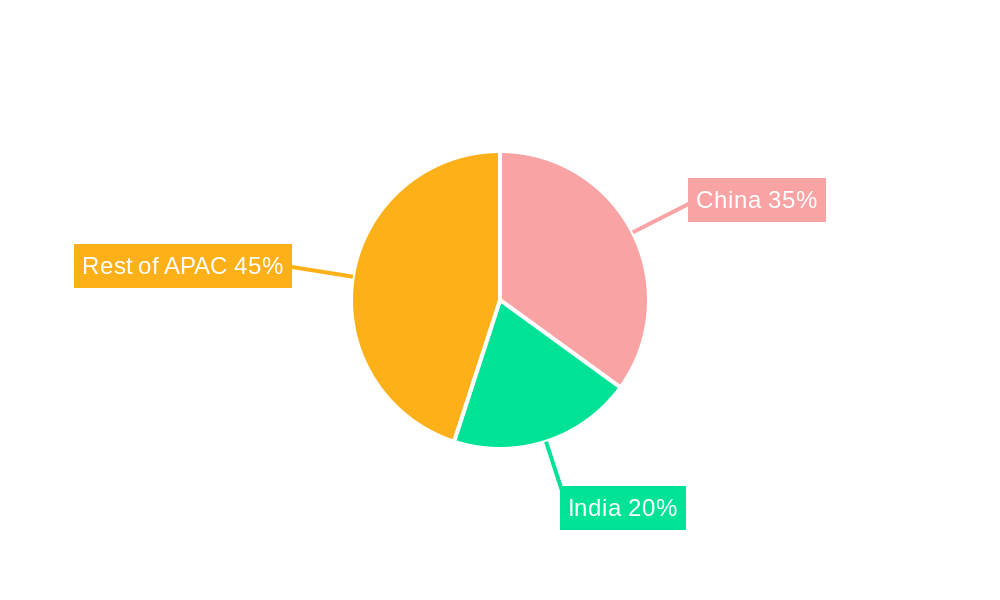
Dominant Region: China dominates the APAC CEP market due to its massive e-commerce sector and extensive logistics infrastructure.
Dominant Countries:
- China: Booming e-commerce, robust infrastructure, and a large number of domestic players contribute to its dominance.
- India: Rapid e-commerce growth and a large and growing population are key drivers.
- Japan: High consumer spending and advanced logistics infrastructure support a significant market.
Dominant Segments:
- Mode of Transport: Road transport holds the largest market share, followed by air transport for express shipments.
- End-User Industry: E-commerce is the leading end-user segment, followed by wholesale and retail trade.
- Destination: Domestic shipments currently dominate, but international shipments are exhibiting high growth potential.
- Speed of Delivery: Express delivery services are in high demand, driving innovation and capacity expansion.
- Model: B2C accounts for a major share, fueled by e-commerce.
- Shipment Weight: Medium-weight shipments constitute a significant portion of the market.
Key Drivers:
- Economic growth: Rising disposable incomes and increased online shopping boost demand.
- Technological advancements: Automation, AI, and data analytics are improving efficiency and reducing costs.
- Government initiatives: Policies promoting e-commerce and logistics infrastructure development support market expansion.
APAC CEP Market Product Developments
Recent product innovations focus on enhancing speed, efficiency, and customer experience. This includes the development of automated sorting facilities, AI-powered route optimization software, drone delivery systems, and advanced tracking technologies. The increasing adoption of smart lockers and delivery robots is further enhancing last-mile delivery efficiency and reducing costs. These advancements provide competitive advantages to CEP companies, allowing them to differentiate their services and cater to evolving customer demands.
Report Scope & Segmentation Analysis
This report segments the APAC CEP market across various parameters:
- Mode of Transport: Air, Road, Others (Rail, Sea) – Growth projections vary depending on infrastructure development and cost-efficiency.
- End-User Industry: E-Commerce, Financial Services (BFSI), Healthcare, Manufacturing, Primary Industry, Wholesale and Retail Trade (Offline), Others – E-commerce segment is expected to show the highest growth.
- Country: Australia, China, India, Indonesia, Japan, Malaysia, Pakistan, Philippines, Thailand, Vietnam, Rest of Asia Pacific – Market size varies significantly across countries based on economic development and e-commerce penetration.
- Destination: Domestic, International – International shipments show higher growth potential.
- Speed of Delivery: Express, Non-Express – Express deliveries have a higher price point but faster growth rate.
- Model: Business-to-Business (B2B), Business-to-Consumer (B2C), Consumer-to-Consumer (C2C) – B2C segment dominates due to e-commerce boom.
- Shipment Weight: Heavy Weight Shipments, Light Weight Shipments, Medium Weight Shipments – Market size varies significantly across different weight segments.
Each segment's growth projection, market size, and competitive dynamics are analyzed in detail within the report.
Key Drivers of APAC CEP Market Growth
The APAC CEP market's growth is driven by several factors: the explosive growth of e-commerce, particularly in China and India; increasing urbanization leading to higher demand for efficient last-mile delivery solutions; improving logistics infrastructure, including the expansion of road networks and air freight capacity; and technological innovations like AI and automation, improving efficiency and cost-effectiveness. Government initiatives supporting digitalization and cross-border e-commerce are also crucial.
Challenges in the APAC CEP Market Sector
The APAC CEP market faces challenges such as inconsistent regulatory frameworks across different countries, hindering seamless cross-border delivery; the need for further investment in logistics infrastructure, particularly in less developed countries; and high competition, with both domestic and international players vying for market share. Fluctuations in fuel prices and labor costs also impact operational costs. These challenges represent quantifiable impacts on profitability and growth potential.
Emerging Opportunities in APAP CEP Market
Emerging opportunities include the increasing adoption of drone delivery for faster and more efficient last-mile delivery; growth in the use of AI-powered route optimization and predictive analytics for improved efficiency; expansion into underserved markets in rural areas; and the potential for developing specialized CEP services for particular industries, like healthcare and pharmaceuticals. The rising preference for sustainable and eco-friendly delivery options also presents a significant opportunity.
Leading Players in the APAC CEP Market Market
- China Post
- CJ Logistics Corporation
- DHL Group
- SG Holdings Co Ltd
- ZTO Express
- FedEx
- United Parcel Service of America Inc (UPS)
- YTO Express
- Yamato Holdings
- SF Express (KEX-SF)
- Blue Dart Express
- DTDC Express Limited
- Toll Group
- JWD Group
Key Developments in APAC CEP Market Industry
- June 2023: China Post launched its first integrated indoor and outdoor “Robot Plus” AI delivery solution in China, signifying a major step towards automation in last-mile delivery.
- April 2023: China Post and Ping An Bank launched an intelligent archives service center, integrating auto finance and logistics services, expanding service offerings.
- March 2023: Colowide MD Co. Ltd and Yamato Transport Co. Ltd entered an agreement to optimize the supply chain for Colowide Group, highlighting the increasing importance of supply chain optimization partnerships.
Strategic Outlook for APAC CEP Market Market
The APAC CEP market is poised for continued strong growth, driven by sustained e-commerce expansion, technological innovation, and infrastructure development. Companies that successfully adapt to evolving customer preferences, embrace technological advancements, and navigate regulatory complexities are expected to thrive. Opportunities exist in expanding into underserved markets, developing specialized services, and promoting sustainable logistics solutions. The market’s future potential is substantial, with significant room for expansion and diversification.
APAC CEP Market Segmentation
-
1. Destination
- 1.1. Domestic
- 1.2. International
-
2. Speed Of Delivery
- 2.1. Express
- 2.2. Non-Express
-
3. Model
- 3.1. Business-to-Business (B2B)
- 3.2. Business-to-Consumer (B2C)
- 3.3. Consumer-to-Consumer (C2C)
-
4. Shipment Weight
- 4.1. Heavy Weight Shipments
- 4.2. Light Weight Shipments
- 4.3. Medium Weight Shipments
-
5. Mode Of Transport
- 5.1. Air
- 5.2. Road
- 5.3. Others
-
6. End User Industry
- 6.1. E-Commerce
- 6.2. Financial Services (BFSI)
- 6.3. Healthcare
- 6.4. Manufacturing
- 6.5. Primary Industry
- 6.6. Wholesale and Retail Trade (Offline)
- 6.7. Others
APAC CEP Market Segmentation By Geography
-
1. North America
- 1.1. United States
- 1.2. Canada
- 1.3. Mexico
-
2. South America
- 2.1. Brazil
- 2.2. Argentina
- 2.3. Rest of South America
-
3. Europe
- 3.1. United Kingdom
- 3.2. Germany
- 3.3. France
- 3.4. Italy
- 3.5. Spain
- 3.6. Russia
- 3.7. Benelux
- 3.8. Nordics
- 3.9. Rest of Europe
-
4. Middle East & Africa
- 4.1. Turkey
- 4.2. Israel
- 4.3. GCC
- 4.4. North Africa
- 4.5. South Africa
- 4.6. Rest of Middle East & Africa
-
5. Asia Pacific
- 5.1. China
- 5.2. India
- 5.3. Japan
- 5.4. South Korea
- 5.5. ASEAN
- 5.6. Oceania
- 5.7. Rest of Asia Pacific
APAC CEP Market Regional Market Share
Geographic Coverage of APAC CEP Market
APAC CEP Market REPORT HIGHLIGHTS
| Aspects | Details |
|---|---|
| Study Period | 2020-2034 |
| Base Year | 2025 |
| Estimated Year | 2026 |
| Forecast Period | 2026-2034 |
| Historical Period | 2020-2025 |
| Growth Rate | CAGR of 6.64% from 2020-2034 |
| Segmentation |
|
Table of Contents
- 1. Introduction
- 1.1. Research Scope
- 1.2. Market Segmentation
- 1.3. Research Objective
- 1.4. Definitions and Assumptions
- 2. Executive Summary
- 2.1. Market Snapshot
- 3. Market Dynamics
- 3.1. Market Drivers
- 3.2. Market Restrains
- 3.3. Market Trends
- 3.4. Market Opportunities
- 4. Market Factor Analysis
- 4.1. Porters Five Forces
- 4.1.1. Bargaining Power of Suppliers
- 4.1.2. Bargaining Power of Buyers
- 4.1.3. Threat of New Entrants
- 4.1.4. Threat of Substitutes
- 4.1.5. Competitive Rivalry
- 4.2. PESTEL analysis
- 4.3. BCG Analysis
- 4.3.1. Stars (High Growth, High Market Share)
- 4.3.2. Cash Cows (Low Growth, High Market Share)
- 4.3.3. Question Mark (High Growth, Low Market Share)
- 4.3.4. Dogs (Low Growth, Low Market Share)
- 4.4. Ansoff Matrix Analysis
- 4.5. Supply Chain Analysis
- 4.6. Regulatory Landscape
- 4.7. Current Market Potential and Opportunity Assessment (TAM–SAM–SOM Framework)
- 4.8. RAX Analyst Note
- 4.1. Porters Five Forces
- 5. Market Analysis, Insights and Forecast 2021-2033
- 5.1. Market Analysis, Insights and Forecast - by Destination
- 5.1.1. Domestic
- 5.1.2. International
- 5.2. Market Analysis, Insights and Forecast - by Speed Of Delivery
- 5.2.1. Express
- 5.2.2. Non-Express
- 5.3. Market Analysis, Insights and Forecast - by Model
- 5.3.1. Business-to-Business (B2B)
- 5.3.2. Business-to-Consumer (B2C)
- 5.3.3. Consumer-to-Consumer (C2C)
- 5.4. Market Analysis, Insights and Forecast - by Shipment Weight
- 5.4.1. Heavy Weight Shipments
- 5.4.2. Light Weight Shipments
- 5.4.3. Medium Weight Shipments
- 5.5. Market Analysis, Insights and Forecast - by Mode Of Transport
- 5.5.1. Air
- 5.5.2. Road
- 5.5.3. Others
- 5.6. Market Analysis, Insights and Forecast - by End User Industry
- 5.6.1. E-Commerce
- 5.6.2. Financial Services (BFSI)
- 5.6.3. Healthcare
- 5.6.4. Manufacturing
- 5.6.5. Primary Industry
- 5.6.6. Wholesale and Retail Trade (Offline)
- 5.6.7. Others
- 5.7. Market Analysis, Insights and Forecast - by Region
- 5.7.1. North America
- 5.7.2. South America
- 5.7.3. Europe
- 5.7.4. Middle East & Africa
- 5.7.5. Asia Pacific
- 5.1. Market Analysis, Insights and Forecast - by Destination
- 6. Global APAC CEP Market Analysis, Insights and Forecast, 2021-2033
- 6.1. Market Analysis, Insights and Forecast - by Destination
- 6.1.1. Domestic
- 6.1.2. International
- 6.2. Market Analysis, Insights and Forecast - by Speed Of Delivery
- 6.2.1. Express
- 6.2.2. Non-Express
- 6.3. Market Analysis, Insights and Forecast - by Model
- 6.3.1. Business-to-Business (B2B)
- 6.3.2. Business-to-Consumer (B2C)
- 6.3.3. Consumer-to-Consumer (C2C)
- 6.4. Market Analysis, Insights and Forecast - by Shipment Weight
- 6.4.1. Heavy Weight Shipments
- 6.4.2. Light Weight Shipments
- 6.4.3. Medium Weight Shipments
- 6.5. Market Analysis, Insights and Forecast - by Mode Of Transport
- 6.5.1. Air
- 6.5.2. Road
- 6.5.3. Others
- 6.6. Market Analysis, Insights and Forecast - by End User Industry
- 6.6.1. E-Commerce
- 6.6.2. Financial Services (BFSI)
- 6.6.3. Healthcare
- 6.6.4. Manufacturing
- 6.6.5. Primary Industry
- 6.6.6. Wholesale and Retail Trade (Offline)
- 6.6.7. Others
- 6.1. Market Analysis, Insights and Forecast - by Destination
- 7. North America APAC CEP Market Analysis, Insights and Forecast, 2020-2032
- 7.1. Market Analysis, Insights and Forecast - by Destination
- 7.1.1. Domestic
- 7.1.2. International
- 7.2. Market Analysis, Insights and Forecast - by Speed Of Delivery
- 7.2.1. Express
- 7.2.2. Non-Express
- 7.3. Market Analysis, Insights and Forecast - by Model
- 7.3.1. Business-to-Business (B2B)
- 7.3.2. Business-to-Consumer (B2C)
- 7.3.3. Consumer-to-Consumer (C2C)
- 7.4. Market Analysis, Insights and Forecast - by Shipment Weight
- 7.4.1. Heavy Weight Shipments
- 7.4.2. Light Weight Shipments
- 7.4.3. Medium Weight Shipments
- 7.5. Market Analysis, Insights and Forecast - by Mode Of Transport
- 7.5.1. Air
- 7.5.2. Road
- 7.5.3. Others
- 7.6. Market Analysis, Insights and Forecast - by End User Industry
- 7.6.1. E-Commerce
- 7.6.2. Financial Services (BFSI)
- 7.6.3. Healthcare
- 7.6.4. Manufacturing
- 7.6.5. Primary Industry
- 7.6.6. Wholesale and Retail Trade (Offline)
- 7.6.7. Others
- 7.1. Market Analysis, Insights and Forecast - by Destination
- 8. South America APAC CEP Market Analysis, Insights and Forecast, 2020-2032
- 8.1. Market Analysis, Insights and Forecast - by Destination
- 8.1.1. Domestic
- 8.1.2. International
- 8.2. Market Analysis, Insights and Forecast - by Speed Of Delivery
- 8.2.1. Express
- 8.2.2. Non-Express
- 8.3. Market Analysis, Insights and Forecast - by Model
- 8.3.1. Business-to-Business (B2B)
- 8.3.2. Business-to-Consumer (B2C)
- 8.3.3. Consumer-to-Consumer (C2C)
- 8.4. Market Analysis, Insights and Forecast - by Shipment Weight
- 8.4.1. Heavy Weight Shipments
- 8.4.2. Light Weight Shipments
- 8.4.3. Medium Weight Shipments
- 8.5. Market Analysis, Insights and Forecast - by Mode Of Transport
- 8.5.1. Air
- 8.5.2. Road
- 8.5.3. Others
- 8.6. Market Analysis, Insights and Forecast - by End User Industry
- 8.6.1. E-Commerce
- 8.6.2. Financial Services (BFSI)
- 8.6.3. Healthcare
- 8.6.4. Manufacturing
- 8.6.5. Primary Industry
- 8.6.6. Wholesale and Retail Trade (Offline)
- 8.6.7. Others
- 8.1. Market Analysis, Insights and Forecast - by Destination
- 9. Europe APAC CEP Market Analysis, Insights and Forecast, 2020-2032
- 9.1. Market Analysis, Insights and Forecast - by Destination
- 9.1.1. Domestic
- 9.1.2. International
- 9.2. Market Analysis, Insights and Forecast - by Speed Of Delivery
- 9.2.1. Express
- 9.2.2. Non-Express
- 9.3. Market Analysis, Insights and Forecast - by Model
- 9.3.1. Business-to-Business (B2B)
- 9.3.2. Business-to-Consumer (B2C)
- 9.3.3. Consumer-to-Consumer (C2C)
- 9.4. Market Analysis, Insights and Forecast - by Shipment Weight
- 9.4.1. Heavy Weight Shipments
- 9.4.2. Light Weight Shipments
- 9.4.3. Medium Weight Shipments
- 9.5. Market Analysis, Insights and Forecast - by Mode Of Transport
- 9.5.1. Air
- 9.5.2. Road
- 9.5.3. Others
- 9.6. Market Analysis, Insights and Forecast - by End User Industry
- 9.6.1. E-Commerce
- 9.6.2. Financial Services (BFSI)
- 9.6.3. Healthcare
- 9.6.4. Manufacturing
- 9.6.5. Primary Industry
- 9.6.6. Wholesale and Retail Trade (Offline)
- 9.6.7. Others
- 9.1. Market Analysis, Insights and Forecast - by Destination
- 10. Middle East & Africa APAC CEP Market Analysis, Insights and Forecast, 2020-2032
- 10.1. Market Analysis, Insights and Forecast - by Destination
- 10.1.1. Domestic
- 10.1.2. International
- 10.2. Market Analysis, Insights and Forecast - by Speed Of Delivery
- 10.2.1. Express
- 10.2.2. Non-Express
- 10.3. Market Analysis, Insights and Forecast - by Model
- 10.3.1. Business-to-Business (B2B)
- 10.3.2. Business-to-Consumer (B2C)
- 10.3.3. Consumer-to-Consumer (C2C)
- 10.4. Market Analysis, Insights and Forecast - by Shipment Weight
- 10.4.1. Heavy Weight Shipments
- 10.4.2. Light Weight Shipments
- 10.4.3. Medium Weight Shipments
- 10.5. Market Analysis, Insights and Forecast - by Mode Of Transport
- 10.5.1. Air
- 10.5.2. Road
- 10.5.3. Others
- 10.6. Market Analysis, Insights and Forecast - by End User Industry
- 10.6.1. E-Commerce
- 10.6.2. Financial Services (BFSI)
- 10.6.3. Healthcare
- 10.6.4. Manufacturing
- 10.6.5. Primary Industry
- 10.6.6. Wholesale and Retail Trade (Offline)
- 10.6.7. Others
- 10.1. Market Analysis, Insights and Forecast - by Destination
- 11. Asia Pacific APAC CEP Market Analysis, Insights and Forecast, 2020-2032
- 11.1. Market Analysis, Insights and Forecast - by Destination
- 11.1.1. Domestic
- 11.1.2. International
- 11.2. Market Analysis, Insights and Forecast - by Speed Of Delivery
- 11.2.1. Express
- 11.2.2. Non-Express
- 11.3. Market Analysis, Insights and Forecast - by Model
- 11.3.1. Business-to-Business (B2B)
- 11.3.2. Business-to-Consumer (B2C)
- 11.3.3. Consumer-to-Consumer (C2C)
- 11.4. Market Analysis, Insights and Forecast - by Shipment Weight
- 11.4.1. Heavy Weight Shipments
- 11.4.2. Light Weight Shipments
- 11.4.3. Medium Weight Shipments
- 11.5. Market Analysis, Insights and Forecast - by Mode Of Transport
- 11.5.1. Air
- 11.5.2. Road
- 11.5.3. Others
- 11.6. Market Analysis, Insights and Forecast - by End User Industry
- 11.6.1. E-Commerce
- 11.6.2. Financial Services (BFSI)
- 11.6.3. Healthcare
- 11.6.4. Manufacturing
- 11.6.5. Primary Industry
- 11.6.6. Wholesale and Retail Trade (Offline)
- 11.6.7. Others
- 11.1. Market Analysis, Insights and Forecast - by Destination
- 12. Competitive Analysis
- 12.1. Company Profiles
- 12.1.1 China Post
- 12.1.1.1. Company Overview
- 12.1.1.2. Products
- 12.1.1.3. Company Financials
- 12.1.1.4. SWOT Analysis
- 12.1.2 CJ Logistics Corporation
- 12.1.2.1. Company Overview
- 12.1.2.2. Products
- 12.1.2.3. Company Financials
- 12.1.2.4. SWOT Analysis
- 12.1.3 DHL Group
- 12.1.3.1. Company Overview
- 12.1.3.2. Products
- 12.1.3.3. Company Financials
- 12.1.3.4. SWOT Analysis
- 12.1.4 SG Holdings Co Ltd
- 12.1.4.1. Company Overview
- 12.1.4.2. Products
- 12.1.4.3. Company Financials
- 12.1.4.4. SWOT Analysis
- 12.1.5 ZTO Expres
- 12.1.5.1. Company Overview
- 12.1.5.2. Products
- 12.1.5.3. Company Financials
- 12.1.5.4. SWOT Analysis
- 12.1.6 FedEx
- 12.1.6.1. Company Overview
- 12.1.6.2. Products
- 12.1.6.3. Company Financials
- 12.1.6.4. SWOT Analysis
- 12.1.7 United Parcel Service of America Inc (UPS)
- 12.1.7.1. Company Overview
- 12.1.7.2. Products
- 12.1.7.3. Company Financials
- 12.1.7.4. SWOT Analysis
- 12.1.8 YTO Express
- 12.1.8.1. Company Overview
- 12.1.8.2. Products
- 12.1.8.3. Company Financials
- 12.1.8.4. SWOT Analysis
- 12.1.9 Yamato Holdings
- 12.1.9.1. Company Overview
- 12.1.9.2. Products
- 12.1.9.3. Company Financials
- 12.1.9.4. SWOT Analysis
- 12.1.10 SF Express (KEX-SF)
- 12.1.10.1. Company Overview
- 12.1.10.2. Products
- 12.1.10.3. Company Financials
- 12.1.10.4. SWOT Analysis
- 12.1.11 Blue Dart Express
- 12.1.11.1. Company Overview
- 12.1.11.2. Products
- 12.1.11.3. Company Financials
- 12.1.11.4. SWOT Analysis
- 12.1.12 DTDC Express Limited
- 12.1.12.1. Company Overview
- 12.1.12.2. Products
- 12.1.12.3. Company Financials
- 12.1.12.4. SWOT Analysis
- 12.1.13 Toll Group
- 12.1.13.1. Company Overview
- 12.1.13.2. Products
- 12.1.13.3. Company Financials
- 12.1.13.4. SWOT Analysis
- 12.1.14 JWD Group
- 12.1.14.1. Company Overview
- 12.1.14.2. Products
- 12.1.14.3. Company Financials
- 12.1.14.4. SWOT Analysis
- 12.1.1 China Post
- 12.2. Market Entropy
- 12.2.1 Company's Key Areas Served
- 12.2.2 Recent Developments
- 12.3. Company Market Share Analysis 2025
- 12.3.1 Top 5 Companies Market Share Analysis
- 12.3.2 Top 3 Companies Market Share Analysis
- 12.4. List of Potential Customers
- 13. Research Methodology
List of Figures
- Figure 1: Global APAC CEP Market Revenue Breakdown (Million, %) by Region 2025 & 2033
- Figure 2: North America APAC CEP Market Revenue (Million), by Destination 2025 & 2033
- Figure 3: North America APAC CEP Market Revenue Share (%), by Destination 2025 & 2033
- Figure 4: North America APAC CEP Market Revenue (Million), by Speed Of Delivery 2025 & 2033
- Figure 5: North America APAC CEP Market Revenue Share (%), by Speed Of Delivery 2025 & 2033
- Figure 6: North America APAC CEP Market Revenue (Million), by Model 2025 & 2033
- Figure 7: North America APAC CEP Market Revenue Share (%), by Model 2025 & 2033
- Figure 8: North America APAC CEP Market Revenue (Million), by Shipment Weight 2025 & 2033
- Figure 9: North America APAC CEP Market Revenue Share (%), by Shipment Weight 2025 & 2033
- Figure 10: North America APAC CEP Market Revenue (Million), by Mode Of Transport 2025 & 2033
- Figure 11: North America APAC CEP Market Revenue Share (%), by Mode Of Transport 2025 & 2033
- Figure 12: North America APAC CEP Market Revenue (Million), by End User Industry 2025 & 2033
- Figure 13: North America APAC CEP Market Revenue Share (%), by End User Industry 2025 & 2033
- Figure 14: North America APAC CEP Market Revenue (Million), by Country 2025 & 2033
- Figure 15: North America APAC CEP Market Revenue Share (%), by Country 2025 & 2033
- Figure 16: South America APAC CEP Market Revenue (Million), by Destination 2025 & 2033
- Figure 17: South America APAC CEP Market Revenue Share (%), by Destination 2025 & 2033
- Figure 18: South America APAC CEP Market Revenue (Million), by Speed Of Delivery 2025 & 2033
- Figure 19: South America APAC CEP Market Revenue Share (%), by Speed Of Delivery 2025 & 2033
- Figure 20: South America APAC CEP Market Revenue (Million), by Model 2025 & 2033
- Figure 21: South America APAC CEP Market Revenue Share (%), by Model 2025 & 2033
- Figure 22: South America APAC CEP Market Revenue (Million), by Shipment Weight 2025 & 2033
- Figure 23: South America APAC CEP Market Revenue Share (%), by Shipment Weight 2025 & 2033
- Figure 24: South America APAC CEP Market Revenue (Million), by Mode Of Transport 2025 & 2033
- Figure 25: South America APAC CEP Market Revenue Share (%), by Mode Of Transport 2025 & 2033
- Figure 26: South America APAC CEP Market Revenue (Million), by End User Industry 2025 & 2033
- Figure 27: South America APAC CEP Market Revenue Share (%), by End User Industry 2025 & 2033
- Figure 28: South America APAC CEP Market Revenue (Million), by Country 2025 & 2033
- Figure 29: South America APAC CEP Market Revenue Share (%), by Country 2025 & 2033
- Figure 30: Europe APAC CEP Market Revenue (Million), by Destination 2025 & 2033
- Figure 31: Europe APAC CEP Market Revenue Share (%), by Destination 2025 & 2033
- Figure 32: Europe APAC CEP Market Revenue (Million), by Speed Of Delivery 2025 & 2033
- Figure 33: Europe APAC CEP Market Revenue Share (%), by Speed Of Delivery 2025 & 2033
- Figure 34: Europe APAC CEP Market Revenue (Million), by Model 2025 & 2033
- Figure 35: Europe APAC CEP Market Revenue Share (%), by Model 2025 & 2033
- Figure 36: Europe APAC CEP Market Revenue (Million), by Shipment Weight 2025 & 2033
- Figure 37: Europe APAC CEP Market Revenue Share (%), by Shipment Weight 2025 & 2033
- Figure 38: Europe APAC CEP Market Revenue (Million), by Mode Of Transport 2025 & 2033
- Figure 39: Europe APAC CEP Market Revenue Share (%), by Mode Of Transport 2025 & 2033
- Figure 40: Europe APAC CEP Market Revenue (Million), by End User Industry 2025 & 2033
- Figure 41: Europe APAC CEP Market Revenue Share (%), by End User Industry 2025 & 2033
- Figure 42: Europe APAC CEP Market Revenue (Million), by Country 2025 & 2033
- Figure 43: Europe APAC CEP Market Revenue Share (%), by Country 2025 & 2033
- Figure 44: Middle East & Africa APAC CEP Market Revenue (Million), by Destination 2025 & 2033
- Figure 45: Middle East & Africa APAC CEP Market Revenue Share (%), by Destination 2025 & 2033
- Figure 46: Middle East & Africa APAC CEP Market Revenue (Million), by Speed Of Delivery 2025 & 2033
- Figure 47: Middle East & Africa APAC CEP Market Revenue Share (%), by Speed Of Delivery 2025 & 2033
- Figure 48: Middle East & Africa APAC CEP Market Revenue (Million), by Model 2025 & 2033
- Figure 49: Middle East & Africa APAC CEP Market Revenue Share (%), by Model 2025 & 2033
- Figure 50: Middle East & Africa APAC CEP Market Revenue (Million), by Shipment Weight 2025 & 2033
- Figure 51: Middle East & Africa APAC CEP Market Revenue Share (%), by Shipment Weight 2025 & 2033
- Figure 52: Middle East & Africa APAC CEP Market Revenue (Million), by Mode Of Transport 2025 & 2033
- Figure 53: Middle East & Africa APAC CEP Market Revenue Share (%), by Mode Of Transport 2025 & 2033
- Figure 54: Middle East & Africa APAC CEP Market Revenue (Million), by End User Industry 2025 & 2033
- Figure 55: Middle East & Africa APAC CEP Market Revenue Share (%), by End User Industry 2025 & 2033
- Figure 56: Middle East & Africa APAC CEP Market Revenue (Million), by Country 2025 & 2033
- Figure 57: Middle East & Africa APAC CEP Market Revenue Share (%), by Country 2025 & 2033
- Figure 58: Asia Pacific APAC CEP Market Revenue (Million), by Destination 2025 & 2033
- Figure 59: Asia Pacific APAC CEP Market Revenue Share (%), by Destination 2025 & 2033
- Figure 60: Asia Pacific APAC CEP Market Revenue (Million), by Speed Of Delivery 2025 & 2033
- Figure 61: Asia Pacific APAC CEP Market Revenue Share (%), by Speed Of Delivery 2025 & 2033
- Figure 62: Asia Pacific APAC CEP Market Revenue (Million), by Model 2025 & 2033
- Figure 63: Asia Pacific APAC CEP Market Revenue Share (%), by Model 2025 & 2033
- Figure 64: Asia Pacific APAC CEP Market Revenue (Million), by Shipment Weight 2025 & 2033
- Figure 65: Asia Pacific APAC CEP Market Revenue Share (%), by Shipment Weight 2025 & 2033
- Figure 66: Asia Pacific APAC CEP Market Revenue (Million), by Mode Of Transport 2025 & 2033
- Figure 67: Asia Pacific APAC CEP Market Revenue Share (%), by Mode Of Transport 2025 & 2033
- Figure 68: Asia Pacific APAC CEP Market Revenue (Million), by End User Industry 2025 & 2033
- Figure 69: Asia Pacific APAC CEP Market Revenue Share (%), by End User Industry 2025 & 2033
- Figure 70: Asia Pacific APAC CEP Market Revenue (Million), by Country 2025 & 2033
- Figure 71: Asia Pacific APAC CEP Market Revenue Share (%), by Country 2025 & 2033
List of Tables
- Table 1: Global APAC CEP Market Revenue Million Forecast, by Destination 2020 & 2033
- Table 2: Global APAC CEP Market Revenue Million Forecast, by Speed Of Delivery 2020 & 2033
- Table 3: Global APAC CEP Market Revenue Million Forecast, by Model 2020 & 2033
- Table 4: Global APAC CEP Market Revenue Million Forecast, by Shipment Weight 2020 & 2033
- Table 5: Global APAC CEP Market Revenue Million Forecast, by Mode Of Transport 2020 & 2033
- Table 6: Global APAC CEP Market Revenue Million Forecast, by End User Industry 2020 & 2033
- Table 7: Global APAC CEP Market Revenue Million Forecast, by Region 2020 & 2033
- Table 8: Global APAC CEP Market Revenue Million Forecast, by Destination 2020 & 2033
- Table 9: Global APAC CEP Market Revenue Million Forecast, by Speed Of Delivery 2020 & 2033
- Table 10: Global APAC CEP Market Revenue Million Forecast, by Model 2020 & 2033
- Table 11: Global APAC CEP Market Revenue Million Forecast, by Shipment Weight 2020 & 2033
- Table 12: Global APAC CEP Market Revenue Million Forecast, by Mode Of Transport 2020 & 2033
- Table 13: Global APAC CEP Market Revenue Million Forecast, by End User Industry 2020 & 2033
- Table 14: Global APAC CEP Market Revenue Million Forecast, by Country 2020 & 2033
- Table 15: United States APAC CEP Market Revenue (Million) Forecast, by Application 2020 & 2033
- Table 16: Canada APAC CEP Market Revenue (Million) Forecast, by Application 2020 & 2033
- Table 17: Mexico APAC CEP Market Revenue (Million) Forecast, by Application 2020 & 2033
- Table 18: Global APAC CEP Market Revenue Million Forecast, by Destination 2020 & 2033
- Table 19: Global APAC CEP Market Revenue Million Forecast, by Speed Of Delivery 2020 & 2033
- Table 20: Global APAC CEP Market Revenue Million Forecast, by Model 2020 & 2033
- Table 21: Global APAC CEP Market Revenue Million Forecast, by Shipment Weight 2020 & 2033
- Table 22: Global APAC CEP Market Revenue Million Forecast, by Mode Of Transport 2020 & 2033
- Table 23: Global APAC CEP Market Revenue Million Forecast, by End User Industry 2020 & 2033
- Table 24: Global APAC CEP Market Revenue Million Forecast, by Country 2020 & 2033
- Table 25: Brazil APAC CEP Market Revenue (Million) Forecast, by Application 2020 & 2033
- Table 26: Argentina APAC CEP Market Revenue (Million) Forecast, by Application 2020 & 2033
- Table 27: Rest of South America APAC CEP Market Revenue (Million) Forecast, by Application 2020 & 2033
- Table 28: Global APAC CEP Market Revenue Million Forecast, by Destination 2020 & 2033
- Table 29: Global APAC CEP Market Revenue Million Forecast, by Speed Of Delivery 2020 & 2033
- Table 30: Global APAC CEP Market Revenue Million Forecast, by Model 2020 & 2033
- Table 31: Global APAC CEP Market Revenue Million Forecast, by Shipment Weight 2020 & 2033
- Table 32: Global APAC CEP Market Revenue Million Forecast, by Mode Of Transport 2020 & 2033
- Table 33: Global APAC CEP Market Revenue Million Forecast, by End User Industry 2020 & 2033
- Table 34: Global APAC CEP Market Revenue Million Forecast, by Country 2020 & 2033
- Table 35: United Kingdom APAC CEP Market Revenue (Million) Forecast, by Application 2020 & 2033
- Table 36: Germany APAC CEP Market Revenue (Million) Forecast, by Application 2020 & 2033
- Table 37: France APAC CEP Market Revenue (Million) Forecast, by Application 2020 & 2033
- Table 38: Italy APAC CEP Market Revenue (Million) Forecast, by Application 2020 & 2033
- Table 39: Spain APAC CEP Market Revenue (Million) Forecast, by Application 2020 & 2033
- Table 40: Russia APAC CEP Market Revenue (Million) Forecast, by Application 2020 & 2033
- Table 41: Benelux APAC CEP Market Revenue (Million) Forecast, by Application 2020 & 2033
- Table 42: Nordics APAC CEP Market Revenue (Million) Forecast, by Application 2020 & 2033
- Table 43: Rest of Europe APAC CEP Market Revenue (Million) Forecast, by Application 2020 & 2033
- Table 44: Global APAC CEP Market Revenue Million Forecast, by Destination 2020 & 2033
- Table 45: Global APAC CEP Market Revenue Million Forecast, by Speed Of Delivery 2020 & 2033
- Table 46: Global APAC CEP Market Revenue Million Forecast, by Model 2020 & 2033
- Table 47: Global APAC CEP Market Revenue Million Forecast, by Shipment Weight 2020 & 2033
- Table 48: Global APAC CEP Market Revenue Million Forecast, by Mode Of Transport 2020 & 2033
- Table 49: Global APAC CEP Market Revenue Million Forecast, by End User Industry 2020 & 2033
- Table 50: Global APAC CEP Market Revenue Million Forecast, by Country 2020 & 2033
- Table 51: Turkey APAC CEP Market Revenue (Million) Forecast, by Application 2020 & 2033
- Table 52: Israel APAC CEP Market Revenue (Million) Forecast, by Application 2020 & 2033
- Table 53: GCC APAC CEP Market Revenue (Million) Forecast, by Application 2020 & 2033
- Table 54: North Africa APAC CEP Market Revenue (Million) Forecast, by Application 2020 & 2033
- Table 55: South Africa APAC CEP Market Revenue (Million) Forecast, by Application 2020 & 2033
- Table 56: Rest of Middle East & Africa APAC CEP Market Revenue (Million) Forecast, by Application 2020 & 2033
- Table 57: Global APAC CEP Market Revenue Million Forecast, by Destination 2020 & 2033
- Table 58: Global APAC CEP Market Revenue Million Forecast, by Speed Of Delivery 2020 & 2033
- Table 59: Global APAC CEP Market Revenue Million Forecast, by Model 2020 & 2033
- Table 60: Global APAC CEP Market Revenue Million Forecast, by Shipment Weight 2020 & 2033
- Table 61: Global APAC CEP Market Revenue Million Forecast, by Mode Of Transport 2020 & 2033
- Table 62: Global APAC CEP Market Revenue Million Forecast, by End User Industry 2020 & 2033
- Table 63: Global APAC CEP Market Revenue Million Forecast, by Country 2020 & 2033
- Table 64: China APAC CEP Market Revenue (Million) Forecast, by Application 2020 & 2033
- Table 65: India APAC CEP Market Revenue (Million) Forecast, by Application 2020 & 2033
- Table 66: Japan APAC CEP Market Revenue (Million) Forecast, by Application 2020 & 2033
- Table 67: South Korea APAC CEP Market Revenue (Million) Forecast, by Application 2020 & 2033
- Table 68: ASEAN APAC CEP Market Revenue (Million) Forecast, by Application 2020 & 2033
- Table 69: Oceania APAC CEP Market Revenue (Million) Forecast, by Application 2020 & 2033
- Table 70: Rest of Asia Pacific APAC CEP Market Revenue (Million) Forecast, by Application 2020 & 2033
Frequently Asked Questions
1. What is the projected Compound Annual Growth Rate (CAGR) of the APAC CEP Market?
The projected CAGR is approximately 6.64%.
2. Which companies are prominent players in the APAC CEP Market?
Key companies in the market include China Post, CJ Logistics Corporation, DHL Group, SG Holdings Co Ltd, ZTO Expres, FedEx, United Parcel Service of America Inc (UPS), YTO Express, Yamato Holdings, SF Express (KEX-SF), Blue Dart Express, DTDC Express Limited, Toll Group, JWD Group.
3. What are the main segments of the APAC CEP Market?
The market segments include Destination, Speed Of Delivery, Model, Shipment Weight, Mode Of Transport, End User Industry.
4. Can you provide details about the market size?
The market size is estimated to be USD XX Million as of 2022.
5. What are some drivers contributing to market growth?
E-commerce Fueling the Growth of 3PL Market.
6. What are the notable trends driving market growth?
OTHER KEY INDUSTRY TRENDS COVERED IN THE REPORT.
7. Are there any restraints impacting market growth?
Slow Infrastructure Development.
8. Can you provide examples of recent developments in the market?
June 2023: China Post launched its first integrated indoor and outdoor “Robot Plus” AI delivery solution in China. The intelligent delivery solution relies on a combination of unmanned vehicles outdoors and robots indoors, constructing an integrated indoor and outdoor unmanned distribution mode and developing a last-mile logistics network with AI transport capacity sharing.April 2023: China Post and the Automobile Consumption Financial Center of Ping An Bank Co. Ltd launched an intelligent archives service center in Guangdong to promote the service integration of auto finance and express and logistics businesses.March 2023: Colowide MD Co. Ltd, which oversees merchandising for the Colowide Group, and Yamato Transport Co. Ltd entered an agreement. The two companies will promote the visualization and optimization of the entire supply chain of Colowide Group, which operates multiple brands such as Gyu-Kaku, Kappa Sushi, and OOTOYA.
9. What pricing options are available for accessing the report?
Pricing options include single-user, multi-user, and enterprise licenses priced at USD 3800, USD 4500, and USD 5800 respectively.
10. Is the market size provided in terms of value or volume?
The market size is provided in terms of value, measured in Million.
11. Are there any specific market keywords associated with the report?
Yes, the market keyword associated with the report is "APAC CEP Market," which aids in identifying and referencing the specific market segment covered.
12. How do I determine which pricing option suits my needs best?
The pricing options vary based on user requirements and access needs. Individual users may opt for single-user licenses, while businesses requiring broader access may choose multi-user or enterprise licenses for cost-effective access to the report.
13. Are there any additional resources or data provided in the APAC CEP Market report?
While the report offers comprehensive insights, it's advisable to review the specific contents or supplementary materials provided to ascertain if additional resources or data are available.
14. How can I stay updated on further developments or reports in the APAC CEP Market?
To stay informed about further developments, trends, and reports in the APAC CEP Market, consider subscribing to industry newsletters, following relevant companies and organizations, or regularly checking reputable industry news sources and publications.
Methodology
Step 1 - Identification of Relevant Samples Size from Population Database


Step 2 - Approaches for Defining Global Market Size (Value, Volume* & Price*)

Note*: In applicable scenarios
Step 3 - Data Sources
Primary Research
- Web Analytics
- Survey Reports
- Research Institute
- Latest Research Reports
- Opinion Leaders
Secondary Research
- Annual Reports
- White Paper
- Latest Press Release
- Industry Association
- Paid Database
- Investor Presentations

Step 4 - Data Triangulation
Involves using different sources of information in order to increase the validity of a study
These sources are likely to be stakeholders in a program - participants, other researchers, program staff, other community members, and so on.
Then we put all data in single framework & apply various statistical tools to find out the dynamic on the market.
During the analysis stage, feedback from the stakeholder groups would be compared to determine areas of agreement as well as areas of divergence

