

Key Insights
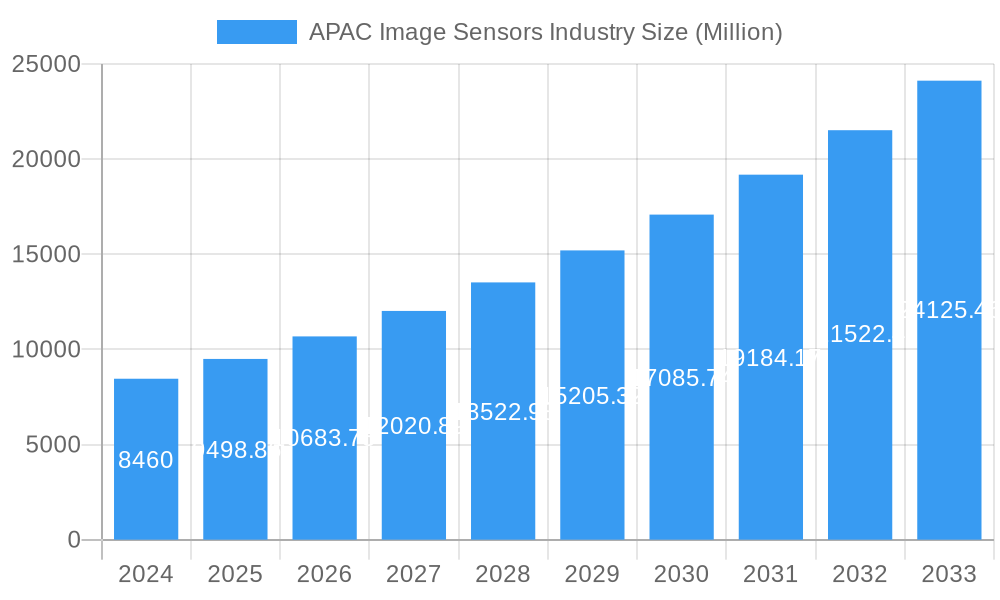
The APAC Image Sensors Market is poised for substantial growth, driven by the burgeoning demand across diverse end-user industries. With a current market size estimated at USD 8.46 billion in 2024, the region is projected to experience a robust CAGR of 12.11% through the forecast period of 2025-2033. This expansion is fueled by the relentless innovation in consumer electronics, particularly the smartphone sector, where advanced camera capabilities are a key differentiator. Furthermore, the increasing adoption of image sensors in healthcare for diagnostic imaging, in industrial automation for quality control and robotics, and in the security and surveillance sector for enhanced monitoring solutions are significant growth catalysts. The automotive industry's rapid embrace of advanced driver-assistance systems (ADAS) and autonomous driving technologies, heavily reliant on sophisticated image sensors, also plays a crucial role in shaping the market's trajectory. Emerging applications in aerospace and defense further contribute to this dynamic growth landscape.
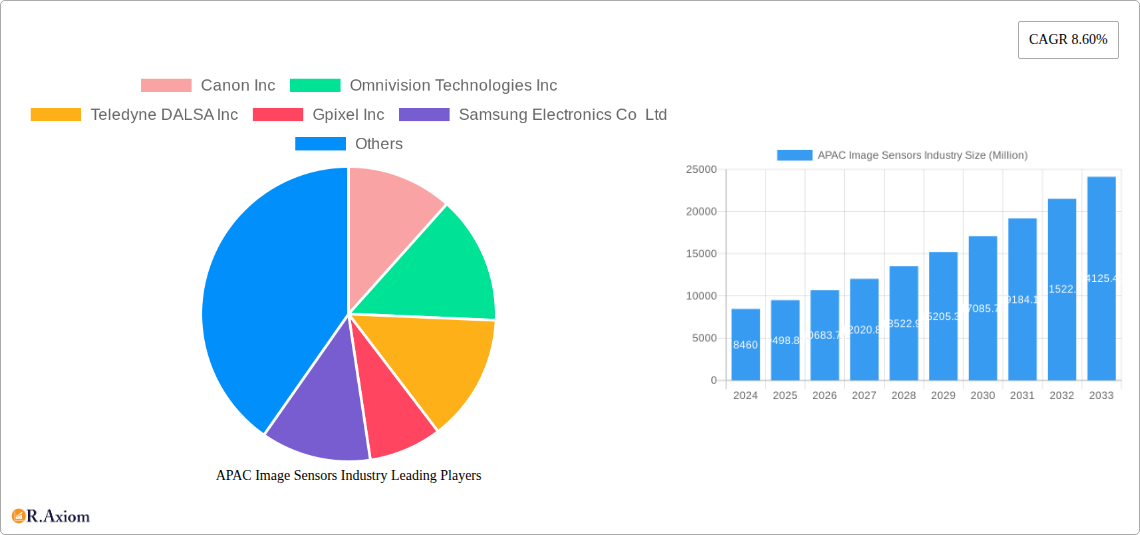
APAC Image Sensors Industry Market Size (In Billion)
The market's evolution is characterized by key trends such as the shift towards higher resolution sensors, improved low-light performance, and the integration of AI capabilities directly into image sensors for on-device processing. While the growth is promising, certain restraints could impact the pace. These include the high cost associated with advanced sensor technologies and manufacturing, potential supply chain disruptions impacting raw material availability and component sourcing, and intense competition among leading global players vying for market share. However, the inherent technological advancements and the expanding application base across multiple industries are expected to outweigh these challenges, ensuring a sustained and upward market trend in the APAC region. The dominance of CMOS technology, due to its cost-effectiveness and performance, is expected to continue, while CCD sensors will likely find niche applications where specific performance characteristics are paramount.
APAC Image Sensors Industry Company Market Share
APAC Image Sensors Industry Market Concentration & Innovation
The APAC image sensors market exhibits a moderate to high degree of concentration, with a few dominant players holding significant market share, estimated to be over 70% of the global market. Key contributors to this concentration include Sony Corporation, a long-standing leader with extensive R&D and manufacturing capabilities, and Samsung Electronics Co Ltd, which has aggressively expanded its presence across various applications. Other significant entities like Omnivision Technologies Inc, STMicroelectronics NV, and SmartSens Technology Co Ltd are also vying for market share, particularly in high-growth segments. Innovation serves as a primary driver of market dynamics. Companies are heavily investing in advanced technologies such as stacked CMOS sensors, back-illuminated sensors, and AI-enabled image processing to enhance resolution, low-light performance, and computational imaging capabilities. The regulatory landscape in APAC, while generally supportive of technological advancement, can vary across countries, impacting import/export policies and intellectual property protection. Product substitutes, while limited in the core image sensor technology, can emerge from advancements in alternative imaging or sensing technologies in specific end-user applications. End-user trends, such as the insatiable demand for higher-resolution displays and advanced camera features in smartphones, coupled with the rapid adoption of AI in industrial and automotive sectors, are reshaping product development. Mergers and acquisition (M&A) activities, though not as frequent as in other tech sectors, are crucial for market consolidation and technology acquisition. Notable M&A deal values in recent years have focused on acquiring specialized IP and expanding manufacturing capacity, contributing to the overall market structure. The APAC region's robust manufacturing ecosystem and significant consumer base continue to fuel both organic and inorganic growth strategies among key players.
The APAC image sensors industry is poised for robust growth, driven by an accelerating demand across a multitude of burgeoning end-user applications. The market is projected to expand at a Compound Annual Growth Rate (CAGR) of approximately 10-12% over the forecast period of 2025-2033. This impressive growth trajectory is underpinned by several pivotal trends and insights. Firstly, the insatiable consumer appetite for enhanced mobile photography and videography is a primary market penetration driver. Smartphones, the largest consumer of image sensors, are continuously being equipped with more sophisticated camera systems featuring higher resolutions, improved low-light performance, and advanced computational photography capabilities, directly fueling demand for cutting-edge CMOS sensors. This trend is particularly pronounced in emerging economies within APAC, where smartphone adoption continues to soar. Secondly, the burgeoning automotive sector is a significant growth catalyst. The increasing integration of advanced driver-assistance systems (ADAS) and the ongoing development towards autonomous driving necessitate a vast array of high-performance image sensors for applications like surround-view cameras, driver monitoring systems, and LiDAR components. The safety and convenience features offered by these technologies are compelling vehicle manufacturers to invest heavily in image sensor technology, thereby driving market penetration in this segment. Thirdly, the industrial sector's digital transformation, including smart manufacturing and Industry 4.0 initiatives, is creating substantial demand. Image sensors are becoming indispensable for quality control, inspection, robotic vision, and augmented reality applications, all of which are experiencing significant expansion across APAC's manufacturing powerhouses. Furthermore, the healthcare industry's increasing reliance on advanced medical imaging devices, from endoscopes to diagnostic equipment, is another critical growth driver. The demand for higher precision, miniaturization, and improved imaging quality in medical applications is pushing the boundaries of image sensor technology. The competitive landscape is characterized by intense innovation and strategic collaborations. Companies are investing heavily in R&D to develop next-generation sensors with features like higher frame rates, wider dynamic range, and enhanced spectral sensitivity. Technological disruptions, such as the ongoing transition from CCD to CMOS technology due to CMOS's superior speed, lower power consumption, and integration capabilities, continue to shape market dynamics. Consumer preferences are increasingly leaning towards AI-enabled imaging solutions that offer intelligent image processing and feature recognition, further spurring innovation and market penetration. The competitive intensity remains high, with key players continually launching new products and expanding their portfolios to capture market share across diverse segments.
Dominant Markets & Segments in APAC Image Sensors Industry
The APAC Image Sensors Industry is characterized by the dominance of specific regions, countries, and technological segments. The CMOS sensor segment overwhelmingly leads, accounting for an estimated 90% of the total market revenue. This dominance stems from CMOS technology's inherent advantages in speed, power efficiency, integration capabilities, and cost-effectiveness, making it the preferred choice for the vast majority of modern electronic devices. Within end-user industries, Consumer Electronics stands as the most dominant segment, propelled by the ubiquitous demand for smartphones, digital cameras, and other portable electronic devices. The sheer volume of production and the rapid upgrade cycles in this sector create an unparalleled market for image sensors. Automotive and Transportation is rapidly emerging as a high-growth and increasingly dominant segment. The proliferation of ADAS, autonomous driving technologies, and in-car infotainment systems necessitates a significant and growing number of sophisticated image sensors per vehicle. Countries like China, Japan, and South Korea are at the forefront of this automotive sensor adoption due to their strong automotive manufacturing bases and advanced technological infrastructure.
Key Drivers for Dominance:
- Economic Policies and Government Support: Governments in countries like China and South Korea have actively supported the semiconductor industry, including image sensor manufacturing, through subsidies, R&D grants, and favorable trade policies. This has fostered domestic production capabilities and attracted significant foreign investment.
- Robust Manufacturing Ecosystem: The APAC region possesses a highly developed and integrated manufacturing ecosystem for electronics. This includes wafer fabrication plants, packaging and testing facilities, and a skilled workforce, which are crucial for the high-volume production of image sensors.
- Large Consumer Base and Market Demand: The immense population and rapidly growing middle class in countries like China, India, and Southeast Asian nations create a colossal consumer market for electronic devices, directly translating into high demand for image sensors.
- Technological Advancement and R&D Investment: Leading companies in Japan, South Korea, and Taiwan have consistently invested heavily in research and development, leading to breakthroughs in CMOS sensor technology, sensor resolution, and specialized sensor applications.
- Infrastructure Development: Significant investments in high-speed communication networks and smart city initiatives are driving the adoption of image sensors in security and surveillance, industrial automation, and smart home devices across the region.
The Industrial segment is also a significant contributor to dominance, driven by the adoption of automation, robotics, and quality control systems in manufacturing. The Security and Surveillance segment, fueled by increasing urbanization and public safety concerns, is another area where image sensors are experiencing sustained demand. While Healthcare, Aerospace and Defense, and Other End-user Industries represent smaller but growing markets, their specialized requirements are spurring innovation in niche sensor technologies. The continued advancements in CMOS technology and the ongoing miniaturization and cost reduction efforts are expected to further solidify the dominance of CMOS sensors and expand their penetration across all end-user industries.
APAC Image Sensors Industry Product Developments
Recent product developments in the APAC image sensors industry highlight a relentless pursuit of higher performance, increased functionality, and broader applicability. Companies are focusing on pushing the boundaries of resolution, with sensors exceeding 200 megapixels becoming more prevalent in premium consumer devices and specialized industrial applications. Innovations in stacked CMOS technology are enabling faster readout speeds and advanced on-chip processing capabilities, crucial for high-frame-rate video recording and computational photography. Furthermore, there's a significant push towards sensors optimized for challenging lighting conditions, featuring improved low-light sensitivity and wider dynamic range to capture detail in both bright and dark environments. Developments in AI-embedded sensors are also gaining traction, allowing for on-sensor image analysis and feature recognition, reducing reliance on external processors. The competitive advantage lies in offering differentiated solutions that meet the precise needs of evolving end-user industries, from enhanced automotive safety to sophisticated medical diagnostics.
Report Scope & Segmentation Analysis
This report provides a comprehensive analysis of the APAC Image Sensors Industry, segmented by Type and End-user Industry. The Type segmentation includes CMOS and CCD image sensors, with CMOS projected to dominate due to its technological advancements and cost-effectiveness, capturing over 90% of the market share by 2033. The End-user Industry segmentation encompasses Consumer Electronics, Healthcare, Industrial, Security and Surveillance, Automotive and Transportation, Aerospace and Defense, and Other End-user Industries. The Consumer Electronics segment is expected to maintain its leadership, driven by smartphone and digital camera demand. The Automotive and Transportation segment is forecast to exhibit the highest growth rate, propelled by the increasing adoption of ADAS and autonomous driving technologies. The Industrial segment is also poised for substantial growth, fueled by automation and smart manufacturing initiatives.
Key Drivers of APAC Image Sensors Industry Growth
The APAC Image Sensors Industry is propelled by a confluence of powerful growth drivers. Technologically, the continuous innovation in CMOS sensor design, leading to higher resolutions, faster frame rates, and improved low-light performance, is a primary catalyst. The increasing integration of Artificial Intelligence (AI) within sensors themselves, enabling on-chip image processing and feature recognition, is further driving adoption. Economically, the burgeoning consumer markets in countries like China and India, coupled with the expanding middle class, create immense demand for consumer electronics featuring advanced imaging capabilities. The rapid growth of the automotive sector in APAC, with its increasing need for sophisticated ADAS and autonomous driving systems, is a significant economic driver. Regulatory factors, such as government initiatives promoting domestic semiconductor manufacturing and the push for enhanced safety standards in automotive and industrial applications, also contribute positively to market expansion.
Challenges in the APAC Image Sensors Industry Sector
Despite its strong growth trajectory, the APAC Image Sensors Industry faces several challenges. Intense global competition, particularly from established players in Japan, South Korea, and Taiwan, coupled with the rise of Chinese manufacturers, exerts downward pressure on pricing and profit margins. Supply chain disruptions, exacerbated by geopolitical tensions and global semiconductor shortages, can impact production volumes and lead times. Furthermore, the high capital expenditure required for wafer fabrication and R&D presents a significant barrier to entry for new players. Evolving regulatory landscapes in different countries, including trade restrictions and intellectual property concerns, can also pose complexities. The increasing demand for specialized, high-performance sensors also necessitates continuous, significant investment in cutting-edge research and development, which can be a considerable financial burden.
Emerging Opportunities in APAC Image Sensors Industry
Emerging opportunities in the APAC Image Sensors Industry lie in tapping into the rapidly expanding markets for AI-powered imaging and advanced sensing solutions. The growing demand for smart cities, fueled by initiatives in public safety and traffic management, presents a significant opportunity for advanced surveillance and sensing technologies. The continued evolution of the healthcare sector, with its increasing reliance on medical imaging for diagnostics and treatment, offers avenues for high-resolution and specialized sensors. The burgeoning Internet of Things (IoT) ecosystem, encompassing smart homes, wearables, and industrial automation, requires a diverse range of compact, low-power image sensors for various applications. Furthermore, the development of next-generation display technologies and augmented/virtual reality (AR/VR) devices will create new demands for innovative imaging solutions.
Leading Players in the APAC Image Sensors Industry Market
- Sony Corporation
- Samsung Electronics Co Ltd
- Omnivision Technologies Inc
- STMicroelectronics NV
- SmartSens Technology Co Ltd
- ON Semiconductor Corporation
- GalaxyCore Inc
- Canon Inc
- Teledyne DALSA Inc
- Gpixel Inc
- Hynix Inc
- Ams AG
- Panasonic Corporation
Key Developments in APAC Image Sensors Industry Industry
- 2023/11: Sony launches a new line of stacked CMOS sensors for smartphones, boasting enhanced low-light performance and AI capabilities.
- 2024/02: Samsung announces significant investment in its image sensor fabrication facilities to meet growing demand from automotive and industrial sectors.
- 2024/05: SmartSens Technology unveils a new series of image sensors for surveillance applications, featuring advanced AI-driven object detection.
- 2024/07: ON Semiconductor expands its automotive image sensor portfolio with a focus on high dynamic range and safety-critical features.
- 2024/09: GalaxyCore introduces compact, low-power image sensors for emerging IoT devices and wearables.
- 2025/01: STMicroelectronics showcases advancements in industrial image sensors with enhanced machine vision capabilities.
- 2025/03: Omnivision Technologies announces a strategic partnership to accelerate the development of hyperspectral imaging sensors.
- 2025/06: Gpixel introduces advanced sensors for scientific and medical imaging applications, offering exceptional sensitivity and resolution.
- 2025/08: Canon Inc. highlights its ongoing innovation in image processing technology, complementing its image sensor offerings.
- 2025/10: Teledyne DALSA demonstrates new high-speed camera systems incorporating their latest image sensor technology for demanding industrial inspection.
- 2025/12: Hynix Inc. plans to expand its production capacity for high-performance image sensors targeting the global mobile market.
- 2026/01: Ams AG focuses on developing specialized image sensors for advanced driver-assistance systems (ADAS).
- 2026/04: Panasonic Corporation announces new image sensors with improved thermal imaging capabilities.
Strategic Outlook for APAC Image Sensors Industry Market
The strategic outlook for the APAC Image Sensors Industry remains exceptionally strong, driven by sustained innovation and expanding market applications. The industry's growth catalysts are deeply embedded in the relentless advancement of technology, particularly in AI integration and enhanced sensor performance for complex imaging tasks. The increasing demand for sophisticated imaging solutions in burgeoning sectors like autonomous vehicles, smart manufacturing, and advanced healthcare diagnostics will continue to fuel market expansion. Strategic investments in R&D, coupled with a focus on cost optimization and supply chain resilience, will be paramount for players seeking to maintain a competitive edge. The APAC region's position as a global hub for electronics manufacturing and its massive consumer base provide a fertile ground for both established leaders and emerging innovators to capitalize on future market opportunities.
APAC Image Sensors Industry Segmentation
-
1. Type
- 1.1. CMOS
- 1.2. CCD
-
2. End-user Industry
- 2.1. Consumer Electronics
- 2.2. Healthcare
- 2.3. Industrial
- 2.4. Security and Surveillance
- 2.5. Automotive and Transportation
- 2.6. Aerospace and Defense
- 2.7. Other End-user Industries
APAC Image Sensors Industry Segmentation By Geography
-
1. North America
- 1.1. United States
- 1.2. Canada
- 1.3. Mexico
-
2. South America
- 2.1. Brazil
- 2.2. Argentina
- 2.3. Rest of South America
-
3. Europe
- 3.1. United Kingdom
- 3.2. Germany
- 3.3. France
- 3.4. Italy
- 3.5. Spain
- 3.6. Russia
- 3.7. Benelux
- 3.8. Nordics
- 3.9. Rest of Europe
-
4. Middle East & Africa
- 4.1. Turkey
- 4.2. Israel
- 4.3. GCC
- 4.4. North Africa
- 4.5. South Africa
- 4.6. Rest of Middle East & Africa
-
5. Asia Pacific
- 5.1. China
- 5.2. India
- 5.3. Japan
- 5.4. South Korea
- 5.5. ASEAN
- 5.6. Oceania
- 5.7. Rest of Asia Pacific
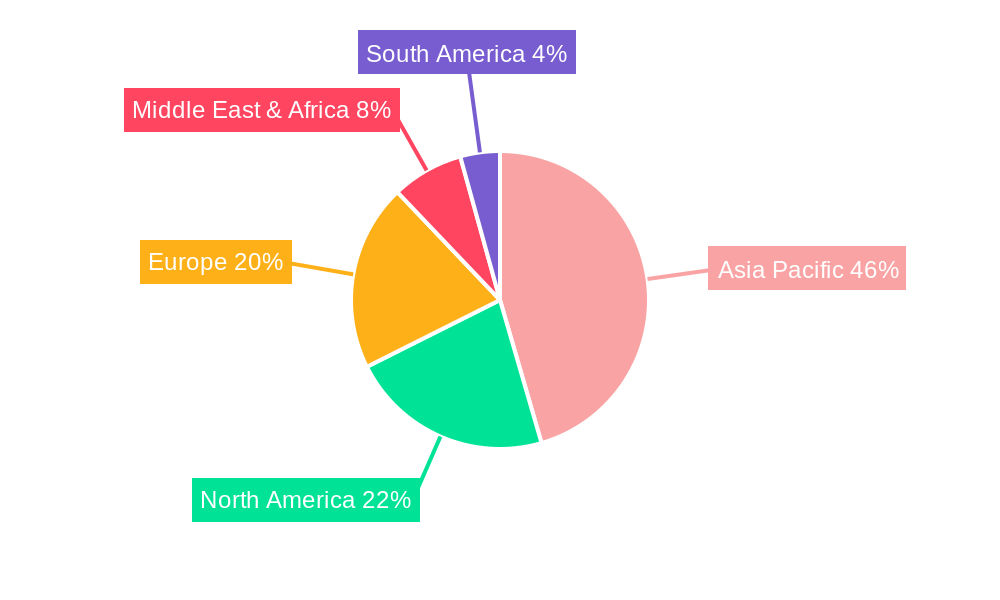
APAC Image Sensors Industry Regional Market Share
Geographic Coverage of APAC Image Sensors Industry
APAC Image Sensors Industry REPORT HIGHLIGHTS
| Aspects | Details |
|---|---|
| Study Period | 2020-2034 |
| Base Year | 2025 |
| Estimated Year | 2026 |
| Forecast Period | 2026-2034 |
| Historical Period | 2020-2025 |
| Growth Rate | CAGR of 12.2% from 2020-2034 |
| Segmentation |
|
Table of Contents
- 1. Introduction
- 1.1. Research Scope
- 1.2. Market Segmentation
- 1.3. Research Objective
- 1.4. Definitions and Assumptions
- 2. Executive Summary
- 2.1. Market Snapshot
- 3. Market Dynamics
- 3.1. Market Drivers
- 3.2. Market Restrains
- 3.3. Market Trends
- 3.4. Market Opportunities
- 4. Market Factor Analysis
- 4.1. Porters Five Forces
- 4.1.1. Bargaining Power of Suppliers
- 4.1.2. Bargaining Power of Buyers
- 4.1.3. Threat of New Entrants
- 4.1.4. Threat of Substitutes
- 4.1.5. Competitive Rivalry
- 4.2. PESTEL analysis
- 4.3. BCG Analysis
- 4.3.1. Stars (High Growth, High Market Share)
- 4.3.2. Cash Cows (Low Growth, High Market Share)
- 4.3.3. Question Mark (High Growth, Low Market Share)
- 4.3.4. Dogs (Low Growth, Low Market Share)
- 4.4. Ansoff Matrix Analysis
- 4.5. Supply Chain Analysis
- 4.6. Regulatory Landscape
- 4.7. Current Market Potential and Opportunity Assessment (TAM–SAM–SOM Framework)
- 4.8. RAX Analyst Note
- 4.1. Porters Five Forces
- 5. Market Analysis, Insights and Forecast 2021-2033
- 5.1. Market Analysis, Insights and Forecast - by Type
- 5.1.1. CMOS
- 5.1.2. CCD
- 5.2. Market Analysis, Insights and Forecast - by End-user Industry
- 5.2.1. Consumer Electronics
- 5.2.2. Healthcare
- 5.2.3. Industrial
- 5.2.4. Security and Surveillance
- 5.2.5. Automotive and Transportation
- 5.2.6. Aerospace and Defense
- 5.2.7. Other End-user Industries
- 5.3. Market Analysis, Insights and Forecast - by Region
- 5.3.1. North America
- 5.3.2. South America
- 5.3.3. Europe
- 5.3.4. Middle East & Africa
- 5.3.5. Asia Pacific
- 5.1. Market Analysis, Insights and Forecast - by Type
- 6. Global APAC Image Sensors Industry Analysis, Insights and Forecast, 2021-2033
- 6.1. Market Analysis, Insights and Forecast - by Type
- 6.1.1. CMOS
- 6.1.2. CCD
- 6.2. Market Analysis, Insights and Forecast - by End-user Industry
- 6.2.1. Consumer Electronics
- 6.2.2. Healthcare
- 6.2.3. Industrial
- 6.2.4. Security and Surveillance
- 6.2.5. Automotive and Transportation
- 6.2.6. Aerospace and Defense
- 6.2.7. Other End-user Industries
- 6.1. Market Analysis, Insights and Forecast - by Type
- 7. North America APAC Image Sensors Industry Analysis, Insights and Forecast, 2020-2032
- 7.1. Market Analysis, Insights and Forecast - by Type
- 7.1.1. CMOS
- 7.1.2. CCD
- 7.2. Market Analysis, Insights and Forecast - by End-user Industry
- 7.2.1. Consumer Electronics
- 7.2.2. Healthcare
- 7.2.3. Industrial
- 7.2.4. Security and Surveillance
- 7.2.5. Automotive and Transportation
- 7.2.6. Aerospace and Defense
- 7.2.7. Other End-user Industries
- 7.1. Market Analysis, Insights and Forecast - by Type
- 8. South America APAC Image Sensors Industry Analysis, Insights and Forecast, 2020-2032
- 8.1. Market Analysis, Insights and Forecast - by Type
- 8.1.1. CMOS
- 8.1.2. CCD
- 8.2. Market Analysis, Insights and Forecast - by End-user Industry
- 8.2.1. Consumer Electronics
- 8.2.2. Healthcare
- 8.2.3. Industrial
- 8.2.4. Security and Surveillance
- 8.2.5. Automotive and Transportation
- 8.2.6. Aerospace and Defense
- 8.2.7. Other End-user Industries
- 8.1. Market Analysis, Insights and Forecast - by Type
- 9. Europe APAC Image Sensors Industry Analysis, Insights and Forecast, 2020-2032
- 9.1. Market Analysis, Insights and Forecast - by Type
- 9.1.1. CMOS
- 9.1.2. CCD
- 9.2. Market Analysis, Insights and Forecast - by End-user Industry
- 9.2.1. Consumer Electronics
- 9.2.2. Healthcare
- 9.2.3. Industrial
- 9.2.4. Security and Surveillance
- 9.2.5. Automotive and Transportation
- 9.2.6. Aerospace and Defense
- 9.2.7. Other End-user Industries
- 9.1. Market Analysis, Insights and Forecast - by Type
- 10. Middle East & Africa APAC Image Sensors Industry Analysis, Insights and Forecast, 2020-2032
- 10.1. Market Analysis, Insights and Forecast - by Type
- 10.1.1. CMOS
- 10.1.2. CCD
- 10.2. Market Analysis, Insights and Forecast - by End-user Industry
- 10.2.1. Consumer Electronics
- 10.2.2. Healthcare
- 10.2.3. Industrial
- 10.2.4. Security and Surveillance
- 10.2.5. Automotive and Transportation
- 10.2.6. Aerospace and Defense
- 10.2.7. Other End-user Industries
- 10.1. Market Analysis, Insights and Forecast - by Type
- 11. Asia Pacific APAC Image Sensors Industry Analysis, Insights and Forecast, 2020-2032
- 11.1. Market Analysis, Insights and Forecast - by Type
- 11.1.1. CMOS
- 11.1.2. CCD
- 11.2. Market Analysis, Insights and Forecast - by End-user Industry
- 11.2.1. Consumer Electronics
- 11.2.2. Healthcare
- 11.2.3. Industrial
- 11.2.4. Security and Surveillance
- 11.2.5. Automotive and Transportation
- 11.2.6. Aerospace and Defense
- 11.2.7. Other End-user Industries
- 11.1. Market Analysis, Insights and Forecast - by Type
- 12. Competitive Analysis
- 12.1. Company Profiles
- 12.1.1 Canon Inc
- 12.1.1.1. Company Overview
- 12.1.1.2. Products
- 12.1.1.3. Company Financials
- 12.1.1.4. SWOT Analysis
- 12.1.2 Omnivision Technologies Inc
- 12.1.2.1. Company Overview
- 12.1.2.2. Products
- 12.1.2.3. Company Financials
- 12.1.2.4. SWOT Analysis
- 12.1.3 Teledyne DALSA Inc
- 12.1.3.1. Company Overview
- 12.1.3.2. Products
- 12.1.3.3. Company Financials
- 12.1.3.4. SWOT Analysis
- 12.1.4 Gpixel Inc
- 12.1.4.1. Company Overview
- 12.1.4.2. Products
- 12.1.4.3. Company Financials
- 12.1.4.4. SWOT Analysis
- 12.1.5 Samsung Electronics Co Ltd
- 12.1.5.1. Company Overview
- 12.1.5.2. Products
- 12.1.5.3. Company Financials
- 12.1.5.4. SWOT Analysis
- 12.1.6 STMicroelectronics NV
- 12.1.6.1. Company Overview
- 12.1.6.2. Products
- 12.1.6.3. Company Financials
- 12.1.6.4. SWOT Analysis
- 12.1.7 SmartSens Technology Co Ltd
- 12.1.7.1. Company Overview
- 12.1.7.2. Products
- 12.1.7.3. Company Financials
- 12.1.7.4. SWOT Analysis
- 12.1.8 ON Semiconductor Corporation
- 12.1.8.1. Company Overview
- 12.1.8.2. Products
- 12.1.8.3. Company Financials
- 12.1.8.4. SWOT Analysis
- 12.1.9 GalaxyCore Inc
- 12.1.9.1. Company Overview
- 12.1.9.2. Products
- 12.1.9.3. Company Financials
- 12.1.9.4. SWOT Analysis
- 12.1.10 Hynix Inc
- 12.1.10.1. Company Overview
- 12.1.10.2. Products
- 12.1.10.3. Company Financials
- 12.1.10.4. SWOT Analysis
- 12.1.11 Ams AG
- 12.1.11.1. Company Overview
- 12.1.11.2. Products
- 12.1.11.3. Company Financials
- 12.1.11.4. SWOT Analysis
- 12.1.12 Panasonic Corporation
- 12.1.12.1. Company Overview
- 12.1.12.2. Products
- 12.1.12.3. Company Financials
- 12.1.12.4. SWOT Analysis
- 12.1.13 Sony Corporation
- 12.1.13.1. Company Overview
- 12.1.13.2. Products
- 12.1.13.3. Company Financials
- 12.1.13.4. SWOT Analysis
- 12.1.1 Canon Inc
- 12.2. Market Entropy
- 12.2.1 Company's Key Areas Served
- 12.2.2 Recent Developments
- 12.3. Company Market Share Analysis 2025
- 12.3.1 Top 5 Companies Market Share Analysis
- 12.3.2 Top 3 Companies Market Share Analysis
- 12.4. List of Potential Customers
- 13. Research Methodology
List of Figures
- Figure 1: Global APAC Image Sensors Industry Revenue Breakdown (billion, %) by Region 2025 & 2033
- Figure 2: Global APAC Image Sensors Industry Volume Breakdown (K Unit, %) by Region 2025 & 2033
- Figure 3: North America APAC Image Sensors Industry Revenue (billion), by Type 2025 & 2033
- Figure 4: North America APAC Image Sensors Industry Volume (K Unit), by Type 2025 & 2033
- Figure 5: North America APAC Image Sensors Industry Revenue Share (%), by Type 2025 & 2033
- Figure 6: North America APAC Image Sensors Industry Volume Share (%), by Type 2025 & 2033
- Figure 7: North America APAC Image Sensors Industry Revenue (billion), by End-user Industry 2025 & 2033
- Figure 8: North America APAC Image Sensors Industry Volume (K Unit), by End-user Industry 2025 & 2033
- Figure 9: North America APAC Image Sensors Industry Revenue Share (%), by End-user Industry 2025 & 2033
- Figure 10: North America APAC Image Sensors Industry Volume Share (%), by End-user Industry 2025 & 2033
- Figure 11: North America APAC Image Sensors Industry Revenue (billion), by Country 2025 & 2033
- Figure 12: North America APAC Image Sensors Industry Volume (K Unit), by Country 2025 & 2033
- Figure 13: North America APAC Image Sensors Industry Revenue Share (%), by Country 2025 & 2033
- Figure 14: North America APAC Image Sensors Industry Volume Share (%), by Country 2025 & 2033
- Figure 15: South America APAC Image Sensors Industry Revenue (billion), by Type 2025 & 2033
- Figure 16: South America APAC Image Sensors Industry Volume (K Unit), by Type 2025 & 2033
- Figure 17: South America APAC Image Sensors Industry Revenue Share (%), by Type 2025 & 2033
- Figure 18: South America APAC Image Sensors Industry Volume Share (%), by Type 2025 & 2033
- Figure 19: South America APAC Image Sensors Industry Revenue (billion), by End-user Industry 2025 & 2033
- Figure 20: South America APAC Image Sensors Industry Volume (K Unit), by End-user Industry 2025 & 2033
- Figure 21: South America APAC Image Sensors Industry Revenue Share (%), by End-user Industry 2025 & 2033
- Figure 22: South America APAC Image Sensors Industry Volume Share (%), by End-user Industry 2025 & 2033
- Figure 23: South America APAC Image Sensors Industry Revenue (billion), by Country 2025 & 2033
- Figure 24: South America APAC Image Sensors Industry Volume (K Unit), by Country 2025 & 2033
- Figure 25: South America APAC Image Sensors Industry Revenue Share (%), by Country 2025 & 2033
- Figure 26: South America APAC Image Sensors Industry Volume Share (%), by Country 2025 & 2033
- Figure 27: Europe APAC Image Sensors Industry Revenue (billion), by Type 2025 & 2033
- Figure 28: Europe APAC Image Sensors Industry Volume (K Unit), by Type 2025 & 2033
- Figure 29: Europe APAC Image Sensors Industry Revenue Share (%), by Type 2025 & 2033
- Figure 30: Europe APAC Image Sensors Industry Volume Share (%), by Type 2025 & 2033
- Figure 31: Europe APAC Image Sensors Industry Revenue (billion), by End-user Industry 2025 & 2033
- Figure 32: Europe APAC Image Sensors Industry Volume (K Unit), by End-user Industry 2025 & 2033
- Figure 33: Europe APAC Image Sensors Industry Revenue Share (%), by End-user Industry 2025 & 2033
- Figure 34: Europe APAC Image Sensors Industry Volume Share (%), by End-user Industry 2025 & 2033
- Figure 35: Europe APAC Image Sensors Industry Revenue (billion), by Country 2025 & 2033
- Figure 36: Europe APAC Image Sensors Industry Volume (K Unit), by Country 2025 & 2033
- Figure 37: Europe APAC Image Sensors Industry Revenue Share (%), by Country 2025 & 2033
- Figure 38: Europe APAC Image Sensors Industry Volume Share (%), by Country 2025 & 2033
- Figure 39: Middle East & Africa APAC Image Sensors Industry Revenue (billion), by Type 2025 & 2033
- Figure 40: Middle East & Africa APAC Image Sensors Industry Volume (K Unit), by Type 2025 & 2033
- Figure 41: Middle East & Africa APAC Image Sensors Industry Revenue Share (%), by Type 2025 & 2033
- Figure 42: Middle East & Africa APAC Image Sensors Industry Volume Share (%), by Type 2025 & 2033
- Figure 43: Middle East & Africa APAC Image Sensors Industry Revenue (billion), by End-user Industry 2025 & 2033
- Figure 44: Middle East & Africa APAC Image Sensors Industry Volume (K Unit), by End-user Industry 2025 & 2033
- Figure 45: Middle East & Africa APAC Image Sensors Industry Revenue Share (%), by End-user Industry 2025 & 2033
- Figure 46: Middle East & Africa APAC Image Sensors Industry Volume Share (%), by End-user Industry 2025 & 2033
- Figure 47: Middle East & Africa APAC Image Sensors Industry Revenue (billion), by Country 2025 & 2033
- Figure 48: Middle East & Africa APAC Image Sensors Industry Volume (K Unit), by Country 2025 & 2033
- Figure 49: Middle East & Africa APAC Image Sensors Industry Revenue Share (%), by Country 2025 & 2033
- Figure 50: Middle East & Africa APAC Image Sensors Industry Volume Share (%), by Country 2025 & 2033
- Figure 51: Asia Pacific APAC Image Sensors Industry Revenue (billion), by Type 2025 & 2033
- Figure 52: Asia Pacific APAC Image Sensors Industry Volume (K Unit), by Type 2025 & 2033
- Figure 53: Asia Pacific APAC Image Sensors Industry Revenue Share (%), by Type 2025 & 2033
- Figure 54: Asia Pacific APAC Image Sensors Industry Volume Share (%), by Type 2025 & 2033
- Figure 55: Asia Pacific APAC Image Sensors Industry Revenue (billion), by End-user Industry 2025 & 2033
- Figure 56: Asia Pacific APAC Image Sensors Industry Volume (K Unit), by End-user Industry 2025 & 2033
- Figure 57: Asia Pacific APAC Image Sensors Industry Revenue Share (%), by End-user Industry 2025 & 2033
- Figure 58: Asia Pacific APAC Image Sensors Industry Volume Share (%), by End-user Industry 2025 & 2033
- Figure 59: Asia Pacific APAC Image Sensors Industry Revenue (billion), by Country 2025 & 2033
- Figure 60: Asia Pacific APAC Image Sensors Industry Volume (K Unit), by Country 2025 & 2033
- Figure 61: Asia Pacific APAC Image Sensors Industry Revenue Share (%), by Country 2025 & 2033
- Figure 62: Asia Pacific APAC Image Sensors Industry Volume Share (%), by Country 2025 & 2033
List of Tables
- Table 1: Global APAC Image Sensors Industry Revenue billion Forecast, by Type 2020 & 2033
- Table 2: Global APAC Image Sensors Industry Volume K Unit Forecast, by Type 2020 & 2033
- Table 3: Global APAC Image Sensors Industry Revenue billion Forecast, by End-user Industry 2020 & 2033
- Table 4: Global APAC Image Sensors Industry Volume K Unit Forecast, by End-user Industry 2020 & 2033
- Table 5: Global APAC Image Sensors Industry Revenue billion Forecast, by Region 2020 & 2033
- Table 6: Global APAC Image Sensors Industry Volume K Unit Forecast, by Region 2020 & 2033
- Table 7: Global APAC Image Sensors Industry Revenue billion Forecast, by Type 2020 & 2033
- Table 8: Global APAC Image Sensors Industry Volume K Unit Forecast, by Type 2020 & 2033
- Table 9: Global APAC Image Sensors Industry Revenue billion Forecast, by End-user Industry 2020 & 2033
- Table 10: Global APAC Image Sensors Industry Volume K Unit Forecast, by End-user Industry 2020 & 2033
- Table 11: Global APAC Image Sensors Industry Revenue billion Forecast, by Country 2020 & 2033
- Table 12: Global APAC Image Sensors Industry Volume K Unit Forecast, by Country 2020 & 2033
- Table 13: United States APAC Image Sensors Industry Revenue (billion) Forecast, by Application 2020 & 2033
- Table 14: United States APAC Image Sensors Industry Volume (K Unit) Forecast, by Application 2020 & 2033
- Table 15: Canada APAC Image Sensors Industry Revenue (billion) Forecast, by Application 2020 & 2033
- Table 16: Canada APAC Image Sensors Industry Volume (K Unit) Forecast, by Application 2020 & 2033
- Table 17: Mexico APAC Image Sensors Industry Revenue (billion) Forecast, by Application 2020 & 2033
- Table 18: Mexico APAC Image Sensors Industry Volume (K Unit) Forecast, by Application 2020 & 2033
- Table 19: Global APAC Image Sensors Industry Revenue billion Forecast, by Type 2020 & 2033
- Table 20: Global APAC Image Sensors Industry Volume K Unit Forecast, by Type 2020 & 2033
- Table 21: Global APAC Image Sensors Industry Revenue billion Forecast, by End-user Industry 2020 & 2033
- Table 22: Global APAC Image Sensors Industry Volume K Unit Forecast, by End-user Industry 2020 & 2033
- Table 23: Global APAC Image Sensors Industry Revenue billion Forecast, by Country 2020 & 2033
- Table 24: Global APAC Image Sensors Industry Volume K Unit Forecast, by Country 2020 & 2033
- Table 25: Brazil APAC Image Sensors Industry Revenue (billion) Forecast, by Application 2020 & 2033
- Table 26: Brazil APAC Image Sensors Industry Volume (K Unit) Forecast, by Application 2020 & 2033
- Table 27: Argentina APAC Image Sensors Industry Revenue (billion) Forecast, by Application 2020 & 2033
- Table 28: Argentina APAC Image Sensors Industry Volume (K Unit) Forecast, by Application 2020 & 2033
- Table 29: Rest of South America APAC Image Sensors Industry Revenue (billion) Forecast, by Application 2020 & 2033
- Table 30: Rest of South America APAC Image Sensors Industry Volume (K Unit) Forecast, by Application 2020 & 2033
- Table 31: Global APAC Image Sensors Industry Revenue billion Forecast, by Type 2020 & 2033
- Table 32: Global APAC Image Sensors Industry Volume K Unit Forecast, by Type 2020 & 2033
- Table 33: Global APAC Image Sensors Industry Revenue billion Forecast, by End-user Industry 2020 & 2033
- Table 34: Global APAC Image Sensors Industry Volume K Unit Forecast, by End-user Industry 2020 & 2033
- Table 35: Global APAC Image Sensors Industry Revenue billion Forecast, by Country 2020 & 2033
- Table 36: Global APAC Image Sensors Industry Volume K Unit Forecast, by Country 2020 & 2033
- Table 37: United Kingdom APAC Image Sensors Industry Revenue (billion) Forecast, by Application 2020 & 2033
- Table 38: United Kingdom APAC Image Sensors Industry Volume (K Unit) Forecast, by Application 2020 & 2033
- Table 39: Germany APAC Image Sensors Industry Revenue (billion) Forecast, by Application 2020 & 2033
- Table 40: Germany APAC Image Sensors Industry Volume (K Unit) Forecast, by Application 2020 & 2033
- Table 41: France APAC Image Sensors Industry Revenue (billion) Forecast, by Application 2020 & 2033
- Table 42: France APAC Image Sensors Industry Volume (K Unit) Forecast, by Application 2020 & 2033
- Table 43: Italy APAC Image Sensors Industry Revenue (billion) Forecast, by Application 2020 & 2033
- Table 44: Italy APAC Image Sensors Industry Volume (K Unit) Forecast, by Application 2020 & 2033
- Table 45: Spain APAC Image Sensors Industry Revenue (billion) Forecast, by Application 2020 & 2033
- Table 46: Spain APAC Image Sensors Industry Volume (K Unit) Forecast, by Application 2020 & 2033
- Table 47: Russia APAC Image Sensors Industry Revenue (billion) Forecast, by Application 2020 & 2033
- Table 48: Russia APAC Image Sensors Industry Volume (K Unit) Forecast, by Application 2020 & 2033
- Table 49: Benelux APAC Image Sensors Industry Revenue (billion) Forecast, by Application 2020 & 2033
- Table 50: Benelux APAC Image Sensors Industry Volume (K Unit) Forecast, by Application 2020 & 2033
- Table 51: Nordics APAC Image Sensors Industry Revenue (billion) Forecast, by Application 2020 & 2033
- Table 52: Nordics APAC Image Sensors Industry Volume (K Unit) Forecast, by Application 2020 & 2033
- Table 53: Rest of Europe APAC Image Sensors Industry Revenue (billion) Forecast, by Application 2020 & 2033
- Table 54: Rest of Europe APAC Image Sensors Industry Volume (K Unit) Forecast, by Application 2020 & 2033
- Table 55: Global APAC Image Sensors Industry Revenue billion Forecast, by Type 2020 & 2033
- Table 56: Global APAC Image Sensors Industry Volume K Unit Forecast, by Type 2020 & 2033
- Table 57: Global APAC Image Sensors Industry Revenue billion Forecast, by End-user Industry 2020 & 2033
- Table 58: Global APAC Image Sensors Industry Volume K Unit Forecast, by End-user Industry 2020 & 2033
- Table 59: Global APAC Image Sensors Industry Revenue billion Forecast, by Country 2020 & 2033
- Table 60: Global APAC Image Sensors Industry Volume K Unit Forecast, by Country 2020 & 2033
- Table 61: Turkey APAC Image Sensors Industry Revenue (billion) Forecast, by Application 2020 & 2033
- Table 62: Turkey APAC Image Sensors Industry Volume (K Unit) Forecast, by Application 2020 & 2033
- Table 63: Israel APAC Image Sensors Industry Revenue (billion) Forecast, by Application 2020 & 2033
- Table 64: Israel APAC Image Sensors Industry Volume (K Unit) Forecast, by Application 2020 & 2033
- Table 65: GCC APAC Image Sensors Industry Revenue (billion) Forecast, by Application 2020 & 2033
- Table 66: GCC APAC Image Sensors Industry Volume (K Unit) Forecast, by Application 2020 & 2033
- Table 67: North Africa APAC Image Sensors Industry Revenue (billion) Forecast, by Application 2020 & 2033
- Table 68: North Africa APAC Image Sensors Industry Volume (K Unit) Forecast, by Application 2020 & 2033
- Table 69: South Africa APAC Image Sensors Industry Revenue (billion) Forecast, by Application 2020 & 2033
- Table 70: South Africa APAC Image Sensors Industry Volume (K Unit) Forecast, by Application 2020 & 2033
- Table 71: Rest of Middle East & Africa APAC Image Sensors Industry Revenue (billion) Forecast, by Application 2020 & 2033
- Table 72: Rest of Middle East & Africa APAC Image Sensors Industry Volume (K Unit) Forecast, by Application 2020 & 2033
- Table 73: Global APAC Image Sensors Industry Revenue billion Forecast, by Type 2020 & 2033
- Table 74: Global APAC Image Sensors Industry Volume K Unit Forecast, by Type 2020 & 2033
- Table 75: Global APAC Image Sensors Industry Revenue billion Forecast, by End-user Industry 2020 & 2033
- Table 76: Global APAC Image Sensors Industry Volume K Unit Forecast, by End-user Industry 2020 & 2033
- Table 77: Global APAC Image Sensors Industry Revenue billion Forecast, by Country 2020 & 2033
- Table 78: Global APAC Image Sensors Industry Volume K Unit Forecast, by Country 2020 & 2033
- Table 79: China APAC Image Sensors Industry Revenue (billion) Forecast, by Application 2020 & 2033
- Table 80: China APAC Image Sensors Industry Volume (K Unit) Forecast, by Application 2020 & 2033
- Table 81: India APAC Image Sensors Industry Revenue (billion) Forecast, by Application 2020 & 2033
- Table 82: India APAC Image Sensors Industry Volume (K Unit) Forecast, by Application 2020 & 2033
- Table 83: Japan APAC Image Sensors Industry Revenue (billion) Forecast, by Application 2020 & 2033
- Table 84: Japan APAC Image Sensors Industry Volume (K Unit) Forecast, by Application 2020 & 2033
- Table 85: South Korea APAC Image Sensors Industry Revenue (billion) Forecast, by Application 2020 & 2033
- Table 86: South Korea APAC Image Sensors Industry Volume (K Unit) Forecast, by Application 2020 & 2033
- Table 87: ASEAN APAC Image Sensors Industry Revenue (billion) Forecast, by Application 2020 & 2033
- Table 88: ASEAN APAC Image Sensors Industry Volume (K Unit) Forecast, by Application 2020 & 2033
- Table 89: Oceania APAC Image Sensors Industry Revenue (billion) Forecast, by Application 2020 & 2033
- Table 90: Oceania APAC Image Sensors Industry Volume (K Unit) Forecast, by Application 2020 & 2033
- Table 91: Rest of Asia Pacific APAC Image Sensors Industry Revenue (billion) Forecast, by Application 2020 & 2033
- Table 92: Rest of Asia Pacific APAC Image Sensors Industry Volume (K Unit) Forecast, by Application 2020 & 2033
Frequently Asked Questions
1. What is the projected Compound Annual Growth Rate (CAGR) of the APAC Image Sensors Industry?
The projected CAGR is approximately 12.2%.
2. Which companies are prominent players in the APAC Image Sensors Industry?
Key companies in the market include Canon Inc, Omnivision Technologies Inc, Teledyne DALSA Inc, Gpixel Inc, Samsung Electronics Co Ltd, STMicroelectronics NV, SmartSens Technology Co Ltd , ON Semiconductor Corporation, GalaxyCore Inc, Hynix Inc, Ams AG, Panasonic Corporation, Sony Corporation.
3. What are the main segments of the APAC Image Sensors Industry?
The market segments include Type, End-user Industry.
4. Can you provide details about the market size?
The market size is estimated to be USD 83.43 billion as of 2022.
5. What are some drivers contributing to market growth?
; Rising popularity of ADAS system is Boosting Image Sensor market demandfrom Automotive Sector.; Ongoing shift to CMOS technology and improvement in image quality favouring image sensor market development..
6. What are the notable trends driving market growth?
Consumer Electronics to Show Significant Growth.
7. Are there any restraints impacting market growth?
; Easy availability of light detection and ranging (LiDAR) solutions..
8. Can you provide examples of recent developments in the market?
N/A
9. What pricing options are available for accessing the report?
Pricing options include single-user, multi-user, and enterprise licenses priced at USD 4750, USD 5250, and USD 8750 respectively.
10. Is the market size provided in terms of value or volume?
The market size is provided in terms of value, measured in billion and volume, measured in K Unit.
11. Are there any specific market keywords associated with the report?
Yes, the market keyword associated with the report is "APAC Image Sensors Industry," which aids in identifying and referencing the specific market segment covered.
12. How do I determine which pricing option suits my needs best?
The pricing options vary based on user requirements and access needs. Individual users may opt for single-user licenses, while businesses requiring broader access may choose multi-user or enterprise licenses for cost-effective access to the report.
13. Are there any additional resources or data provided in the APAC Image Sensors Industry report?
While the report offers comprehensive insights, it's advisable to review the specific contents or supplementary materials provided to ascertain if additional resources or data are available.
14. How can I stay updated on further developments or reports in the APAC Image Sensors Industry?
To stay informed about further developments, trends, and reports in the APAC Image Sensors Industry, consider subscribing to industry newsletters, following relevant companies and organizations, or regularly checking reputable industry news sources and publications.
Methodology
Step 1 - Identification of Relevant Samples Size from Population Database


Step 2 - Approaches for Defining Global Market Size (Value, Volume* & Price*)

Note*: In applicable scenarios
Step 3 - Data Sources
Primary Research
- Web Analytics
- Survey Reports
- Research Institute
- Latest Research Reports
- Opinion Leaders
Secondary Research
- Annual Reports
- White Paper
- Latest Press Release
- Industry Association
- Paid Database
- Investor Presentations

Step 4 - Data Triangulation
Involves using different sources of information in order to increase the validity of a study
These sources are likely to be stakeholders in a program - participants, other researchers, program staff, other community members, and so on.
Then we put all data in single framework & apply various statistical tools to find out the dynamic on the market.
During the analysis stage, feedback from the stakeholder groups would be compared to determine areas of agreement as well as areas of divergence