

Key Insights
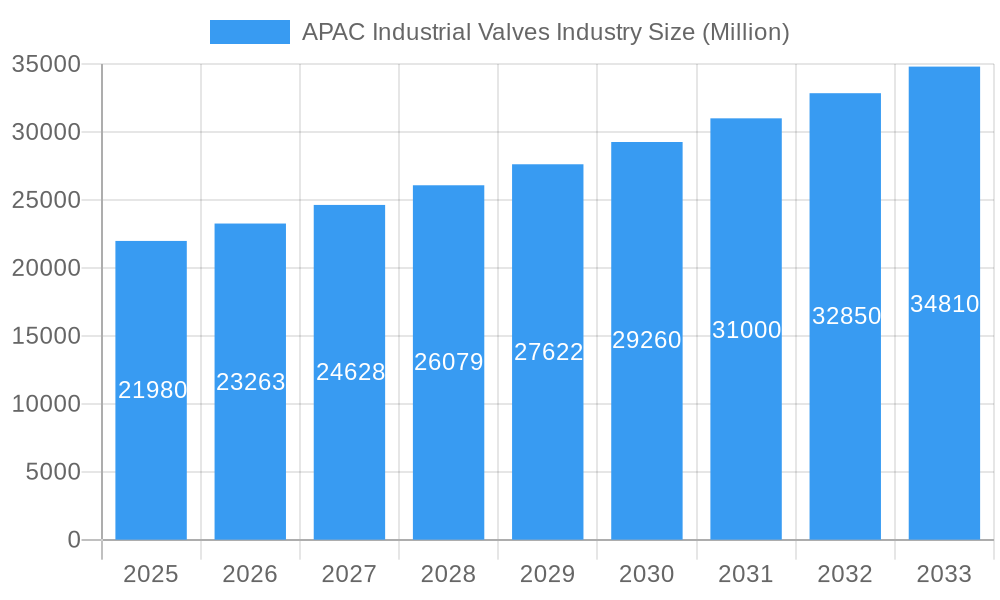
The Asia-Pacific (APAC) industrial valves market, valued at $21.98 billion in 2025, is projected to experience robust growth, driven by a Compound Annual Growth Rate (CAGR) of 5.67% from 2025 to 2033. This expansion is fueled by several key factors. Firstly, the burgeoning industrial sectors across the region, particularly in China, India, and South Korea, are significantly increasing the demand for valves across diverse applications. Rapid industrialization, coupled with substantial investments in infrastructure development—including power generation, water and wastewater management, and oil and gas—are primary drivers. The growing emphasis on automation and process optimization within these industries is further boosting demand for advanced valve technologies, such as smart valves and automated control systems. Furthermore, the increasing adoption of stringent environmental regulations is propelling the adoption of more efficient and environmentally friendly valves, creating a market opportunity for manufacturers offering sustainable solutions. The downstream segments, notably food processing and pulp & paper, also contribute significantly to overall market growth, reflecting the expansion of these sectors within the APAC region.
APAC Industrial Valves Industry Market Size (In Billion)
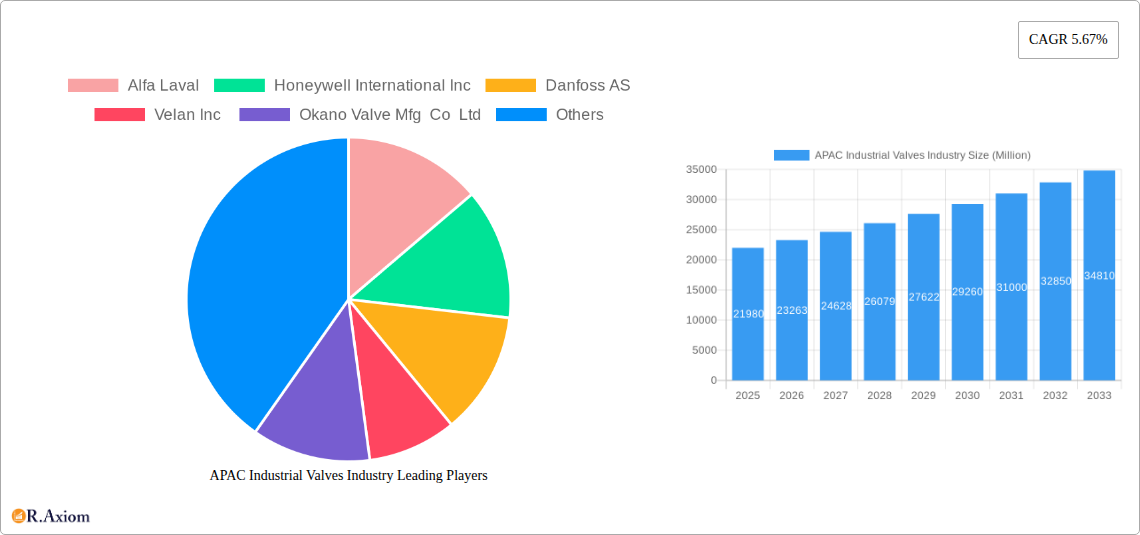
The market segmentation reveals a diverse product landscape. Quarter-turn valves, owing to their ease of operation and suitability for high-pressure applications, dominate the product type segment. Among application segments, power generation and water/wastewater management (including desalination) hold the largest shares, reflecting the region's significant investments in these critical infrastructure areas. Competitive landscape analysis reveals a mix of established multinational corporations and regional players. Companies such as Alfa Laval, Honeywell, Danfoss, and Flowserve are major players, leveraging their technological expertise and global reach. However, several regional companies are also gaining market share by focusing on specific niche applications and providing localized support. The continued investment in infrastructure, technological advancements, and the region's overall economic growth will all contribute to the sustained expansion of the APAC industrial valves market throughout the forecast period.
APAC Industrial Valves Industry Company Market Share
This detailed report provides a comprehensive analysis of the Asia-Pacific (APAC) industrial valves market, offering invaluable insights for stakeholders across the value chain. The study period spans from 2019 to 2033, with 2025 serving as both the base and estimated year. The report leverages rigorous data analysis to forecast market trends from 2025 to 2033, building on historical data from 2019 to 2024. Key market segments, including downstream applications, valve types, products, and applications, are thoroughly examined. Leading players such as Alfa Laval, Honeywell International Inc., and others are profiled, providing a 360-degree view of this dynamic market.
APAC Industrial Valves Industry Market Concentration & Innovation
The APAC industrial valves market exhibits a moderately concentrated structure, with the top 10 players holding approximately xx% of the market share in 2024. This concentration is driven by the presence of established global players alongside several regional manufacturers. Market share dynamics are influenced by factors such as technological innovation, strategic partnerships, and mergers and acquisitions (M&A). Innovation plays a pivotal role, with companies investing heavily in developing advanced valve technologies such as smart valves, automated control systems, and specialized materials for improved efficiency, durability, and safety.
- Market Concentration: Top 10 players hold approximately xx% market share (2024).
- Innovation Drivers: Smart valves, automated control systems, advanced materials.
- Regulatory Frameworks: Stringent safety and environmental regulations drive innovation and adoption of advanced technologies.
- Product Substitutes: Limited direct substitutes exist, but competitive pressures arise from alternative fluid control solutions.
- End-User Trends: Growing demand from industries like water treatment, oil & gas, and power generation.
- M&A Activities: The past five years witnessed xx M&A deals with a total value of approximately $xx Million, primarily focused on expanding geographic reach and technological capabilities.
APAC Industrial Valves Industry Industry Trends & Insights
The APAC industrial valves market is projected to witness a Compound Annual Growth Rate (CAGR) of xx% during the forecast period (2025-2033). This growth is fueled by several key factors, including rapid industrialization, infrastructure development, and increasing demand from key sectors such as water and wastewater management, power generation, and the chemical industry. Technological advancements such as the integration of smart sensors and digital control systems are also driving market expansion. Competitive intensity is high, with companies focusing on product differentiation, cost optimization, and strategic partnerships to gain market share. Market penetration of advanced valve technologies remains relatively low, presenting significant opportunities for growth.
Dominant Markets & Segments in APAC Industrial Valves Industry
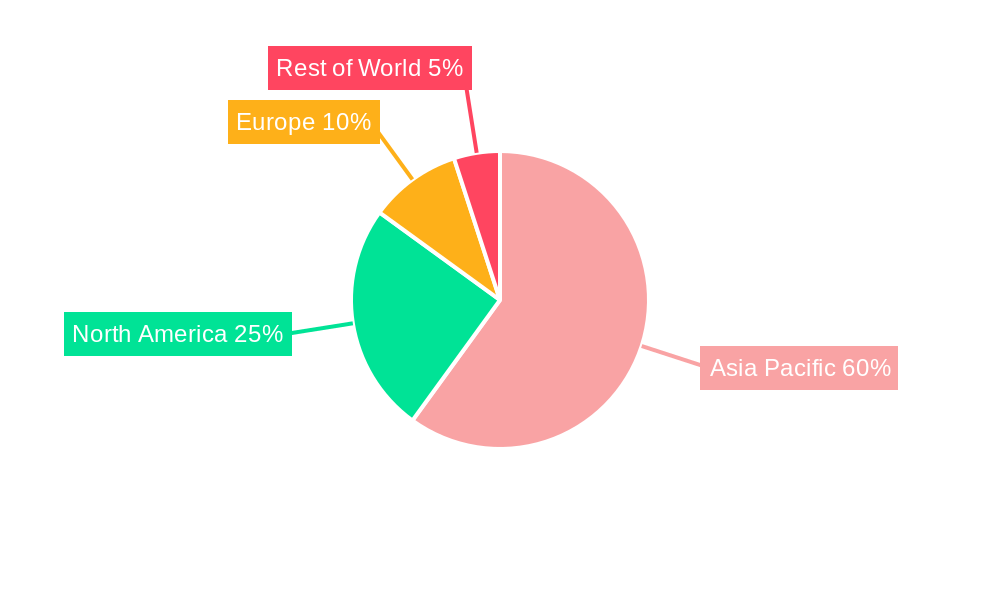
The APAC industrial valves market is geographically diverse, with significant growth potential across various countries and regions. China and India are currently the leading markets, driven by robust industrial growth and infrastructure development. The Water and Wastewater Management segment is expected to experience the highest growth, driven by increasing investments in water infrastructure projects and the growing need for efficient water management solutions. Within valve types, Ball Valves and Butterfly Valves hold dominant market share due to their versatility and cost-effectiveness.
- Leading Regions/Countries: China, India, followed by Southeast Asia.
- Key Drivers (Water & Wastewater): Increasing investments in water infrastructure, growing urbanization, stringent water quality regulations.
- Key Drivers (Power Generation): Rising energy demand, expansion of renewable energy sources, modernization of power plants.
- Dominant Segments:
- By Application: Water and Wastewater Management (including desalination) displays the highest growth potential.
- By Type: Ball valves and Butterfly valves command significant market share due to their versatility and affordability.
- By Product: Quarter-turn valves are favored for their speed and ease of operation.
APAC Industrial Valves Industry Product Developments
Recent product innovations focus on enhancing valve performance, reliability, and integration with smart control systems. This includes the development of advanced materials, improved sealing technologies, and the integration of IoT sensors for remote monitoring and predictive maintenance. These advancements address industry needs for increased efficiency, reduced downtime, and enhanced safety. The market is witnessing a growing trend towards smart valves, enabling real-time monitoring, data analysis, and remote control.
Report Scope & Segmentation Analysis
This report segments the APAC industrial valves market based on various parameters:
Downstream Applications: Food processing, pulp & paper, and other applications (chemicals, oil & gas). Growth projections vary based on industry-specific demand and regulatory changes. Market size for Food Processing is estimated at $xx Million in 2025.
Valve Type: Butterfly, ball, globe, gate, plug, and other types. Market size estimations reflect technological advancements and cost considerations for each type.
Product: Quarter-turn, multi-turn, and other control valves. The market is witnessing significant growth in smart and automated control valves.
Application: Power generation, water & wastewater management (including desalination), oil & gas, and chemicals. Growth is driven by specific industry demands and infrastructure projects.
Key Drivers of APAC Industrial Valves Industry Growth
The APAC industrial valves market growth is driven by several key factors:
- Rapid Industrialization: Significant growth across various industries such as manufacturing, energy, and infrastructure.
- Infrastructure Development: Massive investments in water treatment, power generation, and other key sectors.
- Technological Advancements: The adoption of smart valves and digital control systems improves efficiency and reliability.
- Government Regulations: Stringent environmental regulations drive demand for advanced valve technologies with lower emissions.
Challenges in the APAP Industrial Valves Industry Sector
The APAC industrial valves market faces several challenges:
- Supply Chain Disruptions: Global supply chain volatility impacting raw material availability and manufacturing costs. Estimated impact on market growth: xx%.
- Intense Competition: Presence of several established global and regional players creating a competitive landscape.
- Economic Fluctuations: Regional economic downturns can impact investment in capital-intensive projects.
Emerging Opportunities in APAC Industrial Valves Industry
The APAC industrial valves market presents exciting opportunities:
- Smart Valves & IoT Integration: Growing demand for remote monitoring, predictive maintenance, and data-driven decision-making.
- Expansion into Renewable Energy: Increased investment in renewable energy sources drives demand for specialized valves.
- Focus on Sustainability: Growing emphasis on environmentally friendly manufacturing practices and sustainable water management solutions.
Leading Players in the APAC Industrial Valves Industry Market
- Alfa Laval
- Honeywell International Inc
- Danfoss AS
- Velan Inc
- Okano Valve Mfg Co Ltd
- SAMSON AKTIENGESELLSCHAFT
- Flowserve Corporation
- The Weir Group PLC
- Georg Fischer Ltd
- Baker Hughes
- Emerson Electric Co
- CIRCOR International Inc
- AVK Holding AS
- PARKER HANNIFIN CORP
- EBRO ARMATUREN Gebr Brer GmbH
- Hitachi Metals Ltd
- ITT Inc
- NIBCO
- IMI Critical Engineering
- Crane Co
- Valvitalia SpA
- Curtiss-Wright Corporation
- Schlumberger Limited
- KITZ Corporation
Key Developments in APAC Industrial Valves Industry Industry
February 2022: Emerson announced the opening of a new integrated manufacturing facility in Chennai, India, expanding its production capacity for fluid control and pneumatics products. This significantly enhances Emerson's market position in the region.
March 2022: Flowserve's partnership with Gradiant accelerates its growth in the water technology market within APAC, strengthening its presence in this high-growth segment.
Strategic Outlook for APAC Industrial Valves Industry Market
The APAC industrial valves market is poised for continued growth, driven by sustained industrial expansion, infrastructure development, and the adoption of advanced technologies. Opportunities lie in catering to the growing demand for smart valves, sustainable solutions, and specialized applications within key sectors like renewable energy and water management. Companies focusing on innovation, strategic partnerships, and efficient supply chain management will be best positioned to capture market share and drive future growth.
APAC Industrial Valves Industry Segmentation
-
1. Type
- 1.1. Butterfly Valve
- 1.2. Ball Valve
- 1.3. Globe Valve
- 1.4. Gate Valve
- 1.5. Plug Valve
- 1.6. Other Types
-
2. Product
- 2.1. Quarter-turn Valve
- 2.2. Multi-turn Valve
- 2.3. Other Products (Control Valves)
-
3. Application
- 3.1. Power
-
3.2. Water an
- 3.2.1. Metal, Mineral, and Mining
- 3.2.2. Other Applications
- 3.3. By Chemicals
-
3.4. Oil and Gas
- 3.4.1. Upstream
- 3.4.2. Mid-stream
- 3.4.3. Downstream
- 3.5. Food Processing
- 3.6. Pulp and Paper
-
4. Geography
- 4.1. China
- 4.2. India
- 4.3. Japan
- 4.4. South Korea
- 4.5. Malaysia
- 4.6. Thailand
- 4.7. Indonesia
- 4.8. Vietnam
- 4.9. Rest of Asia-Pacific
APAC Industrial Valves Industry Segmentation By Geography
- 1. China
- 2. India
- 3. Japan
- 4. South Korea
- 5. Malaysia
- 6. Thailand
- 7. Indonesia
- 8. Vietnam
- 9. Rest of Asia Pacific
APAC Industrial Valves Industry Regional Market Share
Geographic Coverage of APAC Industrial Valves Industry
APAC Industrial Valves Industry REPORT HIGHLIGHTS
| Aspects | Details |
|---|---|
| Study Period | 2020-2034 |
| Base Year | 2025 |
| Estimated Year | 2026 |
| Forecast Period | 2026-2034 |
| Historical Period | 2020-2025 |
| Growth Rate | CAGR of 5.67% from 2020-2034 |
| Segmentation |
|
Table of Contents
- 1. Introduction
- 1.1. Research Scope
- 1.2. Market Segmentation
- 1.3. Research Objective
- 1.4. Definitions and Assumptions
- 2. Executive Summary
- 2.1. Market Snapshot
- 3. Market Dynamics
- 3.1. Market Drivers
- 3.2. Market Restrains
- 3.3. Market Trends
- 3.4. Market Opportunities
- 4. Market Factor Analysis
- 4.1. Porters Five Forces
- 4.1.1. Bargaining Power of Suppliers
- 4.1.2. Bargaining Power of Buyers
- 4.1.3. Threat of New Entrants
- 4.1.4. Threat of Substitutes
- 4.1.5. Competitive Rivalry
- 4.2. PESTEL analysis
- 4.3. BCG Analysis
- 4.3.1. Stars (High Growth, High Market Share)
- 4.3.2. Cash Cows (Low Growth, High Market Share)
- 4.3.3. Question Mark (High Growth, Low Market Share)
- 4.3.4. Dogs (Low Growth, Low Market Share)
- 4.4. Ansoff Matrix Analysis
- 4.5. Supply Chain Analysis
- 4.6. Regulatory Landscape
- 4.7. Current Market Potential and Opportunity Assessment (TAM–SAM–SOM Framework)
- 4.8. RAX Analyst Note
- 4.1. Porters Five Forces
- 5. Market Analysis, Insights and Forecast 2021-2033
- 5.1. Market Analysis, Insights and Forecast - by Type
- 5.1.1. Butterfly Valve
- 5.1.2. Ball Valve
- 5.1.3. Globe Valve
- 5.1.4. Gate Valve
- 5.1.5. Plug Valve
- 5.1.6. Other Types
- 5.2. Market Analysis, Insights and Forecast - by Product
- 5.2.1. Quarter-turn Valve
- 5.2.2. Multi-turn Valve
- 5.2.3. Other Products (Control Valves)
- 5.3. Market Analysis, Insights and Forecast - by Application
- 5.3.1. Power
- 5.3.2. Water an
- 5.3.2.1. Metal, Mineral, and Mining
- 5.3.2.2. Other Applications
- 5.3.3. By Chemicals
- 5.3.4. Oil and Gas
- 5.3.4.1. Upstream
- 5.3.4.2. Mid-stream
- 5.3.4.3. Downstream
- 5.3.5. Food Processing
- 5.3.6. Pulp and Paper
- 5.4. Market Analysis, Insights and Forecast - by Geography
- 5.4.1. China
- 5.4.2. India
- 5.4.3. Japan
- 5.4.4. South Korea
- 5.4.5. Malaysia
- 5.4.6. Thailand
- 5.4.7. Indonesia
- 5.4.8. Vietnam
- 5.4.9. Rest of Asia-Pacific
- 5.5. Market Analysis, Insights and Forecast - by Region
- 5.5.1. China
- 5.5.2. India
- 5.5.3. Japan
- 5.5.4. South Korea
- 5.5.5. Malaysia
- 5.5.6. Thailand
- 5.5.7. Indonesia
- 5.5.8. Vietnam
- 5.5.9. Rest of Asia Pacific
- 5.1. Market Analysis, Insights and Forecast - by Type
- 6. Global APAC Industrial Valves Industry Analysis, Insights and Forecast, 2021-2033
- 6.1. Market Analysis, Insights and Forecast - by Type
- 6.1.1. Butterfly Valve
- 6.1.2. Ball Valve
- 6.1.3. Globe Valve
- 6.1.4. Gate Valve
- 6.1.5. Plug Valve
- 6.1.6. Other Types
- 6.2. Market Analysis, Insights and Forecast - by Product
- 6.2.1. Quarter-turn Valve
- 6.2.2. Multi-turn Valve
- 6.2.3. Other Products (Control Valves)
- 6.3. Market Analysis, Insights and Forecast - by Application
- 6.3.1. Power
- 6.3.2. Water an
- 6.3.2.1. Metal, Mineral, and Mining
- 6.3.2.2. Other Applications
- 6.3.3. By Chemicals
- 6.3.4. Oil and Gas
- 6.3.4.1. Upstream
- 6.3.4.2. Mid-stream
- 6.3.4.3. Downstream
- 6.3.5. Food Processing
- 6.3.6. Pulp and Paper
- 6.4. Market Analysis, Insights and Forecast - by Geography
- 6.4.1. China
- 6.4.2. India
- 6.4.3. Japan
- 6.4.4. South Korea
- 6.4.5. Malaysia
- 6.4.6. Thailand
- 6.4.7. Indonesia
- 6.4.8. Vietnam
- 6.4.9. Rest of Asia-Pacific
- 6.1. Market Analysis, Insights and Forecast - by Type
- 7. China APAC Industrial Valves Industry Analysis, Insights and Forecast, 2020-2032
- 7.1. Market Analysis, Insights and Forecast - by Type
- 7.1.1. Butterfly Valve
- 7.1.2. Ball Valve
- 7.1.3. Globe Valve
- 7.1.4. Gate Valve
- 7.1.5. Plug Valve
- 7.1.6. Other Types
- 7.2. Market Analysis, Insights and Forecast - by Product
- 7.2.1. Quarter-turn Valve
- 7.2.2. Multi-turn Valve
- 7.2.3. Other Products (Control Valves)
- 7.3. Market Analysis, Insights and Forecast - by Application
- 7.3.1. Power
- 7.3.2. Water an
- 7.3.2.1. Metal, Mineral, and Mining
- 7.3.2.2. Other Applications
- 7.3.3. By Chemicals
- 7.3.4. Oil and Gas
- 7.3.4.1. Upstream
- 7.3.4.2. Mid-stream
- 7.3.4.3. Downstream
- 7.3.5. Food Processing
- 7.3.6. Pulp and Paper
- 7.4. Market Analysis, Insights and Forecast - by Geography
- 7.4.1. China
- 7.4.2. India
- 7.4.3. Japan
- 7.4.4. South Korea
- 7.4.5. Malaysia
- 7.4.6. Thailand
- 7.4.7. Indonesia
- 7.4.8. Vietnam
- 7.4.9. Rest of Asia-Pacific
- 7.1. Market Analysis, Insights and Forecast - by Type
- 8. India APAC Industrial Valves Industry Analysis, Insights and Forecast, 2020-2032
- 8.1. Market Analysis, Insights and Forecast - by Type
- 8.1.1. Butterfly Valve
- 8.1.2. Ball Valve
- 8.1.3. Globe Valve
- 8.1.4. Gate Valve
- 8.1.5. Plug Valve
- 8.1.6. Other Types
- 8.2. Market Analysis, Insights and Forecast - by Product
- 8.2.1. Quarter-turn Valve
- 8.2.2. Multi-turn Valve
- 8.2.3. Other Products (Control Valves)
- 8.3. Market Analysis, Insights and Forecast - by Application
- 8.3.1. Power
- 8.3.2. Water an
- 8.3.2.1. Metal, Mineral, and Mining
- 8.3.2.2. Other Applications
- 8.3.3. By Chemicals
- 8.3.4. Oil and Gas
- 8.3.4.1. Upstream
- 8.3.4.2. Mid-stream
- 8.3.4.3. Downstream
- 8.3.5. Food Processing
- 8.3.6. Pulp and Paper
- 8.4. Market Analysis, Insights and Forecast - by Geography
- 8.4.1. China
- 8.4.2. India
- 8.4.3. Japan
- 8.4.4. South Korea
- 8.4.5. Malaysia
- 8.4.6. Thailand
- 8.4.7. Indonesia
- 8.4.8. Vietnam
- 8.4.9. Rest of Asia-Pacific
- 8.1. Market Analysis, Insights and Forecast - by Type
- 9. Japan APAC Industrial Valves Industry Analysis, Insights and Forecast, 2020-2032
- 9.1. Market Analysis, Insights and Forecast - by Type
- 9.1.1. Butterfly Valve
- 9.1.2. Ball Valve
- 9.1.3. Globe Valve
- 9.1.4. Gate Valve
- 9.1.5. Plug Valve
- 9.1.6. Other Types
- 9.2. Market Analysis, Insights and Forecast - by Product
- 9.2.1. Quarter-turn Valve
- 9.2.2. Multi-turn Valve
- 9.2.3. Other Products (Control Valves)
- 9.3. Market Analysis, Insights and Forecast - by Application
- 9.3.1. Power
- 9.3.2. Water an
- 9.3.2.1. Metal, Mineral, and Mining
- 9.3.2.2. Other Applications
- 9.3.3. By Chemicals
- 9.3.4. Oil and Gas
- 9.3.4.1. Upstream
- 9.3.4.2. Mid-stream
- 9.3.4.3. Downstream
- 9.3.5. Food Processing
- 9.3.6. Pulp and Paper
- 9.4. Market Analysis, Insights and Forecast - by Geography
- 9.4.1. China
- 9.4.2. India
- 9.4.3. Japan
- 9.4.4. South Korea
- 9.4.5. Malaysia
- 9.4.6. Thailand
- 9.4.7. Indonesia
- 9.4.8. Vietnam
- 9.4.9. Rest of Asia-Pacific
- 9.1. Market Analysis, Insights and Forecast - by Type
- 10. South Korea APAC Industrial Valves Industry Analysis, Insights and Forecast, 2020-2032
- 10.1. Market Analysis, Insights and Forecast - by Type
- 10.1.1. Butterfly Valve
- 10.1.2. Ball Valve
- 10.1.3. Globe Valve
- 10.1.4. Gate Valve
- 10.1.5. Plug Valve
- 10.1.6. Other Types
- 10.2. Market Analysis, Insights and Forecast - by Product
- 10.2.1. Quarter-turn Valve
- 10.2.2. Multi-turn Valve
- 10.2.3. Other Products (Control Valves)
- 10.3. Market Analysis, Insights and Forecast - by Application
- 10.3.1. Power
- 10.3.2. Water an
- 10.3.2.1. Metal, Mineral, and Mining
- 10.3.2.2. Other Applications
- 10.3.3. By Chemicals
- 10.3.4. Oil and Gas
- 10.3.4.1. Upstream
- 10.3.4.2. Mid-stream
- 10.3.4.3. Downstream
- 10.3.5. Food Processing
- 10.3.6. Pulp and Paper
- 10.4. Market Analysis, Insights and Forecast - by Geography
- 10.4.1. China
- 10.4.2. India
- 10.4.3. Japan
- 10.4.4. South Korea
- 10.4.5. Malaysia
- 10.4.6. Thailand
- 10.4.7. Indonesia
- 10.4.8. Vietnam
- 10.4.9. Rest of Asia-Pacific
- 10.1. Market Analysis, Insights and Forecast - by Type
- 11. Malaysia APAC Industrial Valves Industry Analysis, Insights and Forecast, 2020-2032
- 11.1. Market Analysis, Insights and Forecast - by Type
- 11.1.1. Butterfly Valve
- 11.1.2. Ball Valve
- 11.1.3. Globe Valve
- 11.1.4. Gate Valve
- 11.1.5. Plug Valve
- 11.1.6. Other Types
- 11.2. Market Analysis, Insights and Forecast - by Product
- 11.2.1. Quarter-turn Valve
- 11.2.2. Multi-turn Valve
- 11.2.3. Other Products (Control Valves)
- 11.3. Market Analysis, Insights and Forecast - by Application
- 11.3.1. Power
- 11.3.2. Water an
- 11.3.2.1. Metal, Mineral, and Mining
- 11.3.2.2. Other Applications
- 11.3.3. By Chemicals
- 11.3.4. Oil and Gas
- 11.3.4.1. Upstream
- 11.3.4.2. Mid-stream
- 11.3.4.3. Downstream
- 11.3.5. Food Processing
- 11.3.6. Pulp and Paper
- 11.4. Market Analysis, Insights and Forecast - by Geography
- 11.4.1. China
- 11.4.2. India
- 11.4.3. Japan
- 11.4.4. South Korea
- 11.4.5. Malaysia
- 11.4.6. Thailand
- 11.4.7. Indonesia
- 11.4.8. Vietnam
- 11.4.9. Rest of Asia-Pacific
- 11.1. Market Analysis, Insights and Forecast - by Type
- 12. Thailand APAC Industrial Valves Industry Analysis, Insights and Forecast, 2020-2032
- 12.1. Market Analysis, Insights and Forecast - by Type
- 12.1.1. Butterfly Valve
- 12.1.2. Ball Valve
- 12.1.3. Globe Valve
- 12.1.4. Gate Valve
- 12.1.5. Plug Valve
- 12.1.6. Other Types
- 12.2. Market Analysis, Insights and Forecast - by Product
- 12.2.1. Quarter-turn Valve
- 12.2.2. Multi-turn Valve
- 12.2.3. Other Products (Control Valves)
- 12.3. Market Analysis, Insights and Forecast - by Application
- 12.3.1. Power
- 12.3.2. Water an
- 12.3.2.1. Metal, Mineral, and Mining
- 12.3.2.2. Other Applications
- 12.3.3. By Chemicals
- 12.3.4. Oil and Gas
- 12.3.4.1. Upstream
- 12.3.4.2. Mid-stream
- 12.3.4.3. Downstream
- 12.3.5. Food Processing
- 12.3.6. Pulp and Paper
- 12.4. Market Analysis, Insights and Forecast - by Geography
- 12.4.1. China
- 12.4.2. India
- 12.4.3. Japan
- 12.4.4. South Korea
- 12.4.5. Malaysia
- 12.4.6. Thailand
- 12.4.7. Indonesia
- 12.4.8. Vietnam
- 12.4.9. Rest of Asia-Pacific
- 12.1. Market Analysis, Insights and Forecast - by Type
- 13. Indonesia APAC Industrial Valves Industry Analysis, Insights and Forecast, 2020-2032
- 13.1. Market Analysis, Insights and Forecast - by Type
- 13.1.1. Butterfly Valve
- 13.1.2. Ball Valve
- 13.1.3. Globe Valve
- 13.1.4. Gate Valve
- 13.1.5. Plug Valve
- 13.1.6. Other Types
- 13.2. Market Analysis, Insights and Forecast - by Product
- 13.2.1. Quarter-turn Valve
- 13.2.2. Multi-turn Valve
- 13.2.3. Other Products (Control Valves)
- 13.3. Market Analysis, Insights and Forecast - by Application
- 13.3.1. Power
- 13.3.2. Water an
- 13.3.2.1. Metal, Mineral, and Mining
- 13.3.2.2. Other Applications
- 13.3.3. By Chemicals
- 13.3.4. Oil and Gas
- 13.3.4.1. Upstream
- 13.3.4.2. Mid-stream
- 13.3.4.3. Downstream
- 13.3.5. Food Processing
- 13.3.6. Pulp and Paper
- 13.4. Market Analysis, Insights and Forecast - by Geography
- 13.4.1. China
- 13.4.2. India
- 13.4.3. Japan
- 13.4.4. South Korea
- 13.4.5. Malaysia
- 13.4.6. Thailand
- 13.4.7. Indonesia
- 13.4.8. Vietnam
- 13.4.9. Rest of Asia-Pacific
- 13.1. Market Analysis, Insights and Forecast - by Type
- 14. Vietnam APAC Industrial Valves Industry Analysis, Insights and Forecast, 2020-2032
- 14.1. Market Analysis, Insights and Forecast - by Type
- 14.1.1. Butterfly Valve
- 14.1.2. Ball Valve
- 14.1.3. Globe Valve
- 14.1.4. Gate Valve
- 14.1.5. Plug Valve
- 14.1.6. Other Types
- 14.2. Market Analysis, Insights and Forecast - by Product
- 14.2.1. Quarter-turn Valve
- 14.2.2. Multi-turn Valve
- 14.2.3. Other Products (Control Valves)
- 14.3. Market Analysis, Insights and Forecast - by Application
- 14.3.1. Power
- 14.3.2. Water an
- 14.3.2.1. Metal, Mineral, and Mining
- 14.3.2.2. Other Applications
- 14.3.3. By Chemicals
- 14.3.4. Oil and Gas
- 14.3.4.1. Upstream
- 14.3.4.2. Mid-stream
- 14.3.4.3. Downstream
- 14.3.5. Food Processing
- 14.3.6. Pulp and Paper
- 14.4. Market Analysis, Insights and Forecast - by Geography
- 14.4.1. China
- 14.4.2. India
- 14.4.3. Japan
- 14.4.4. South Korea
- 14.4.5. Malaysia
- 14.4.6. Thailand
- 14.4.7. Indonesia
- 14.4.8. Vietnam
- 14.4.9. Rest of Asia-Pacific
- 14.1. Market Analysis, Insights and Forecast - by Type
- 15. Rest of Asia Pacific APAC Industrial Valves Industry Analysis, Insights and Forecast, 2020-2032
- 15.1. Market Analysis, Insights and Forecast - by Type
- 15.1.1. Butterfly Valve
- 15.1.2. Ball Valve
- 15.1.3. Globe Valve
- 15.1.4. Gate Valve
- 15.1.5. Plug Valve
- 15.1.6. Other Types
- 15.2. Market Analysis, Insights and Forecast - by Product
- 15.2.1. Quarter-turn Valve
- 15.2.2. Multi-turn Valve
- 15.2.3. Other Products (Control Valves)
- 15.3. Market Analysis, Insights and Forecast - by Application
- 15.3.1. Power
- 15.3.2. Water an
- 15.3.2.1. Metal, Mineral, and Mining
- 15.3.2.2. Other Applications
- 15.3.3. By Chemicals
- 15.3.4. Oil and Gas
- 15.3.4.1. Upstream
- 15.3.4.2. Mid-stream
- 15.3.4.3. Downstream
- 15.3.5. Food Processing
- 15.3.6. Pulp and Paper
- 15.4. Market Analysis, Insights and Forecast - by Geography
- 15.4.1. China
- 15.4.2. India
- 15.4.3. Japan
- 15.4.4. South Korea
- 15.4.5. Malaysia
- 15.4.6. Thailand
- 15.4.7. Indonesia
- 15.4.8. Vietnam
- 15.4.9. Rest of Asia-Pacific
- 15.1. Market Analysis, Insights and Forecast - by Type
- 16. Competitive Analysis
- 16.1. Company Profiles
- 16.1.1 Alfa Laval
- 16.1.1.1. Company Overview
- 16.1.1.2. Products
- 16.1.1.3. Company Financials
- 16.1.1.4. SWOT Analysis
- 16.1.2 Honeywell International Inc
- 16.1.2.1. Company Overview
- 16.1.2.2. Products
- 16.1.2.3. Company Financials
- 16.1.2.4. SWOT Analysis
- 16.1.3 Danfoss AS
- 16.1.3.1. Company Overview
- 16.1.3.2. Products
- 16.1.3.3. Company Financials
- 16.1.3.4. SWOT Analysis
- 16.1.4 Velan Inc
- 16.1.4.1. Company Overview
- 16.1.4.2. Products
- 16.1.4.3. Company Financials
- 16.1.4.4. SWOT Analysis
- 16.1.5 Okano Valve Mfg Co Ltd
- 16.1.5.1. Company Overview
- 16.1.5.2. Products
- 16.1.5.3. Company Financials
- 16.1.5.4. SWOT Analysis
- 16.1.6 SAMSON AKTIENGESELLSCHAFT
- 16.1.6.1. Company Overview
- 16.1.6.2. Products
- 16.1.6.3. Company Financials
- 16.1.6.4. SWOT Analysis
- 16.1.7 Flowserve Corporation
- 16.1.7.1. Company Overview
- 16.1.7.2. Products
- 16.1.7.3. Company Financials
- 16.1.7.4. SWOT Analysis
- 16.1.8 The Weir Group PLC
- 16.1.8.1. Company Overview
- 16.1.8.2. Products
- 16.1.8.3. Company Financials
- 16.1.8.4. SWOT Analysis
- 16.1.9 Georg Fischer Ltd
- 16.1.9.1. Company Overview
- 16.1.9.2. Products
- 16.1.9.3. Company Financials
- 16.1.9.4. SWOT Analysis
- 16.1.10 Baker Hughes
- 16.1.10.1. Company Overview
- 16.1.10.2. Products
- 16.1.10.3. Company Financials
- 16.1.10.4. SWOT Analysis
- 16.1.11 Emerson Electric Co
- 16.1.11.1. Company Overview
- 16.1.11.2. Products
- 16.1.11.3. Company Financials
- 16.1.11.4. SWOT Analysis
- 16.1.12 CIRCOR International Inc
- 16.1.12.1. Company Overview
- 16.1.12.2. Products
- 16.1.12.3. Company Financials
- 16.1.12.4. SWOT Analysis
- 16.1.13 AVK Holding AS
- 16.1.13.1. Company Overview
- 16.1.13.2. Products
- 16.1.13.3. Company Financials
- 16.1.13.4. SWOT Analysis
- 16.1.14 PARKER HANNIFIN CORP
- 16.1.14.1. Company Overview
- 16.1.14.2. Products
- 16.1.14.3. Company Financials
- 16.1.14.4. SWOT Analysis
- 16.1.15 EBRO ARMATUREN Gebr Brer GmbH
- 16.1.15.1. Company Overview
- 16.1.15.2. Products
- 16.1.15.3. Company Financials
- 16.1.15.4. SWOT Analysis
- 16.1.16 Hitachi Metals Ltd
- 16.1.16.1. Company Overview
- 16.1.16.2. Products
- 16.1.16.3. Company Financials
- 16.1.16.4. SWOT Analysis
- 16.1.17 ITT Inc
- 16.1.17.1. Company Overview
- 16.1.17.2. Products
- 16.1.17.3. Company Financials
- 16.1.17.4. SWOT Analysis
- 16.1.18 NIBCO
- 16.1.18.1. Company Overview
- 16.1.18.2. Products
- 16.1.18.3. Company Financials
- 16.1.18.4. SWOT Analysis
- 16.1.19 IMI Critical Engineering
- 16.1.19.1. Company Overview
- 16.1.19.2. Products
- 16.1.19.3. Company Financials
- 16.1.19.4. SWOT Analysis
- 16.1.20 Crane Co
- 16.1.20.1. Company Overview
- 16.1.20.2. Products
- 16.1.20.3. Company Financials
- 16.1.20.4. SWOT Analysis
- 16.1.21 Valvitalia SpA
- 16.1.21.1. Company Overview
- 16.1.21.2. Products
- 16.1.21.3. Company Financials
- 16.1.21.4. SWOT Analysis
- 16.1.22 Curtiss-Wright Corporation
- 16.1.22.1. Company Overview
- 16.1.22.2. Products
- 16.1.22.3. Company Financials
- 16.1.22.4. SWOT Analysis
- 16.1.23 Schlumberger Limited
- 16.1.23.1. Company Overview
- 16.1.23.2. Products
- 16.1.23.3. Company Financials
- 16.1.23.4. SWOT Analysis
- 16.1.24 KITZ Corporation
- 16.1.24.1. Company Overview
- 16.1.24.2. Products
- 16.1.24.3. Company Financials
- 16.1.24.4. SWOT Analysis
- 16.1.1 Alfa Laval
- 16.2. Market Entropy
- 16.2.1 Company's Key Areas Served
- 16.2.2 Recent Developments
- 16.3. Company Market Share Analysis 2025
- 16.3.1 Top 5 Companies Market Share Analysis
- 16.3.2 Top 3 Companies Market Share Analysis
- 16.4. List of Potential Customers
- 17. Research Methodology
List of Figures
- Figure 1: Global APAC Industrial Valves Industry Revenue Breakdown (Million, %) by Region 2025 & 2033
- Figure 2: Global APAC Industrial Valves Industry Volume Breakdown (K Units, %) by Region 2025 & 2033
- Figure 3: China APAC Industrial Valves Industry Revenue (Million), by Type 2025 & 2033
- Figure 4: China APAC Industrial Valves Industry Volume (K Units), by Type 2025 & 2033
- Figure 5: China APAC Industrial Valves Industry Revenue Share (%), by Type 2025 & 2033
- Figure 6: China APAC Industrial Valves Industry Volume Share (%), by Type 2025 & 2033
- Figure 7: China APAC Industrial Valves Industry Revenue (Million), by Product 2025 & 2033
- Figure 8: China APAC Industrial Valves Industry Volume (K Units), by Product 2025 & 2033
- Figure 9: China APAC Industrial Valves Industry Revenue Share (%), by Product 2025 & 2033
- Figure 10: China APAC Industrial Valves Industry Volume Share (%), by Product 2025 & 2033
- Figure 11: China APAC Industrial Valves Industry Revenue (Million), by Application 2025 & 2033
- Figure 12: China APAC Industrial Valves Industry Volume (K Units), by Application 2025 & 2033
- Figure 13: China APAC Industrial Valves Industry Revenue Share (%), by Application 2025 & 2033
- Figure 14: China APAC Industrial Valves Industry Volume Share (%), by Application 2025 & 2033
- Figure 15: China APAC Industrial Valves Industry Revenue (Million), by Geography 2025 & 2033
- Figure 16: China APAC Industrial Valves Industry Volume (K Units), by Geography 2025 & 2033
- Figure 17: China APAC Industrial Valves Industry Revenue Share (%), by Geography 2025 & 2033
- Figure 18: China APAC Industrial Valves Industry Volume Share (%), by Geography 2025 & 2033
- Figure 19: China APAC Industrial Valves Industry Revenue (Million), by Country 2025 & 2033
- Figure 20: China APAC Industrial Valves Industry Volume (K Units), by Country 2025 & 2033
- Figure 21: China APAC Industrial Valves Industry Revenue Share (%), by Country 2025 & 2033
- Figure 22: China APAC Industrial Valves Industry Volume Share (%), by Country 2025 & 2033
- Figure 23: India APAC Industrial Valves Industry Revenue (Million), by Type 2025 & 2033
- Figure 24: India APAC Industrial Valves Industry Volume (K Units), by Type 2025 & 2033
- Figure 25: India APAC Industrial Valves Industry Revenue Share (%), by Type 2025 & 2033
- Figure 26: India APAC Industrial Valves Industry Volume Share (%), by Type 2025 & 2033
- Figure 27: India APAC Industrial Valves Industry Revenue (Million), by Product 2025 & 2033
- Figure 28: India APAC Industrial Valves Industry Volume (K Units), by Product 2025 & 2033
- Figure 29: India APAC Industrial Valves Industry Revenue Share (%), by Product 2025 & 2033
- Figure 30: India APAC Industrial Valves Industry Volume Share (%), by Product 2025 & 2033
- Figure 31: India APAC Industrial Valves Industry Revenue (Million), by Application 2025 & 2033
- Figure 32: India APAC Industrial Valves Industry Volume (K Units), by Application 2025 & 2033
- Figure 33: India APAC Industrial Valves Industry Revenue Share (%), by Application 2025 & 2033
- Figure 34: India APAC Industrial Valves Industry Volume Share (%), by Application 2025 & 2033
- Figure 35: India APAC Industrial Valves Industry Revenue (Million), by Geography 2025 & 2033
- Figure 36: India APAC Industrial Valves Industry Volume (K Units), by Geography 2025 & 2033
- Figure 37: India APAC Industrial Valves Industry Revenue Share (%), by Geography 2025 & 2033
- Figure 38: India APAC Industrial Valves Industry Volume Share (%), by Geography 2025 & 2033
- Figure 39: India APAC Industrial Valves Industry Revenue (Million), by Country 2025 & 2033
- Figure 40: India APAC Industrial Valves Industry Volume (K Units), by Country 2025 & 2033
- Figure 41: India APAC Industrial Valves Industry Revenue Share (%), by Country 2025 & 2033
- Figure 42: India APAC Industrial Valves Industry Volume Share (%), by Country 2025 & 2033
- Figure 43: Japan APAC Industrial Valves Industry Revenue (Million), by Type 2025 & 2033
- Figure 44: Japan APAC Industrial Valves Industry Volume (K Units), by Type 2025 & 2033
- Figure 45: Japan APAC Industrial Valves Industry Revenue Share (%), by Type 2025 & 2033
- Figure 46: Japan APAC Industrial Valves Industry Volume Share (%), by Type 2025 & 2033
- Figure 47: Japan APAC Industrial Valves Industry Revenue (Million), by Product 2025 & 2033
- Figure 48: Japan APAC Industrial Valves Industry Volume (K Units), by Product 2025 & 2033
- Figure 49: Japan APAC Industrial Valves Industry Revenue Share (%), by Product 2025 & 2033
- Figure 50: Japan APAC Industrial Valves Industry Volume Share (%), by Product 2025 & 2033
- Figure 51: Japan APAC Industrial Valves Industry Revenue (Million), by Application 2025 & 2033
- Figure 52: Japan APAC Industrial Valves Industry Volume (K Units), by Application 2025 & 2033
- Figure 53: Japan APAC Industrial Valves Industry Revenue Share (%), by Application 2025 & 2033
- Figure 54: Japan APAC Industrial Valves Industry Volume Share (%), by Application 2025 & 2033
- Figure 55: Japan APAC Industrial Valves Industry Revenue (Million), by Geography 2025 & 2033
- Figure 56: Japan APAC Industrial Valves Industry Volume (K Units), by Geography 2025 & 2033
- Figure 57: Japan APAC Industrial Valves Industry Revenue Share (%), by Geography 2025 & 2033
- Figure 58: Japan APAC Industrial Valves Industry Volume Share (%), by Geography 2025 & 2033
- Figure 59: Japan APAC Industrial Valves Industry Revenue (Million), by Country 2025 & 2033
- Figure 60: Japan APAC Industrial Valves Industry Volume (K Units), by Country 2025 & 2033
- Figure 61: Japan APAC Industrial Valves Industry Revenue Share (%), by Country 2025 & 2033
- Figure 62: Japan APAC Industrial Valves Industry Volume Share (%), by Country 2025 & 2033
- Figure 63: South Korea APAC Industrial Valves Industry Revenue (Million), by Type 2025 & 2033
- Figure 64: South Korea APAC Industrial Valves Industry Volume (K Units), by Type 2025 & 2033
- Figure 65: South Korea APAC Industrial Valves Industry Revenue Share (%), by Type 2025 & 2033
- Figure 66: South Korea APAC Industrial Valves Industry Volume Share (%), by Type 2025 & 2033
- Figure 67: South Korea APAC Industrial Valves Industry Revenue (Million), by Product 2025 & 2033
- Figure 68: South Korea APAC Industrial Valves Industry Volume (K Units), by Product 2025 & 2033
- Figure 69: South Korea APAC Industrial Valves Industry Revenue Share (%), by Product 2025 & 2033
- Figure 70: South Korea APAC Industrial Valves Industry Volume Share (%), by Product 2025 & 2033
- Figure 71: South Korea APAC Industrial Valves Industry Revenue (Million), by Application 2025 & 2033
- Figure 72: South Korea APAC Industrial Valves Industry Volume (K Units), by Application 2025 & 2033
- Figure 73: South Korea APAC Industrial Valves Industry Revenue Share (%), by Application 2025 & 2033
- Figure 74: South Korea APAC Industrial Valves Industry Volume Share (%), by Application 2025 & 2033
- Figure 75: South Korea APAC Industrial Valves Industry Revenue (Million), by Geography 2025 & 2033
- Figure 76: South Korea APAC Industrial Valves Industry Volume (K Units), by Geography 2025 & 2033
- Figure 77: South Korea APAC Industrial Valves Industry Revenue Share (%), by Geography 2025 & 2033
- Figure 78: South Korea APAC Industrial Valves Industry Volume Share (%), by Geography 2025 & 2033
- Figure 79: South Korea APAC Industrial Valves Industry Revenue (Million), by Country 2025 & 2033
- Figure 80: South Korea APAC Industrial Valves Industry Volume (K Units), by Country 2025 & 2033
- Figure 81: South Korea APAC Industrial Valves Industry Revenue Share (%), by Country 2025 & 2033
- Figure 82: South Korea APAC Industrial Valves Industry Volume Share (%), by Country 2025 & 2033
- Figure 83: Malaysia APAC Industrial Valves Industry Revenue (Million), by Type 2025 & 2033
- Figure 84: Malaysia APAC Industrial Valves Industry Volume (K Units), by Type 2025 & 2033
- Figure 85: Malaysia APAC Industrial Valves Industry Revenue Share (%), by Type 2025 & 2033
- Figure 86: Malaysia APAC Industrial Valves Industry Volume Share (%), by Type 2025 & 2033
- Figure 87: Malaysia APAC Industrial Valves Industry Revenue (Million), by Product 2025 & 2033
- Figure 88: Malaysia APAC Industrial Valves Industry Volume (K Units), by Product 2025 & 2033
- Figure 89: Malaysia APAC Industrial Valves Industry Revenue Share (%), by Product 2025 & 2033
- Figure 90: Malaysia APAC Industrial Valves Industry Volume Share (%), by Product 2025 & 2033
- Figure 91: Malaysia APAC Industrial Valves Industry Revenue (Million), by Application 2025 & 2033
- Figure 92: Malaysia APAC Industrial Valves Industry Volume (K Units), by Application 2025 & 2033
- Figure 93: Malaysia APAC Industrial Valves Industry Revenue Share (%), by Application 2025 & 2033
- Figure 94: Malaysia APAC Industrial Valves Industry Volume Share (%), by Application 2025 & 2033
- Figure 95: Malaysia APAC Industrial Valves Industry Revenue (Million), by Geography 2025 & 2033
- Figure 96: Malaysia APAC Industrial Valves Industry Volume (K Units), by Geography 2025 & 2033
- Figure 97: Malaysia APAC Industrial Valves Industry Revenue Share (%), by Geography 2025 & 2033
- Figure 98: Malaysia APAC Industrial Valves Industry Volume Share (%), by Geography 2025 & 2033
- Figure 99: Malaysia APAC Industrial Valves Industry Revenue (Million), by Country 2025 & 2033
- Figure 100: Malaysia APAC Industrial Valves Industry Volume (K Units), by Country 2025 & 2033
- Figure 101: Malaysia APAC Industrial Valves Industry Revenue Share (%), by Country 2025 & 2033
- Figure 102: Malaysia APAC Industrial Valves Industry Volume Share (%), by Country 2025 & 2033
- Figure 103: Thailand APAC Industrial Valves Industry Revenue (Million), by Type 2025 & 2033
- Figure 104: Thailand APAC Industrial Valves Industry Volume (K Units), by Type 2025 & 2033
- Figure 105: Thailand APAC Industrial Valves Industry Revenue Share (%), by Type 2025 & 2033
- Figure 106: Thailand APAC Industrial Valves Industry Volume Share (%), by Type 2025 & 2033
- Figure 107: Thailand APAC Industrial Valves Industry Revenue (Million), by Product 2025 & 2033
- Figure 108: Thailand APAC Industrial Valves Industry Volume (K Units), by Product 2025 & 2033
- Figure 109: Thailand APAC Industrial Valves Industry Revenue Share (%), by Product 2025 & 2033
- Figure 110: Thailand APAC Industrial Valves Industry Volume Share (%), by Product 2025 & 2033
- Figure 111: Thailand APAC Industrial Valves Industry Revenue (Million), by Application 2025 & 2033
- Figure 112: Thailand APAC Industrial Valves Industry Volume (K Units), by Application 2025 & 2033
- Figure 113: Thailand APAC Industrial Valves Industry Revenue Share (%), by Application 2025 & 2033
- Figure 114: Thailand APAC Industrial Valves Industry Volume Share (%), by Application 2025 & 2033
- Figure 115: Thailand APAC Industrial Valves Industry Revenue (Million), by Geography 2025 & 2033
- Figure 116: Thailand APAC Industrial Valves Industry Volume (K Units), by Geography 2025 & 2033
- Figure 117: Thailand APAC Industrial Valves Industry Revenue Share (%), by Geography 2025 & 2033
- Figure 118: Thailand APAC Industrial Valves Industry Volume Share (%), by Geography 2025 & 2033
- Figure 119: Thailand APAC Industrial Valves Industry Revenue (Million), by Country 2025 & 2033
- Figure 120: Thailand APAC Industrial Valves Industry Volume (K Units), by Country 2025 & 2033
- Figure 121: Thailand APAC Industrial Valves Industry Revenue Share (%), by Country 2025 & 2033
- Figure 122: Thailand APAC Industrial Valves Industry Volume Share (%), by Country 2025 & 2033
- Figure 123: Indonesia APAC Industrial Valves Industry Revenue (Million), by Type 2025 & 2033
- Figure 124: Indonesia APAC Industrial Valves Industry Volume (K Units), by Type 2025 & 2033
- Figure 125: Indonesia APAC Industrial Valves Industry Revenue Share (%), by Type 2025 & 2033
- Figure 126: Indonesia APAC Industrial Valves Industry Volume Share (%), by Type 2025 & 2033
- Figure 127: Indonesia APAC Industrial Valves Industry Revenue (Million), by Product 2025 & 2033
- Figure 128: Indonesia APAC Industrial Valves Industry Volume (K Units), by Product 2025 & 2033
- Figure 129: Indonesia APAC Industrial Valves Industry Revenue Share (%), by Product 2025 & 2033
- Figure 130: Indonesia APAC Industrial Valves Industry Volume Share (%), by Product 2025 & 2033
- Figure 131: Indonesia APAC Industrial Valves Industry Revenue (Million), by Application 2025 & 2033
- Figure 132: Indonesia APAC Industrial Valves Industry Volume (K Units), by Application 2025 & 2033
- Figure 133: Indonesia APAC Industrial Valves Industry Revenue Share (%), by Application 2025 & 2033
- Figure 134: Indonesia APAC Industrial Valves Industry Volume Share (%), by Application 2025 & 2033
- Figure 135: Indonesia APAC Industrial Valves Industry Revenue (Million), by Geography 2025 & 2033
- Figure 136: Indonesia APAC Industrial Valves Industry Volume (K Units), by Geography 2025 & 2033
- Figure 137: Indonesia APAC Industrial Valves Industry Revenue Share (%), by Geography 2025 & 2033
- Figure 138: Indonesia APAC Industrial Valves Industry Volume Share (%), by Geography 2025 & 2033
- Figure 139: Indonesia APAC Industrial Valves Industry Revenue (Million), by Country 2025 & 2033
- Figure 140: Indonesia APAC Industrial Valves Industry Volume (K Units), by Country 2025 & 2033
- Figure 141: Indonesia APAC Industrial Valves Industry Revenue Share (%), by Country 2025 & 2033
- Figure 142: Indonesia APAC Industrial Valves Industry Volume Share (%), by Country 2025 & 2033
- Figure 143: Vietnam APAC Industrial Valves Industry Revenue (Million), by Type 2025 & 2033
- Figure 144: Vietnam APAC Industrial Valves Industry Volume (K Units), by Type 2025 & 2033
- Figure 145: Vietnam APAC Industrial Valves Industry Revenue Share (%), by Type 2025 & 2033
- Figure 146: Vietnam APAC Industrial Valves Industry Volume Share (%), by Type 2025 & 2033
- Figure 147: Vietnam APAC Industrial Valves Industry Revenue (Million), by Product 2025 & 2033
- Figure 148: Vietnam APAC Industrial Valves Industry Volume (K Units), by Product 2025 & 2033
- Figure 149: Vietnam APAC Industrial Valves Industry Revenue Share (%), by Product 2025 & 2033
- Figure 150: Vietnam APAC Industrial Valves Industry Volume Share (%), by Product 2025 & 2033
- Figure 151: Vietnam APAC Industrial Valves Industry Revenue (Million), by Application 2025 & 2033
- Figure 152: Vietnam APAC Industrial Valves Industry Volume (K Units), by Application 2025 & 2033
- Figure 153: Vietnam APAC Industrial Valves Industry Revenue Share (%), by Application 2025 & 2033
- Figure 154: Vietnam APAC Industrial Valves Industry Volume Share (%), by Application 2025 & 2033
- Figure 155: Vietnam APAC Industrial Valves Industry Revenue (Million), by Geography 2025 & 2033
- Figure 156: Vietnam APAC Industrial Valves Industry Volume (K Units), by Geography 2025 & 2033
- Figure 157: Vietnam APAC Industrial Valves Industry Revenue Share (%), by Geography 2025 & 2033
- Figure 158: Vietnam APAC Industrial Valves Industry Volume Share (%), by Geography 2025 & 2033
- Figure 159: Vietnam APAC Industrial Valves Industry Revenue (Million), by Country 2025 & 2033
- Figure 160: Vietnam APAC Industrial Valves Industry Volume (K Units), by Country 2025 & 2033
- Figure 161: Vietnam APAC Industrial Valves Industry Revenue Share (%), by Country 2025 & 2033
- Figure 162: Vietnam APAC Industrial Valves Industry Volume Share (%), by Country 2025 & 2033
- Figure 163: Rest of Asia Pacific APAC Industrial Valves Industry Revenue (Million), by Type 2025 & 2033
- Figure 164: Rest of Asia Pacific APAC Industrial Valves Industry Volume (K Units), by Type 2025 & 2033
- Figure 165: Rest of Asia Pacific APAC Industrial Valves Industry Revenue Share (%), by Type 2025 & 2033
- Figure 166: Rest of Asia Pacific APAC Industrial Valves Industry Volume Share (%), by Type 2025 & 2033
- Figure 167: Rest of Asia Pacific APAC Industrial Valves Industry Revenue (Million), by Product 2025 & 2033
- Figure 168: Rest of Asia Pacific APAC Industrial Valves Industry Volume (K Units), by Product 2025 & 2033
- Figure 169: Rest of Asia Pacific APAC Industrial Valves Industry Revenue Share (%), by Product 2025 & 2033
- Figure 170: Rest of Asia Pacific APAC Industrial Valves Industry Volume Share (%), by Product 2025 & 2033
- Figure 171: Rest of Asia Pacific APAC Industrial Valves Industry Revenue (Million), by Application 2025 & 2033
- Figure 172: Rest of Asia Pacific APAC Industrial Valves Industry Volume (K Units), by Application 2025 & 2033
- Figure 173: Rest of Asia Pacific APAC Industrial Valves Industry Revenue Share (%), by Application 2025 & 2033
- Figure 174: Rest of Asia Pacific APAC Industrial Valves Industry Volume Share (%), by Application 2025 & 2033
- Figure 175: Rest of Asia Pacific APAC Industrial Valves Industry Revenue (Million), by Geography 2025 & 2033
- Figure 176: Rest of Asia Pacific APAC Industrial Valves Industry Volume (K Units), by Geography 2025 & 2033
- Figure 177: Rest of Asia Pacific APAC Industrial Valves Industry Revenue Share (%), by Geography 2025 & 2033
- Figure 178: Rest of Asia Pacific APAC Industrial Valves Industry Volume Share (%), by Geography 2025 & 2033
- Figure 179: Rest of Asia Pacific APAC Industrial Valves Industry Revenue (Million), by Country 2025 & 2033
- Figure 180: Rest of Asia Pacific APAC Industrial Valves Industry Volume (K Units), by Country 2025 & 2033
- Figure 181: Rest of Asia Pacific APAC Industrial Valves Industry Revenue Share (%), by Country 2025 & 2033
- Figure 182: Rest of Asia Pacific APAC Industrial Valves Industry Volume Share (%), by Country 2025 & 2033
List of Tables
- Table 1: Global APAC Industrial Valves Industry Revenue Million Forecast, by Type 2020 & 2033
- Table 2: Global APAC Industrial Valves Industry Volume K Units Forecast, by Type 2020 & 2033
- Table 3: Global APAC Industrial Valves Industry Revenue Million Forecast, by Product 2020 & 2033
- Table 4: Global APAC Industrial Valves Industry Volume K Units Forecast, by Product 2020 & 2033
- Table 5: Global APAC Industrial Valves Industry Revenue Million Forecast, by Application 2020 & 2033
- Table 6: Global APAC Industrial Valves Industry Volume K Units Forecast, by Application 2020 & 2033
- Table 7: Global APAC Industrial Valves Industry Revenue Million Forecast, by Geography 2020 & 2033
- Table 8: Global APAC Industrial Valves Industry Volume K Units Forecast, by Geography 2020 & 2033
- Table 9: Global APAC Industrial Valves Industry Revenue Million Forecast, by Region 2020 & 2033
- Table 10: Global APAC Industrial Valves Industry Volume K Units Forecast, by Region 2020 & 2033
- Table 11: Global APAC Industrial Valves Industry Revenue Million Forecast, by Type 2020 & 2033
- Table 12: Global APAC Industrial Valves Industry Volume K Units Forecast, by Type 2020 & 2033
- Table 13: Global APAC Industrial Valves Industry Revenue Million Forecast, by Product 2020 & 2033
- Table 14: Global APAC Industrial Valves Industry Volume K Units Forecast, by Product 2020 & 2033
- Table 15: Global APAC Industrial Valves Industry Revenue Million Forecast, by Application 2020 & 2033
- Table 16: Global APAC Industrial Valves Industry Volume K Units Forecast, by Application 2020 & 2033
- Table 17: Global APAC Industrial Valves Industry Revenue Million Forecast, by Geography 2020 & 2033
- Table 18: Global APAC Industrial Valves Industry Volume K Units Forecast, by Geography 2020 & 2033
- Table 19: Global APAC Industrial Valves Industry Revenue Million Forecast, by Country 2020 & 2033
- Table 20: Global APAC Industrial Valves Industry Volume K Units Forecast, by Country 2020 & 2033
- Table 21: Global APAC Industrial Valves Industry Revenue Million Forecast, by Type 2020 & 2033
- Table 22: Global APAC Industrial Valves Industry Volume K Units Forecast, by Type 2020 & 2033
- Table 23: Global APAC Industrial Valves Industry Revenue Million Forecast, by Product 2020 & 2033
- Table 24: Global APAC Industrial Valves Industry Volume K Units Forecast, by Product 2020 & 2033
- Table 25: Global APAC Industrial Valves Industry Revenue Million Forecast, by Application 2020 & 2033
- Table 26: Global APAC Industrial Valves Industry Volume K Units Forecast, by Application 2020 & 2033
- Table 27: Global APAC Industrial Valves Industry Revenue Million Forecast, by Geography 2020 & 2033
- Table 28: Global APAC Industrial Valves Industry Volume K Units Forecast, by Geography 2020 & 2033
- Table 29: Global APAC Industrial Valves Industry Revenue Million Forecast, by Country 2020 & 2033
- Table 30: Global APAC Industrial Valves Industry Volume K Units Forecast, by Country 2020 & 2033
- Table 31: Global APAC Industrial Valves Industry Revenue Million Forecast, by Type 2020 & 2033
- Table 32: Global APAC Industrial Valves Industry Volume K Units Forecast, by Type 2020 & 2033
- Table 33: Global APAC Industrial Valves Industry Revenue Million Forecast, by Product 2020 & 2033
- Table 34: Global APAC Industrial Valves Industry Volume K Units Forecast, by Product 2020 & 2033
- Table 35: Global APAC Industrial Valves Industry Revenue Million Forecast, by Application 2020 & 2033
- Table 36: Global APAC Industrial Valves Industry Volume K Units Forecast, by Application 2020 & 2033
- Table 37: Global APAC Industrial Valves Industry Revenue Million Forecast, by Geography 2020 & 2033
- Table 38: Global APAC Industrial Valves Industry Volume K Units Forecast, by Geography 2020 & 2033
- Table 39: Global APAC Industrial Valves Industry Revenue Million Forecast, by Country 2020 & 2033
- Table 40: Global APAC Industrial Valves Industry Volume K Units Forecast, by Country 2020 & 2033
- Table 41: Global APAC Industrial Valves Industry Revenue Million Forecast, by Type 2020 & 2033
- Table 42: Global APAC Industrial Valves Industry Volume K Units Forecast, by Type 2020 & 2033
- Table 43: Global APAC Industrial Valves Industry Revenue Million Forecast, by Product 2020 & 2033
- Table 44: Global APAC Industrial Valves Industry Volume K Units Forecast, by Product 2020 & 2033
- Table 45: Global APAC Industrial Valves Industry Revenue Million Forecast, by Application 2020 & 2033
- Table 46: Global APAC Industrial Valves Industry Volume K Units Forecast, by Application 2020 & 2033
- Table 47: Global APAC Industrial Valves Industry Revenue Million Forecast, by Geography 2020 & 2033
- Table 48: Global APAC Industrial Valves Industry Volume K Units Forecast, by Geography 2020 & 2033
- Table 49: Global APAC Industrial Valves Industry Revenue Million Forecast, by Country 2020 & 2033
- Table 50: Global APAC Industrial Valves Industry Volume K Units Forecast, by Country 2020 & 2033
- Table 51: Global APAC Industrial Valves Industry Revenue Million Forecast, by Type 2020 & 2033
- Table 52: Global APAC Industrial Valves Industry Volume K Units Forecast, by Type 2020 & 2033
- Table 53: Global APAC Industrial Valves Industry Revenue Million Forecast, by Product 2020 & 2033
- Table 54: Global APAC Industrial Valves Industry Volume K Units Forecast, by Product 2020 & 2033
- Table 55: Global APAC Industrial Valves Industry Revenue Million Forecast, by Application 2020 & 2033
- Table 56: Global APAC Industrial Valves Industry Volume K Units Forecast, by Application 2020 & 2033
- Table 57: Global APAC Industrial Valves Industry Revenue Million Forecast, by Geography 2020 & 2033
- Table 58: Global APAC Industrial Valves Industry Volume K Units Forecast, by Geography 2020 & 2033
- Table 59: Global APAC Industrial Valves Industry Revenue Million Forecast, by Country 2020 & 2033
- Table 60: Global APAC Industrial Valves Industry Volume K Units Forecast, by Country 2020 & 2033
- Table 61: Global APAC Industrial Valves Industry Revenue Million Forecast, by Type 2020 & 2033
- Table 62: Global APAC Industrial Valves Industry Volume K Units Forecast, by Type 2020 & 2033
- Table 63: Global APAC Industrial Valves Industry Revenue Million Forecast, by Product 2020 & 2033
- Table 64: Global APAC Industrial Valves Industry Volume K Units Forecast, by Product 2020 & 2033
- Table 65: Global APAC Industrial Valves Industry Revenue Million Forecast, by Application 2020 & 2033
- Table 66: Global APAC Industrial Valves Industry Volume K Units Forecast, by Application 2020 & 2033
- Table 67: Global APAC Industrial Valves Industry Revenue Million Forecast, by Geography 2020 & 2033
- Table 68: Global APAC Industrial Valves Industry Volume K Units Forecast, by Geography 2020 & 2033
- Table 69: Global APAC Industrial Valves Industry Revenue Million Forecast, by Country 2020 & 2033
- Table 70: Global APAC Industrial Valves Industry Volume K Units Forecast, by Country 2020 & 2033
- Table 71: Global APAC Industrial Valves Industry Revenue Million Forecast, by Type 2020 & 2033
- Table 72: Global APAC Industrial Valves Industry Volume K Units Forecast, by Type 2020 & 2033
- Table 73: Global APAC Industrial Valves Industry Revenue Million Forecast, by Product 2020 & 2033
- Table 74: Global APAC Industrial Valves Industry Volume K Units Forecast, by Product 2020 & 2033
- Table 75: Global APAC Industrial Valves Industry Revenue Million Forecast, by Application 2020 & 2033
- Table 76: Global APAC Industrial Valves Industry Volume K Units Forecast, by Application 2020 & 2033
- Table 77: Global APAC Industrial Valves Industry Revenue Million Forecast, by Geography 2020 & 2033
- Table 78: Global APAC Industrial Valves Industry Volume K Units Forecast, by Geography 2020 & 2033
- Table 79: Global APAC Industrial Valves Industry Revenue Million Forecast, by Country 2020 & 2033
- Table 80: Global APAC Industrial Valves Industry Volume K Units Forecast, by Country 2020 & 2033
- Table 81: Global APAC Industrial Valves Industry Revenue Million Forecast, by Type 2020 & 2033
- Table 82: Global APAC Industrial Valves Industry Volume K Units Forecast, by Type 2020 & 2033
- Table 83: Global APAC Industrial Valves Industry Revenue Million Forecast, by Product 2020 & 2033
- Table 84: Global APAC Industrial Valves Industry Volume K Units Forecast, by Product 2020 & 2033
- Table 85: Global APAC Industrial Valves Industry Revenue Million Forecast, by Application 2020 & 2033
- Table 86: Global APAC Industrial Valves Industry Volume K Units Forecast, by Application 2020 & 2033
- Table 87: Global APAC Industrial Valves Industry Revenue Million Forecast, by Geography 2020 & 2033
- Table 88: Global APAC Industrial Valves Industry Volume K Units Forecast, by Geography 2020 & 2033
- Table 89: Global APAC Industrial Valves Industry Revenue Million Forecast, by Country 2020 & 2033
- Table 90: Global APAC Industrial Valves Industry Volume K Units Forecast, by Country 2020 & 2033
- Table 91: Global APAC Industrial Valves Industry Revenue Million Forecast, by Type 2020 & 2033
- Table 92: Global APAC Industrial Valves Industry Volume K Units Forecast, by Type 2020 & 2033
- Table 93: Global APAC Industrial Valves Industry Revenue Million Forecast, by Product 2020 & 2033
- Table 94: Global APAC Industrial Valves Industry Volume K Units Forecast, by Product 2020 & 2033
- Table 95: Global APAC Industrial Valves Industry Revenue Million Forecast, by Application 2020 & 2033
- Table 96: Global APAC Industrial Valves Industry Volume K Units Forecast, by Application 2020 & 2033
- Table 97: Global APAC Industrial Valves Industry Revenue Million Forecast, by Geography 2020 & 2033
- Table 98: Global APAC Industrial Valves Industry Volume K Units Forecast, by Geography 2020 & 2033
- Table 99: Global APAC Industrial Valves Industry Revenue Million Forecast, by Country 2020 & 2033
- Table 100: Global APAC Industrial Valves Industry Volume K Units Forecast, by Country 2020 & 2033
Frequently Asked Questions
1. What is the projected Compound Annual Growth Rate (CAGR) of the APAC Industrial Valves Industry?
The projected CAGR is approximately 5.67%.
2. Which companies are prominent players in the APAC Industrial Valves Industry?
Key companies in the market include Alfa Laval, Honeywell International Inc, Danfoss AS, Velan Inc , Okano Valve Mfg Co Ltd, SAMSON AKTIENGESELLSCHAFT, Flowserve Corporation, The Weir Group PLC, Georg Fischer Ltd, Baker Hughes, Emerson Electric Co, CIRCOR International Inc, AVK Holding AS, PARKER HANNIFIN CORP, EBRO ARMATUREN Gebr Brer GmbH, Hitachi Metals Ltd, ITT Inc, NIBCO, IMI Critical Engineering, Crane Co, Valvitalia SpA, Curtiss-Wright Corporation, Schlumberger Limited, KITZ Corporation.
3. What are the main segments of the APAC Industrial Valves Industry?
The market segments include Type, Product, Application, Geography.
4. Can you provide details about the market size?
The market size is estimated to be USD 21.98 Million as of 2022.
5. What are some drivers contributing to market growth?
Increasing Demand for Valves from Water Treatment Plants; Increasing Demand for Valves in the Oil and Gas Industry; Other Drivers.
6. What are the notable trends driving market growth?
Growing Demand in the Oil and Gas Industry.
7. Are there any restraints impacting market growth?
Impact of the COVID-19 Outbreak.
8. Can you provide examples of recent developments in the market?
March 2022: Flowserve announced a partnership with Gradiant to accelerate growth in the water technology market. Gradiant develops and delivers advanced water and wastewater treatment facilities with a primary focus in the Asia Pacific.
9. What pricing options are available for accessing the report?
Pricing options include single-user, multi-user, and enterprise licenses priced at USD 4750, USD 5250, and USD 8750 respectively.
10. Is the market size provided in terms of value or volume?
The market size is provided in terms of value, measured in Million and volume, measured in K Units.
11. Are there any specific market keywords associated with the report?
Yes, the market keyword associated with the report is "APAC Industrial Valves Industry," which aids in identifying and referencing the specific market segment covered.
12. How do I determine which pricing option suits my needs best?
The pricing options vary based on user requirements and access needs. Individual users may opt for single-user licenses, while businesses requiring broader access may choose multi-user or enterprise licenses for cost-effective access to the report.
13. Are there any additional resources or data provided in the APAC Industrial Valves Industry report?
While the report offers comprehensive insights, it's advisable to review the specific contents or supplementary materials provided to ascertain if additional resources or data are available.
14. How can I stay updated on further developments or reports in the APAC Industrial Valves Industry?
To stay informed about further developments, trends, and reports in the APAC Industrial Valves Industry, consider subscribing to industry newsletters, following relevant companies and organizations, or regularly checking reputable industry news sources and publications.
Methodology
Step 1 - Identification of Relevant Samples Size from Population Database


Step 2 - Approaches for Defining Global Market Size (Value, Volume* & Price*)

Note*: In applicable scenarios
Step 3 - Data Sources
Primary Research
- Web Analytics
- Survey Reports
- Research Institute
- Latest Research Reports
- Opinion Leaders
Secondary Research
- Annual Reports
- White Paper
- Latest Press Release
- Industry Association
- Paid Database
- Investor Presentations

Step 4 - Data Triangulation
Involves using different sources of information in order to increase the validity of a study
These sources are likely to be stakeholders in a program - participants, other researchers, program staff, other community members, and so on.
Then we put all data in single framework & apply various statistical tools to find out the dynamic on the market.
During the analysis stage, feedback from the stakeholder groups would be compared to determine areas of agreement as well as areas of divergence