Key Insights
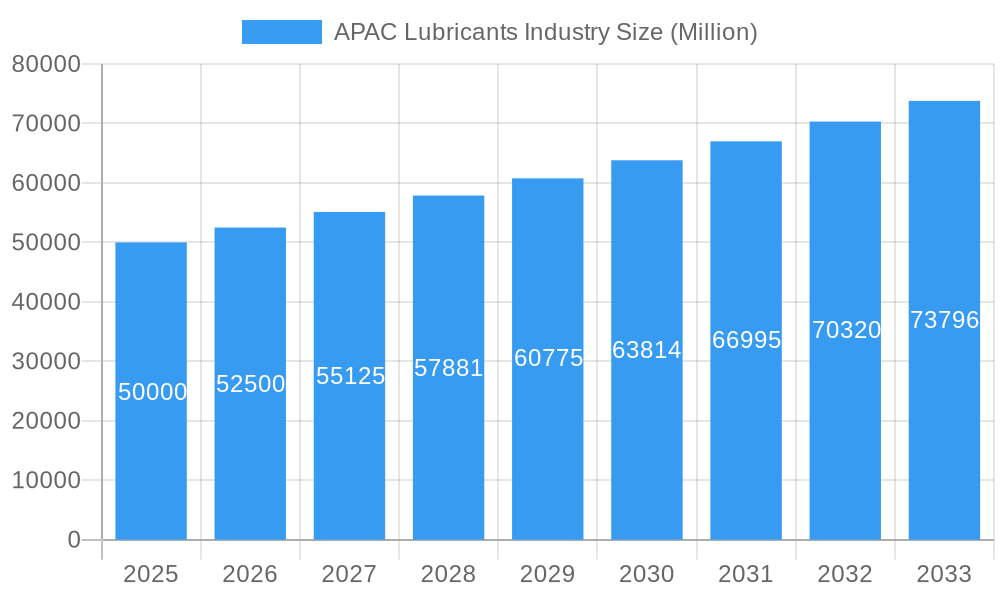
The Asia-Pacific (APAC) lubricants market is poised for significant expansion, fueled by rapid industrialization, robust automotive sector growth, and ongoing infrastructure development. Key drivers include rising disposable incomes, accelerated urbanization, and increasing vehicle ownership, particularly in emerging economies like China and India. The demand for advanced lubricant formulations is also elevated by the adoption of high-efficiency engines and stringent emission regulations. Despite potential challenges from volatile crude oil prices and supply chain sensitivities, the APAC lubricants market exhibits a positive long-term trajectory. The market size is projected to reach $149,790 million in 2025, with an estimated compound annual growth rate (CAGR) of 4% from 2025 to 2033.
APAC Lubricants Industry Market Size (In Billion)
Market segmentation highlights strong demand across automotive (passenger cars, commercial vehicles, two-wheelers), industrial (manufacturing, energy, mining), and marine applications. Leading companies such as BP Plc (Castrol), ExxonMobil Corporation, and Shell are actively innovating with new lubricant technologies to meet growing needs for enhanced performance and environmental sustainability. The competitive environment is intense, with global and regional players actively pursuing market share through strategic alliances, mergers, acquisitions, and capacity expansions. China and India are leading the regional market, followed by dynamic Southeast Asian economies. Opportunities for growth are also present in emerging markets with accelerating industrial and infrastructure projects.
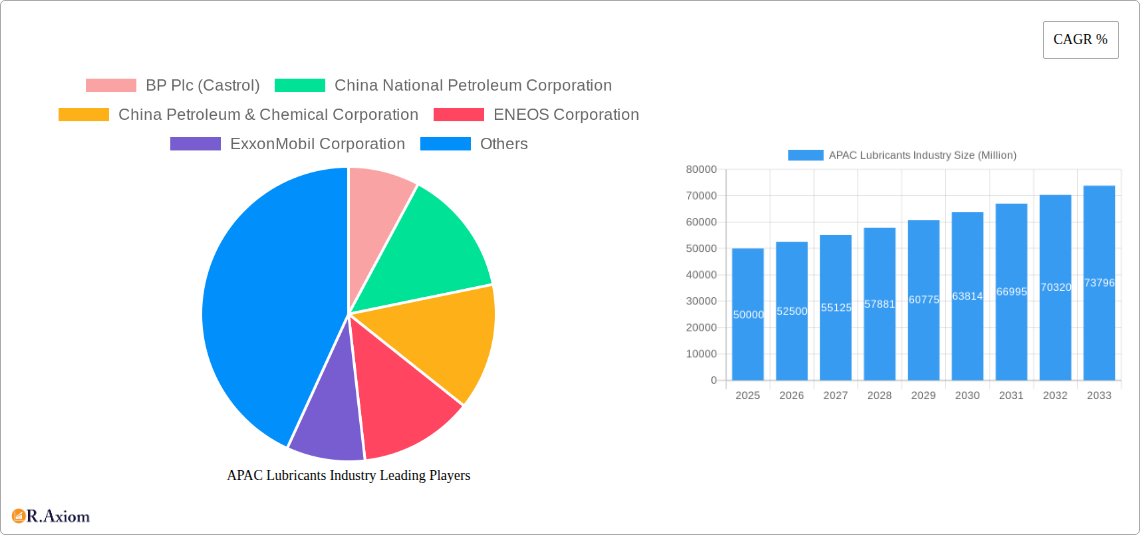
APAC Lubricants Industry Company Market Share
This comprehensive report offers critical insights into the Asia-Pacific (APAC) lubricants industry for stakeholders, investors, and strategic decision-makers. Analyzing the period from 2019 to 2033, with a base year of 2025, the report details market dynamics, growth catalysts, challenges, and emerging opportunities in this vibrant sector. Leveraging extensive data analysis and expert perspectives, this report provides a clear and actionable understanding of the APAC lubricants market. Market values are presented in millions.
APAC Lubricants Industry Market Concentration & Innovation
The APAC lubricants market exhibits a moderately concentrated structure, with several multinational players holding significant market share. Key players like BP Plc (Castrol), ExxonMobil Corporation, Royal Dutch Shell Plc, and TotalEnergies compete fiercely, alongside major regional players such as China National Petroleum Corporation and Indian Oil Corporation Limited. The market share of these dominant players fluctuates based on various factors, including pricing strategies, product innovation, and strategic partnerships. In 2024, the top five players held an estimated xx% market share collectively.
Innovation within the industry is driven by factors such as stringent emission regulations, the growing demand for energy-efficient vehicles, and the increasing adoption of advanced lubricants in various industrial applications. Major technological advancements focus on improving lubricant performance, extending product lifespan, and reducing environmental impact. The regulatory framework varies across APAC nations and heavily influences formulation standards and environmental compliance. Product substitutes, such as biodegradable lubricants, are gaining traction, driven by environmental awareness. End-user trends reveal a preference for higher-performance lubricants capable of maximizing equipment efficiency and minimizing maintenance costs. Mergers and acquisitions (M&A) activities within the APAC lubricants market are relatively frequent, with deals primarily aiming at expanding market reach, integrating technologies, and strengthening product portfolios. Recent M&A deal values have ranged from xx Million to xx Million.
- Market Share: Top 5 players held an estimated xx% in 2024.
- M&A Deal Values: xx Million - xx Million (Recent Transactions)
- Innovation Focus: Energy efficiency, extended lifespan, reduced environmental impact.
APAC Lubricants Industry Industry Trends & Insights
The APAC lubricants market is characterized by robust growth, driven by several factors. The increasing industrialization and urbanization across the region are key catalysts. The construction and automotive sectors' rapid expansion contribute significantly to the market's growth, demanding higher volumes of lubricants. Furthermore, the burgeoning middle class and rising disposable incomes fuel increased vehicle ownership, further boosting demand. Technological disruptions, like the shift towards electric vehicles (EVs), are creating new opportunities for specialized lubricants. However, this transition also presents challenges for traditional lubricant manufacturers. Consumer preferences are shifting towards eco-friendly and high-performance lubricants, necessitating ongoing product innovation. Competitive dynamics are intense, with multinational companies competing based on pricing, product quality, and brand reputation. The market is witnessing significant growth, with a Compound Annual Growth Rate (CAGR) projected at xx% during the forecast period (2025-2033). Market penetration remains relatively high in developed economies but presents significant growth potential in emerging markets.
Dominant Markets & Segments in APAC Lubricants Industry
China dominates the APAC lubricants market, driven by its massive industrial sector, robust automotive production, and substantial infrastructure development. India holds the second largest market share, propelled by its growing automotive sector and industrial base.
- China:
- Key Drivers: Massive industrial sector, robust automotive production, significant infrastructure development.
- Dominance Analysis: The largest market, characterized by both large domestic producers and the strong presence of international companies.
- India:
- Key Drivers: Growing automotive sector, industrial expansion, increasing infrastructure spending.
- Dominance Analysis: Significant market size, high growth potential, with increasing demand from both passenger and commercial vehicles.
- Other Key Markets: Japan, South Korea, Australia, and Southeast Asian nations.
APAC Lubricants Industry Product Developments
Recent product innovations focus on advanced lubricant formulations that enhance engine performance, reduce fuel consumption, and minimize emissions. The industry is witnessing the rise of biodegradable and environmentally friendly lubricants. These developments cater to the growing demand for sustainable solutions, driven by stringent environmental regulations and increasing consumer awareness. The market is also witnessing the development of specialized lubricants for specific applications, such as electric vehicles, heavy-duty machinery, and precision equipment, offering competitive advantages through improved performance and efficiency.
Report Scope & Segmentation Analysis
This report segments the APAC lubricants market by product type (engine oils, gear oils, greases, etc.), application (automotive, industrial, etc.), and geography. Growth projections vary across segments, reflecting differences in market maturity and industry dynamics. Market sizes are provided for each segment, showcasing historical data (2019-2024), estimated values for 2025, and forecast values (2025-2033). Competitive dynamics also differ across segments, with varying levels of competition from both multinational players and regional producers.
Key Drivers of APAP Lubricants Industry Growth
Several factors drive the growth of the APAP lubricants industry:
- Economic Growth: Rapid economic expansion in APAC nations fuels industrialization and infrastructure development, increasing demand for lubricants across various sectors.
- Automotive Sector Boom: The significant growth of the automotive industry, particularly in China and India, creates substantial demand for automotive lubricants.
- Technological Advancements: Continuous advancements in lubricant technology result in improved performance, efficiency, and extended product life, driving market expansion.
- Stringent Emission Regulations: Government regulations aimed at reducing emissions necessitate the use of advanced lubricants with lower environmental impact.
Challenges in the APAC Lubricants Industry Sector
The APAC lubricants industry faces certain challenges:
- Fluctuating Crude Oil Prices: Crude oil price volatility significantly impacts the cost of raw materials, affecting lubricant production costs and profitability.
- Intense Competition: The market is highly competitive, both from multinational and regional players, putting pressure on pricing and profit margins.
- Environmental Concerns: Growing environmental concerns necessitate investments in sustainable solutions and compliance with increasingly stringent environmental regulations.
Emerging Opportunities in APAC Lubricants Industry
Emerging opportunities in the APAC lubricants industry include:
- Growth in Emerging Markets: Expanding markets in Southeast Asia and other developing economies present significant growth potential.
- Demand for Sustainable Lubricants: The increasing focus on environmental sustainability creates opportunities for biodegradable and eco-friendly lubricants.
- Specialised Lubricant Applications: The development of specialized lubricants for niche applications in sectors like renewable energy and aerospace holds significant potential.
Leading Players in the APAC Lubricants Industry Market
- BP Plc (Castrol)
- China National Petroleum Corporation
- China Petroleum & Chemical Corporation
- ENEOS Corporation
- ExxonMobil Corporation
- GS Caltex
- Idemitsu Kosan Co Ltd
- Indian Oil Corporation Limited
- Royal Dutch Shell Plc
- TotalEnergies
Key Developments in APAC Lubricants Industry Industry
- January 2022: ExxonMobil Corporation reorganized into three business lines: ExxonMobil Upstream Company, ExxonMobil Product Solutions, and ExxonMobil Low Carbon Solutions. This restructuring reflects a strategic focus on adapting to the evolving energy landscape.
- March 2022: ExxonMobil Corporation appointed Jay Hooley as lead managing director. This leadership change may signal shifts in strategic direction or operational focus.
- May 2022: TotalEnergies and NEXUS Automotive extended their strategic partnership for five years, expanding TotalEnergies' presence in the N! community (sales grew from EUR 7.2 Billion in 2015 to nearly EUR 35 Billion by the end of 2021). This partnership significantly strengthens TotalEnergies' market position and distribution network.
Strategic Outlook for APAC Lubricants Industry Market
The APAC lubricants market is poised for continued growth driven by sustained economic development, expanding industrial sectors, and the increasing demand for advanced and sustainable lubricants. Emerging market opportunities in Southeast Asia, along with the transition to sustainable solutions, will shape the future landscape. Companies that effectively adapt to evolving consumer preferences and technological advancements will be best positioned to capture significant market share. The focus on product innovation, efficient distribution networks, and strategic partnerships will be crucial for success in this dynamic market.
APAC Lubricants Industry Segmentation
-
1. End User
- 1.1. Automotive
- 1.2. Heavy Equipment
- 1.3. Metallurgy & Metalworking
- 1.4. Power Generation
- 1.5. Other End-user Industries
-
2. Product Type
- 2.1. Engine Oils
- 2.2. Greases
- 2.3. Hydraulic Fluids
- 2.4. Metalworking Fluids
- 2.5. Transmission & Gear Oils
- 2.6. Other Product Types
APAC Lubricants Industry Segmentation By Geography
-
1. North America
- 1.1. United States
- 1.2. Canada
- 1.3. Mexico
-
2. South America
- 2.1. Brazil
- 2.2. Argentina
- 2.3. Rest of South America
-
3. Europe
- 3.1. United Kingdom
- 3.2. Germany
- 3.3. France
- 3.4. Italy
- 3.5. Spain
- 3.6. Russia
- 3.7. Benelux
- 3.8. Nordics
- 3.9. Rest of Europe
-
4. Middle East & Africa
- 4.1. Turkey
- 4.2. Israel
- 4.3. GCC
- 4.4. North Africa
- 4.5. South Africa
- 4.6. Rest of Middle East & Africa
-
5. Asia Pacific
- 5.1. China
- 5.2. India
- 5.3. Japan
- 5.4. South Korea
- 5.5. ASEAN
- 5.6. Oceania
- 5.7. Rest of Asia Pacific
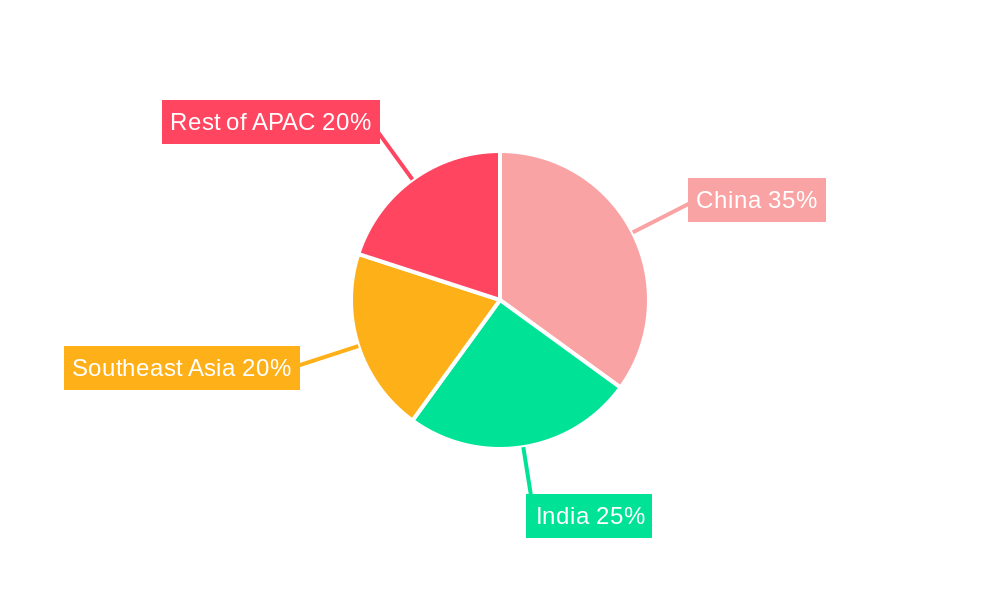
APAC Lubricants Industry Regional Market Share
Geographic Coverage of APAC Lubricants Industry
APAC Lubricants Industry REPORT HIGHLIGHTS
| Aspects | Details |
|---|---|
| Study Period | 2020-2034 |
| Base Year | 2025 |
| Estimated Year | 2026 |
| Forecast Period | 2026-2034 |
| Historical Period | 2020-2025 |
| Growth Rate | CAGR of 4% from 2020-2034 |
| Segmentation |
|
Table of Contents
- 1. Introduction
- 1.1. Research Scope
- 1.2. Market Segmentation
- 1.3. Research Objective
- 1.4. Definitions and Assumptions
- 2. Executive Summary
- 2.1. Market Snapshot
- 3. Market Dynamics
- 3.1. Market Drivers
- 3.2. Market Restrains
- 3.3. Market Trends
- 3.4. Market Opportunities
- 4. Market Factor Analysis
- 4.1. Porters Five Forces
- 4.1.1. Bargaining Power of Suppliers
- 4.1.2. Bargaining Power of Buyers
- 4.1.3. Threat of New Entrants
- 4.1.4. Threat of Substitutes
- 4.1.5. Competitive Rivalry
- 4.2. PESTEL analysis
- 4.3. BCG Analysis
- 4.3.1. Stars (High Growth, High Market Share)
- 4.3.2. Cash Cows (Low Growth, High Market Share)
- 4.3.3. Question Mark (High Growth, Low Market Share)
- 4.3.4. Dogs (Low Growth, Low Market Share)
- 4.4. Ansoff Matrix Analysis
- 4.5. Supply Chain Analysis
- 4.6. Regulatory Landscape
- 4.7. Current Market Potential and Opportunity Assessment (TAM–SAM–SOM Framework)
- 4.8. RAX Analyst Note
- 4.1. Porters Five Forces
- 5. Market Analysis, Insights and Forecast 2021-2033
- 5.1. Market Analysis, Insights and Forecast - by End User
- 5.1.1. Automotive
- 5.1.2. Heavy Equipment
- 5.1.3. Metallurgy & Metalworking
- 5.1.4. Power Generation
- 5.1.5. Other End-user Industries
- 5.2. Market Analysis, Insights and Forecast - by Product Type
- 5.2.1. Engine Oils
- 5.2.2. Greases
- 5.2.3. Hydraulic Fluids
- 5.2.4. Metalworking Fluids
- 5.2.5. Transmission & Gear Oils
- 5.2.6. Other Product Types
- 5.3. Market Analysis, Insights and Forecast - by Region
- 5.3.1. North America
- 5.3.2. South America
- 5.3.3. Europe
- 5.3.4. Middle East & Africa
- 5.3.5. Asia Pacific
- 5.1. Market Analysis, Insights and Forecast - by End User
- 6. Global APAC Lubricants Industry Analysis, Insights and Forecast, 2021-2033
- 6.1. Market Analysis, Insights and Forecast - by End User
- 6.1.1. Automotive
- 6.1.2. Heavy Equipment
- 6.1.3. Metallurgy & Metalworking
- 6.1.4. Power Generation
- 6.1.5. Other End-user Industries
- 6.2. Market Analysis, Insights and Forecast - by Product Type
- 6.2.1. Engine Oils
- 6.2.2. Greases
- 6.2.3. Hydraulic Fluids
- 6.2.4. Metalworking Fluids
- 6.2.5. Transmission & Gear Oils
- 6.2.6. Other Product Types
- 6.1. Market Analysis, Insights and Forecast - by End User
- 7. North America APAC Lubricants Industry Analysis, Insights and Forecast, 2020-2032
- 7.1. Market Analysis, Insights and Forecast - by End User
- 7.1.1. Automotive
- 7.1.2. Heavy Equipment
- 7.1.3. Metallurgy & Metalworking
- 7.1.4. Power Generation
- 7.1.5. Other End-user Industries
- 7.2. Market Analysis, Insights and Forecast - by Product Type
- 7.2.1. Engine Oils
- 7.2.2. Greases
- 7.2.3. Hydraulic Fluids
- 7.2.4. Metalworking Fluids
- 7.2.5. Transmission & Gear Oils
- 7.2.6. Other Product Types
- 7.1. Market Analysis, Insights and Forecast - by End User
- 8. South America APAC Lubricants Industry Analysis, Insights and Forecast, 2020-2032
- 8.1. Market Analysis, Insights and Forecast - by End User
- 8.1.1. Automotive
- 8.1.2. Heavy Equipment
- 8.1.3. Metallurgy & Metalworking
- 8.1.4. Power Generation
- 8.1.5. Other End-user Industries
- 8.2. Market Analysis, Insights and Forecast - by Product Type
- 8.2.1. Engine Oils
- 8.2.2. Greases
- 8.2.3. Hydraulic Fluids
- 8.2.4. Metalworking Fluids
- 8.2.5. Transmission & Gear Oils
- 8.2.6. Other Product Types
- 8.1. Market Analysis, Insights and Forecast - by End User
- 9. Europe APAC Lubricants Industry Analysis, Insights and Forecast, 2020-2032
- 9.1. Market Analysis, Insights and Forecast - by End User
- 9.1.1. Automotive
- 9.1.2. Heavy Equipment
- 9.1.3. Metallurgy & Metalworking
- 9.1.4. Power Generation
- 9.1.5. Other End-user Industries
- 9.2. Market Analysis, Insights and Forecast - by Product Type
- 9.2.1. Engine Oils
- 9.2.2. Greases
- 9.2.3. Hydraulic Fluids
- 9.2.4. Metalworking Fluids
- 9.2.5. Transmission & Gear Oils
- 9.2.6. Other Product Types
- 9.1. Market Analysis, Insights and Forecast - by End User
- 10. Middle East & Africa APAC Lubricants Industry Analysis, Insights and Forecast, 2020-2032
- 10.1. Market Analysis, Insights and Forecast - by End User
- 10.1.1. Automotive
- 10.1.2. Heavy Equipment
- 10.1.3. Metallurgy & Metalworking
- 10.1.4. Power Generation
- 10.1.5. Other End-user Industries
- 10.2. Market Analysis, Insights and Forecast - by Product Type
- 10.2.1. Engine Oils
- 10.2.2. Greases
- 10.2.3. Hydraulic Fluids
- 10.2.4. Metalworking Fluids
- 10.2.5. Transmission & Gear Oils
- 10.2.6. Other Product Types
- 10.1. Market Analysis, Insights and Forecast - by End User
- 11. Asia Pacific APAC Lubricants Industry Analysis, Insights and Forecast, 2020-2032
- 11.1. Market Analysis, Insights and Forecast - by End User
- 11.1.1. Automotive
- 11.1.2. Heavy Equipment
- 11.1.3. Metallurgy & Metalworking
- 11.1.4. Power Generation
- 11.1.5. Other End-user Industries
- 11.2. Market Analysis, Insights and Forecast - by Product Type
- 11.2.1. Engine Oils
- 11.2.2. Greases
- 11.2.3. Hydraulic Fluids
- 11.2.4. Metalworking Fluids
- 11.2.5. Transmission & Gear Oils
- 11.2.6. Other Product Types
- 11.1. Market Analysis, Insights and Forecast - by End User
- 12. Competitive Analysis
- 12.1. Company Profiles
- 12.1.1 BP Plc (Castrol)
- 12.1.1.1. Company Overview
- 12.1.1.2. Products
- 12.1.1.3. Company Financials
- 12.1.1.4. SWOT Analysis
- 12.1.2 China National Petroleum Corporation
- 12.1.2.1. Company Overview
- 12.1.2.2. Products
- 12.1.2.3. Company Financials
- 12.1.2.4. SWOT Analysis
- 12.1.3 China Petroleum & Chemical Corporation
- 12.1.3.1. Company Overview
- 12.1.3.2. Products
- 12.1.3.3. Company Financials
- 12.1.3.4. SWOT Analysis
- 12.1.4 ENEOS Corporation
- 12.1.4.1. Company Overview
- 12.1.4.2. Products
- 12.1.4.3. Company Financials
- 12.1.4.4. SWOT Analysis
- 12.1.5 ExxonMobil Corporation
- 12.1.5.1. Company Overview
- 12.1.5.2. Products
- 12.1.5.3. Company Financials
- 12.1.5.4. SWOT Analysis
- 12.1.6 GS Caltex
- 12.1.6.1. Company Overview
- 12.1.6.2. Products
- 12.1.6.3. Company Financials
- 12.1.6.4. SWOT Analysis
- 12.1.7 Idemitsu Kosan Co Ltd
- 12.1.7.1. Company Overview
- 12.1.7.2. Products
- 12.1.7.3. Company Financials
- 12.1.7.4. SWOT Analysis
- 12.1.8 Indian Oil Corporation Limited
- 12.1.8.1. Company Overview
- 12.1.8.2. Products
- 12.1.8.3. Company Financials
- 12.1.8.4. SWOT Analysis
- 12.1.9 Royal Dutch Shell Plc
- 12.1.9.1. Company Overview
- 12.1.9.2. Products
- 12.1.9.3. Company Financials
- 12.1.9.4. SWOT Analysis
- 12.1.10 TotalEnergie
- 12.1.10.1. Company Overview
- 12.1.10.2. Products
- 12.1.10.3. Company Financials
- 12.1.10.4. SWOT Analysis
- 12.1.1 BP Plc (Castrol)
- 12.2. Market Entropy
- 12.2.1 Company's Key Areas Served
- 12.2.2 Recent Developments
- 12.3. Company Market Share Analysis 2025
- 12.3.1 Top 5 Companies Market Share Analysis
- 12.3.2 Top 3 Companies Market Share Analysis
- 12.4. List of Potential Customers
- 13. Research Methodology
List of Figures
- Figure 1: Global APAC Lubricants Industry Revenue Breakdown (million, %) by Region 2025 & 2033
- Figure 2: North America APAC Lubricants Industry Revenue (million), by End User 2025 & 2033
- Figure 3: North America APAC Lubricants Industry Revenue Share (%), by End User 2025 & 2033
- Figure 4: North America APAC Lubricants Industry Revenue (million), by Product Type 2025 & 2033
- Figure 5: North America APAC Lubricants Industry Revenue Share (%), by Product Type 2025 & 2033
- Figure 6: North America APAC Lubricants Industry Revenue (million), by Country 2025 & 2033
- Figure 7: North America APAC Lubricants Industry Revenue Share (%), by Country 2025 & 2033
- Figure 8: South America APAC Lubricants Industry Revenue (million), by End User 2025 & 2033
- Figure 9: South America APAC Lubricants Industry Revenue Share (%), by End User 2025 & 2033
- Figure 10: South America APAC Lubricants Industry Revenue (million), by Product Type 2025 & 2033
- Figure 11: South America APAC Lubricants Industry Revenue Share (%), by Product Type 2025 & 2033
- Figure 12: South America APAC Lubricants Industry Revenue (million), by Country 2025 & 2033
- Figure 13: South America APAC Lubricants Industry Revenue Share (%), by Country 2025 & 2033
- Figure 14: Europe APAC Lubricants Industry Revenue (million), by End User 2025 & 2033
- Figure 15: Europe APAC Lubricants Industry Revenue Share (%), by End User 2025 & 2033
- Figure 16: Europe APAC Lubricants Industry Revenue (million), by Product Type 2025 & 2033
- Figure 17: Europe APAC Lubricants Industry Revenue Share (%), by Product Type 2025 & 2033
- Figure 18: Europe APAC Lubricants Industry Revenue (million), by Country 2025 & 2033
- Figure 19: Europe APAC Lubricants Industry Revenue Share (%), by Country 2025 & 2033
- Figure 20: Middle East & Africa APAC Lubricants Industry Revenue (million), by End User 2025 & 2033
- Figure 21: Middle East & Africa APAC Lubricants Industry Revenue Share (%), by End User 2025 & 2033
- Figure 22: Middle East & Africa APAC Lubricants Industry Revenue (million), by Product Type 2025 & 2033
- Figure 23: Middle East & Africa APAC Lubricants Industry Revenue Share (%), by Product Type 2025 & 2033
- Figure 24: Middle East & Africa APAC Lubricants Industry Revenue (million), by Country 2025 & 2033
- Figure 25: Middle East & Africa APAC Lubricants Industry Revenue Share (%), by Country 2025 & 2033
- Figure 26: Asia Pacific APAC Lubricants Industry Revenue (million), by End User 2025 & 2033
- Figure 27: Asia Pacific APAC Lubricants Industry Revenue Share (%), by End User 2025 & 2033
- Figure 28: Asia Pacific APAC Lubricants Industry Revenue (million), by Product Type 2025 & 2033
- Figure 29: Asia Pacific APAC Lubricants Industry Revenue Share (%), by Product Type 2025 & 2033
- Figure 30: Asia Pacific APAC Lubricants Industry Revenue (million), by Country 2025 & 2033
- Figure 31: Asia Pacific APAC Lubricants Industry Revenue Share (%), by Country 2025 & 2033
List of Tables
- Table 1: Global APAC Lubricants Industry Revenue million Forecast, by End User 2020 & 2033
- Table 2: Global APAC Lubricants Industry Revenue million Forecast, by Product Type 2020 & 2033
- Table 3: Global APAC Lubricants Industry Revenue million Forecast, by Region 2020 & 2033
- Table 4: Global APAC Lubricants Industry Revenue million Forecast, by End User 2020 & 2033
- Table 5: Global APAC Lubricants Industry Revenue million Forecast, by Product Type 2020 & 2033
- Table 6: Global APAC Lubricants Industry Revenue million Forecast, by Country 2020 & 2033
- Table 7: United States APAC Lubricants Industry Revenue (million) Forecast, by Application 2020 & 2033
- Table 8: Canada APAC Lubricants Industry Revenue (million) Forecast, by Application 2020 & 2033
- Table 9: Mexico APAC Lubricants Industry Revenue (million) Forecast, by Application 2020 & 2033
- Table 10: Global APAC Lubricants Industry Revenue million Forecast, by End User 2020 & 2033
- Table 11: Global APAC Lubricants Industry Revenue million Forecast, by Product Type 2020 & 2033
- Table 12: Global APAC Lubricants Industry Revenue million Forecast, by Country 2020 & 2033
- Table 13: Brazil APAC Lubricants Industry Revenue (million) Forecast, by Application 2020 & 2033
- Table 14: Argentina APAC Lubricants Industry Revenue (million) Forecast, by Application 2020 & 2033
- Table 15: Rest of South America APAC Lubricants Industry Revenue (million) Forecast, by Application 2020 & 2033
- Table 16: Global APAC Lubricants Industry Revenue million Forecast, by End User 2020 & 2033
- Table 17: Global APAC Lubricants Industry Revenue million Forecast, by Product Type 2020 & 2033
- Table 18: Global APAC Lubricants Industry Revenue million Forecast, by Country 2020 & 2033
- Table 19: United Kingdom APAC Lubricants Industry Revenue (million) Forecast, by Application 2020 & 2033
- Table 20: Germany APAC Lubricants Industry Revenue (million) Forecast, by Application 2020 & 2033
- Table 21: France APAC Lubricants Industry Revenue (million) Forecast, by Application 2020 & 2033
- Table 22: Italy APAC Lubricants Industry Revenue (million) Forecast, by Application 2020 & 2033
- Table 23: Spain APAC Lubricants Industry Revenue (million) Forecast, by Application 2020 & 2033
- Table 24: Russia APAC Lubricants Industry Revenue (million) Forecast, by Application 2020 & 2033
- Table 25: Benelux APAC Lubricants Industry Revenue (million) Forecast, by Application 2020 & 2033
- Table 26: Nordics APAC Lubricants Industry Revenue (million) Forecast, by Application 2020 & 2033
- Table 27: Rest of Europe APAC Lubricants Industry Revenue (million) Forecast, by Application 2020 & 2033
- Table 28: Global APAC Lubricants Industry Revenue million Forecast, by End User 2020 & 2033
- Table 29: Global APAC Lubricants Industry Revenue million Forecast, by Product Type 2020 & 2033
- Table 30: Global APAC Lubricants Industry Revenue million Forecast, by Country 2020 & 2033
- Table 31: Turkey APAC Lubricants Industry Revenue (million) Forecast, by Application 2020 & 2033
- Table 32: Israel APAC Lubricants Industry Revenue (million) Forecast, by Application 2020 & 2033
- Table 33: GCC APAC Lubricants Industry Revenue (million) Forecast, by Application 2020 & 2033
- Table 34: North Africa APAC Lubricants Industry Revenue (million) Forecast, by Application 2020 & 2033
- Table 35: South Africa APAC Lubricants Industry Revenue (million) Forecast, by Application 2020 & 2033
- Table 36: Rest of Middle East & Africa APAC Lubricants Industry Revenue (million) Forecast, by Application 2020 & 2033
- Table 37: Global APAC Lubricants Industry Revenue million Forecast, by End User 2020 & 2033
- Table 38: Global APAC Lubricants Industry Revenue million Forecast, by Product Type 2020 & 2033
- Table 39: Global APAC Lubricants Industry Revenue million Forecast, by Country 2020 & 2033
- Table 40: China APAC Lubricants Industry Revenue (million) Forecast, by Application 2020 & 2033
- Table 41: India APAC Lubricants Industry Revenue (million) Forecast, by Application 2020 & 2033
- Table 42: Japan APAC Lubricants Industry Revenue (million) Forecast, by Application 2020 & 2033
- Table 43: South Korea APAC Lubricants Industry Revenue (million) Forecast, by Application 2020 & 2033
- Table 44: ASEAN APAC Lubricants Industry Revenue (million) Forecast, by Application 2020 & 2033
- Table 45: Oceania APAC Lubricants Industry Revenue (million) Forecast, by Application 2020 & 2033
- Table 46: Rest of Asia Pacific APAC Lubricants Industry Revenue (million) Forecast, by Application 2020 & 2033
Frequently Asked Questions
1. What is the projected Compound Annual Growth Rate (CAGR) of the APAC Lubricants Industry?
The projected CAGR is approximately 4%.
2. Which companies are prominent players in the APAC Lubricants Industry?
Key companies in the market include BP Plc (Castrol), China National Petroleum Corporation, China Petroleum & Chemical Corporation, ENEOS Corporation, ExxonMobil Corporation, GS Caltex, Idemitsu Kosan Co Ltd, Indian Oil Corporation Limited, Royal Dutch Shell Plc, TotalEnergie.
3. What are the main segments of the APAC Lubricants Industry?
The market segments include End User, Product Type.
4. Can you provide details about the market size?
The market size is estimated to be USD 149790 million as of 2022.
5. What are some drivers contributing to market growth?
N/A
6. What are the notable trends driving market growth?
Largest Segment By End User : Automotive.
7. Are there any restraints impacting market growth?
N/A
8. Can you provide examples of recent developments in the market?
May 2022: TotalEnergies, NEXUS Automotive Extend Strategic Partnership for a period of five years. As part of this partnership, TotalEnergies Lubricants will be expanding its presence in the burgeoning N! community, which has seen rapid growth in sales from EUR 7.2 billion in 2015 to nearly EUR 35 billion by the end of 2021.March 2022: ExxonMobil Corporation company has appointed Jay Hooley as lead managing director of the company.January 2022: Effective April 1, ExxonMobil Corporation was organized along three business lines - ExxonMobil Upstream Company, ExxonMobil Product Solutions and ExxonMobil Low Carbon Solutions.
9. What pricing options are available for accessing the report?
Pricing options include single-user, multi-user, and enterprise licenses priced at USD 3800, USD 4500, and USD 5800 respectively.
10. Is the market size provided in terms of value or volume?
The market size is provided in terms of value, measured in million.
11. Are there any specific market keywords associated with the report?
Yes, the market keyword associated with the report is "APAC Lubricants Industry," which aids in identifying and referencing the specific market segment covered.
12. How do I determine which pricing option suits my needs best?
The pricing options vary based on user requirements and access needs. Individual users may opt for single-user licenses, while businesses requiring broader access may choose multi-user or enterprise licenses for cost-effective access to the report.
13. Are there any additional resources or data provided in the APAC Lubricants Industry report?
While the report offers comprehensive insights, it's advisable to review the specific contents or supplementary materials provided to ascertain if additional resources or data are available.
14. How can I stay updated on further developments or reports in the APAC Lubricants Industry?
To stay informed about further developments, trends, and reports in the APAC Lubricants Industry, consider subscribing to industry newsletters, following relevant companies and organizations, or regularly checking reputable industry news sources and publications.
Methodology
Step 1 - Identification of Relevant Samples Size from Population Database


Step 2 - Approaches for Defining Global Market Size (Value, Volume* & Price*)

Note*: In applicable scenarios
Step 3 - Data Sources
Primary Research
- Web Analytics
- Survey Reports
- Research Institute
- Latest Research Reports
- Opinion Leaders
Secondary Research
- Annual Reports
- White Paper
- Latest Press Release
- Industry Association
- Paid Database
- Investor Presentations

Step 4 - Data Triangulation
Involves using different sources of information in order to increase the validity of a study
These sources are likely to be stakeholders in a program - participants, other researchers, program staff, other community members, and so on.
Then we put all data in single framework & apply various statistical tools to find out the dynamic on the market.
During the analysis stage, feedback from the stakeholder groups would be compared to determine areas of agreement as well as areas of divergence

