

Key Insights
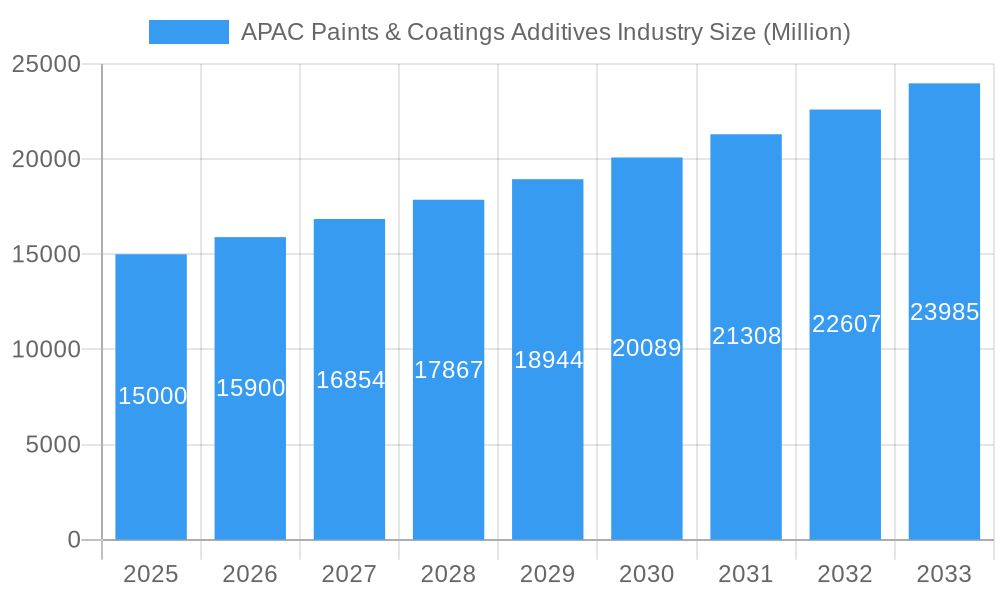
The Asia-Pacific (APAC) paints and coatings additives market is experiencing robust growth, driven by the region's burgeoning construction industry, expanding automotive sector, and increasing demand for aesthetically pleasing and durable coatings. A CAGR exceeding 6% indicates a significant upward trajectory for the market, projected to reach substantial value over the forecast period (2025-2033). Key drivers include rising disposable incomes, rapid urbanization, and government initiatives promoting infrastructure development across countries like China, India, and Southeast Asia. The dominance of specific additive types, such as biocides for enhanced protection and dispersants for improved pigment distribution, underscores the market's focus on performance and quality. While the market faces challenges like fluctuating raw material prices and stringent environmental regulations, the overall outlook remains positive. Growth is expected to be particularly strong in segments like architectural coatings, fueled by the construction boom, and the transportation segment, driven by the increasing popularity of automobiles and commercial vehicles. Competition among established players like Sherwin-Williams, Clariant, and BASF, alongside regional players, is intense, leading to innovation in additive technology and product diversification to cater to specific market needs. Significant opportunities exist for companies that can develop sustainable and high-performance additives that meet the evolving regulatory landscape and consumer demands for environmentally friendly products. The market's segmentation by application further highlights specific growth areas within the APAC region. For instance, the protective coatings segment is anticipated to show considerable growth due to increasing demand for corrosion-resistant coatings in industrial and marine applications.
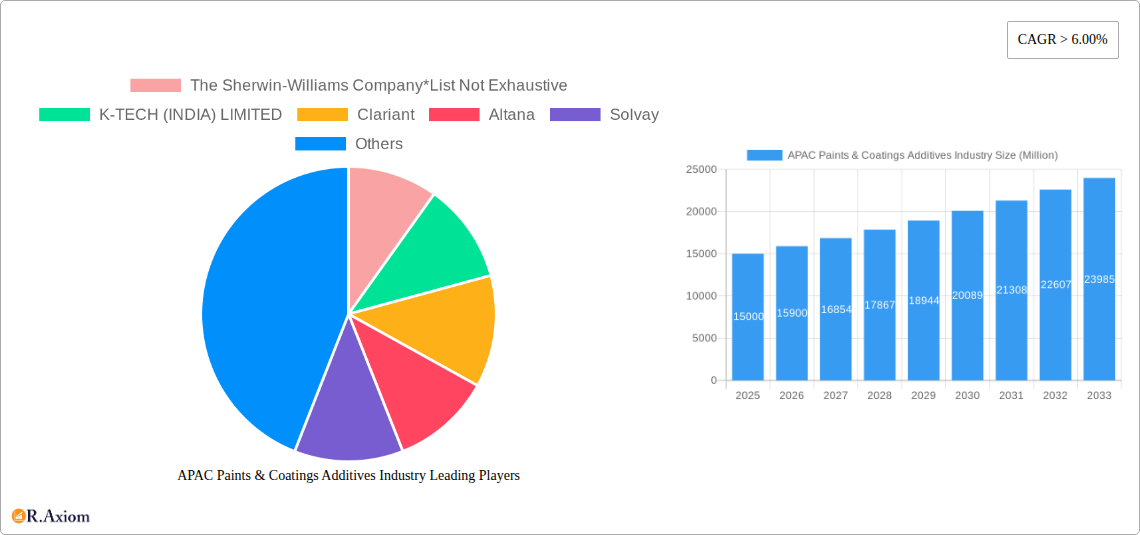
APAC Paints & Coatings Additives Industry Market Size (In Billion)
The forecast period (2025-2033) presents a compelling investment opportunity within the APAC paints and coatings additives sector. The market's resilience and consistent growth are attributed to favorable demographic shifts and economic expansion across the region. While certain segments might experience varied growth rates, the overall market trend points towards a continued upward trajectory. The increasing adoption of advanced technologies and the emergence of new applications create further growth avenues. Companies focused on research and development, coupled with strategic partnerships and expansion into emerging markets within APAC, are strategically positioned to capitalize on the market's potential. Regional variations in regulatory landscapes and consumer preferences necessitate a localized approach for maximum market penetration. However, the overarching trend indicates a significant and sustained rise in demand for paints and coatings additives across the APAC region.
APAC Paints & Coatings Additives Industry Company Market Share
This comprehensive report provides an in-depth analysis of the Asia-Pacific paints and coatings additives industry, covering the period 2019-2033. It offers valuable insights into market trends, competitive dynamics, and growth opportunities, enabling stakeholders to make informed strategic decisions. The report utilizes data from the base year 2025 and forecasts market performance until 2033, incorporating historical data from 2019-2024. This detailed analysis segments the market by type (Biocides, Dispersants and Wetting Agents, Defoamers and Deaerators, Rheology Modifiers, Surface Modifiers, Stabilizers, Flow and Leveling Additives, Other Types) and application (Architectural, Wood, Transportation, Protective, Other Applications). Key players such as The Sherwin-Williams Company, K-TECH (INDIA) LIMITED, Clariant, and others are analyzed for their market share and strategies.
APAC Paints & Coatings Additives Industry Market Concentration & Innovation
The APAC paints and coatings additives market exhibits a moderately concentrated landscape, with a few dominant players holding significant market share. The Sherwin-Williams Company, BASF SE, and Clariant, for instance, collectively account for an estimated xx% of the market in 2025. However, numerous smaller players also contribute significantly, creating a dynamic competitive environment. Innovation is a key driver, with companies investing heavily in R&D to develop sustainable, high-performance additives. This focus is driven by stringent environmental regulations, growing demand for eco-friendly products, and the need to improve the performance characteristics of paints and coatings.
Regulatory frameworks, particularly those related to VOC emissions and hazardous substance usage, significantly influence market dynamics. The increasing adoption of water-based paints and coatings fuels the demand for specialized additives that enhance their performance. Product substitution is another key factor, with manufacturers constantly seeking alternatives to traditional additives to improve cost-effectiveness and sustainability. Mergers and acquisitions (M&A) activities are frequent, with larger companies acquiring smaller specialized players to expand their product portfolios and gain access to new technologies. The total value of M&A deals in the APAC region between 2019 and 2024 is estimated at approximately $xx Million.
APAC Paints & Coatings Additives Industry Industry Trends & Insights
The APAC paints and coatings additives market is experiencing robust growth, driven by the burgeoning construction industry, expanding automotive sector, and increasing demand for protective coatings in various industrial applications. The market is projected to achieve a CAGR of xx% during the forecast period (2025-2033), reaching a value of $xx Million by 2033. Technological advancements, such as the development of nanotechnology-based additives and bio-based additives, are transforming the industry. These innovations offer enhanced performance, sustainability, and cost-effectiveness. Consumer preferences are shifting towards eco-friendly and high-performance coatings, pushing manufacturers to develop innovative and sustainable additives. The increasing adoption of digital technologies in the paints and coatings industry also presents significant opportunities for market players. Market penetration of high-performance additives is expected to increase from xx% in 2025 to xx% by 2033. Competitive dynamics are intense, with companies focusing on product differentiation, strategic partnerships, and capacity expansion to gain a competitive edge.
Dominant Markets & Segments in APAC Paints & Coatings Additives Industry
Leading Region: China dominates the APAC paints and coatings additives market, accounting for the largest market share due to its robust construction and automotive sectors. India is another significant market, witnessing rapid growth driven by infrastructure development and rising disposable incomes.
Leading Segment by Type: Dispersants and wetting agents hold the largest market share among the various additive types, owing to their crucial role in improving the rheological properties and stability of paints and coatings. The demand for rheology modifiers is also high due to their ability to optimize the flow and application properties of coatings.
Leading Segment by Application: The architectural coatings segment dominates the market, fueled by the rapid growth of the construction sector and increasing investments in infrastructure development across the region. The transportation segment also shows significant potential, driven by the growth of the automotive and aerospace industries.
Key Drivers:
- Rapid urbanization and infrastructure development: Significant investments in construction projects across major economies like China and India drive demand for paints and coatings, consequently increasing the demand for additives.
- Growth of the automotive industry: The expansion of the automotive sector in countries like India, China, and Thailand necessitates coatings for vehicles, further boosting the demand for additives.
- Favorable government policies: Supportive economic policies and infrastructure investments by governments in the region foster growth in the paints and coatings industry.
APAC Paints & Coatings Additives Industry Product Developments
Recent innovations include the introduction of bio-based additives derived from renewable resources, catering to the rising demand for sustainable products. Nanotechnology-based additives are also gaining traction due to their ability to enhance the performance and durability of paints and coatings. Manufacturers are focusing on developing additives that improve the scratch resistance, UV resistance, and water resistance of coatings. These advancements are aimed at meeting the diverse needs of various end-use industries and satisfying evolving consumer preferences for high-performance and eco-friendly coatings.
Report Scope & Segmentation Analysis
The report provides a comprehensive segmentation analysis of the APAC paints and coatings additives market based on type and application. The Type segment includes: Biocides, Dispersants and Wetting Agents, Defoamers and Deaerators, Rheology Modifiers, Surface Modifiers, Stabilizers, Flow and Leveling Additives, and Other Types. Each segment's growth projection, market size, and competitive dynamics are analyzed. Similarly, the Application segment includes: Architectural, Wood, Transportation, Protective, and Other Applications. Each application segment's market trends, growth drivers, and challenges are comprehensively assessed, providing a detailed understanding of the market landscape.
Key Drivers of APAC Paints & Coatings Additives Industry Growth
Several factors fuel the growth of the APAC paints and coatings additives market. Rapid urbanization and industrialization are key drivers, increasing demand for paints and coatings across diverse applications. Government initiatives promoting infrastructure development further amplify this demand. Technological advancements such as the development of high-performance and sustainable additives contribute to market expansion. Furthermore, rising disposable incomes and changing consumer preferences towards aesthetically pleasing and durable coatings drive market growth.
Challenges in the APAP Paints & Coatings Additives Industry Sector
The APAC paints and coatings additives industry faces challenges such as stringent environmental regulations, increasing raw material costs, and intense competition. Fluctuations in raw material prices impact profitability, while adhering to strict environmental norms adds to production costs. Supply chain disruptions can also hamper production and distribution, while the presence of numerous players creates intense competition, requiring continuous innovation and cost optimization. These factors collectively influence the industry's growth trajectory.
Emerging Opportunities in APAC Paints & Coatings Additives Industry
The growing demand for sustainable and high-performance coatings presents significant opportunities. The increasing adoption of water-based paints and coatings opens avenues for specialized additives. The expansion of the construction and automotive industries in emerging economies offers significant potential for growth. Innovation in additive technology, such as the development of nanomaterials and bio-based additives, presents further opportunities. Finally, exploring new applications, like specialized coatings for electronics and renewable energy, holds immense potential for market expansion.
Leading Players in the APAC Paints & Coatings Additives Industry Market
- The Sherwin-Williams Company
- K-TECH (INDIA) LIMITED
- Clariant
- Altana
- Solvay
- Evonik Industries AG
- 3M
- Ashland
- BASF SE
- Arkema Group
- Axalta Coating Systems
- ELEMENTIS PLC
- ALLNEX NETHERLANDS B V
- Akzo Nobel N V
- Dow
- Eastman Chemical Company
- The Chemours Company
- The Lubrizol Corporation
Key Developments in APAC Paints & Coatings Additives Industry Industry
- 2022-Q4: BASF SE launched a new range of sustainable additives for water-based coatings.
- 2023-Q1: Clariant acquired a smaller additive manufacturer, expanding its product portfolio.
- 2023-Q2: The Sherwin-Williams Company invested heavily in R&D for developing bio-based additives. (Further developments can be added here with year/month and impact description)
Strategic Outlook for APAC Paints & Coatings Additives Industry Market
The APAC paints and coatings additives market is poised for significant growth, driven by favorable macroeconomic factors and technological advancements. The increasing demand for sustainable and high-performance coatings will continue to drive innovation. Strategic partnerships and mergers & acquisitions will likely reshape the competitive landscape. Companies focused on sustainability and technological innovation are expected to gain a competitive edge in this rapidly evolving market. The market's future potential is promising, with significant opportunities for growth in both established and emerging economies within the region.
APAC Paints & Coatings Additives Industry Segmentation
-
1. Type
- 1.1. Biocides
- 1.2. Dispersants and Wetting Agents
- 1.3. Defoamers and Deaerators
- 1.4. Rheology Modifiers
- 1.5. Surface Modifiers
- 1.6. Stabilizers
- 1.7. Flow and Leveling Additives
- 1.8. Other Types
-
2. Application
- 2.1. Architectural
- 2.2. Wood
- 2.3. Transportation
- 2.4. Protective
- 2.5. Other Applications
-
3. Geography
- 3.1. China
- 3.2. India
- 3.3. Japan
- 3.4. South Korea
- 3.5. Australia & New Zealand
- 3.6. ASEAN
- 3.7. Rest of Asia-Pacific
APAC Paints & Coatings Additives Industry Segmentation By Geography
- 1. China
- 2. India
- 3. Japan
- 4. South Korea
- 5. Australia
- 6. ASEAN
- 7. Rest of Asia Pacific
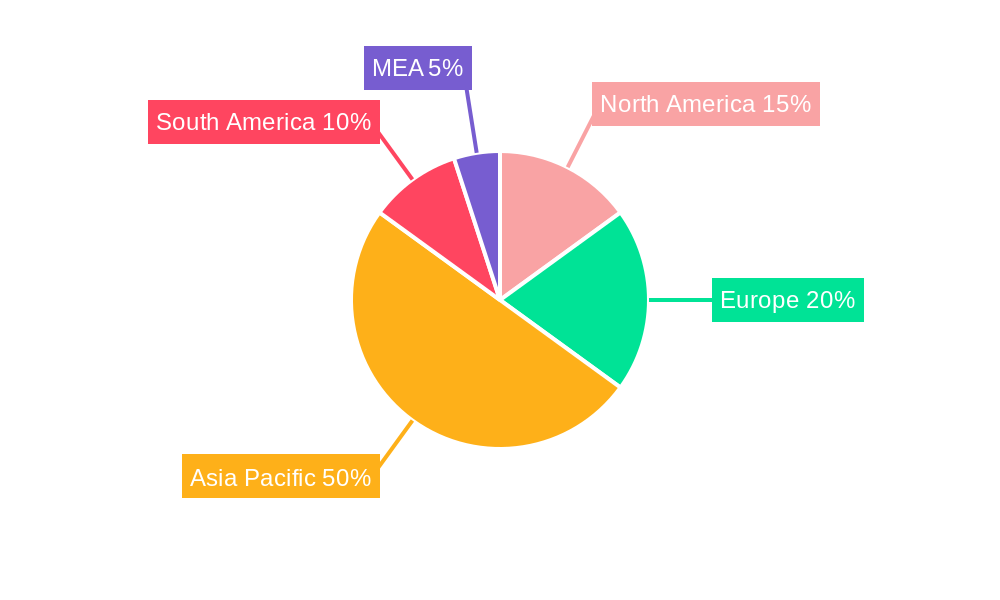
APAC Paints & Coatings Additives Industry Regional Market Share
Geographic Coverage of APAC Paints & Coatings Additives Industry
APAC Paints & Coatings Additives Industry REPORT HIGHLIGHTS
| Aspects | Details |
|---|---|
| Study Period | 2020-2034 |
| Base Year | 2025 |
| Estimated Year | 2026 |
| Forecast Period | 2026-2034 |
| Historical Period | 2020-2025 |
| Growth Rate | CAGR of 6.9% from 2020-2034 |
| Segmentation |
|
Table of Contents
- 1. Introduction
- 1.1. Research Scope
- 1.2. Market Segmentation
- 1.3. Research Objective
- 1.4. Definitions and Assumptions
- 2. Executive Summary
- 2.1. Market Snapshot
- 3. Market Dynamics
- 3.1. Market Drivers
- 3.2. Market Restrains
- 3.3. Market Trends
- 3.4. Market Opportunities
- 4. Market Factor Analysis
- 4.1. Porters Five Forces
- 4.1.1. Bargaining Power of Suppliers
- 4.1.2. Bargaining Power of Buyers
- 4.1.3. Threat of New Entrants
- 4.1.4. Threat of Substitutes
- 4.1.5. Competitive Rivalry
- 4.2. PESTEL analysis
- 4.3. BCG Analysis
- 4.3.1. Stars (High Growth, High Market Share)
- 4.3.2. Cash Cows (Low Growth, High Market Share)
- 4.3.3. Question Mark (High Growth, Low Market Share)
- 4.3.4. Dogs (Low Growth, Low Market Share)
- 4.4. Ansoff Matrix Analysis
- 4.5. Supply Chain Analysis
- 4.6. Regulatory Landscape
- 4.7. Current Market Potential and Opportunity Assessment (TAM–SAM–SOM Framework)
- 4.8. RAX Analyst Note
- 4.1. Porters Five Forces
- 5. Market Analysis, Insights and Forecast 2021-2033
- 5.1. Market Analysis, Insights and Forecast - by Type
- 5.1.1. Biocides
- 5.1.2. Dispersants and Wetting Agents
- 5.1.3. Defoamers and Deaerators
- 5.1.4. Rheology Modifiers
- 5.1.5. Surface Modifiers
- 5.1.6. Stabilizers
- 5.1.7. Flow and Leveling Additives
- 5.1.8. Other Types
- 5.2. Market Analysis, Insights and Forecast - by Application
- 5.2.1. Architectural
- 5.2.2. Wood
- 5.2.3. Transportation
- 5.2.4. Protective
- 5.2.5. Other Applications
- 5.3. Market Analysis, Insights and Forecast - by Geography
- 5.3.1. China
- 5.3.2. India
- 5.3.3. Japan
- 5.3.4. South Korea
- 5.3.5. Australia & New Zealand
- 5.3.6. ASEAN
- 5.3.7. Rest of Asia-Pacific
- 5.4. Market Analysis, Insights and Forecast - by Region
- 5.4.1. China
- 5.4.2. India
- 5.4.3. Japan
- 5.4.4. South Korea
- 5.4.5. Australia
- 5.4.6. ASEAN
- 5.4.7. Rest of Asia Pacific
- 5.1. Market Analysis, Insights and Forecast - by Type
- 6. Global APAC Paints & Coatings Additives Industry Analysis, Insights and Forecast, 2021-2033
- 6.1. Market Analysis, Insights and Forecast - by Type
- 6.1.1. Biocides
- 6.1.2. Dispersants and Wetting Agents
- 6.1.3. Defoamers and Deaerators
- 6.1.4. Rheology Modifiers
- 6.1.5. Surface Modifiers
- 6.1.6. Stabilizers
- 6.1.7. Flow and Leveling Additives
- 6.1.8. Other Types
- 6.2. Market Analysis, Insights and Forecast - by Application
- 6.2.1. Architectural
- 6.2.2. Wood
- 6.2.3. Transportation
- 6.2.4. Protective
- 6.2.5. Other Applications
- 6.3. Market Analysis, Insights and Forecast - by Geography
- 6.3.1. China
- 6.3.2. India
- 6.3.3. Japan
- 6.3.4. South Korea
- 6.3.5. Australia & New Zealand
- 6.3.6. ASEAN
- 6.3.7. Rest of Asia-Pacific
- 6.1. Market Analysis, Insights and Forecast - by Type
- 7. China APAC Paints & Coatings Additives Industry Analysis, Insights and Forecast, 2020-2032
- 7.1. Market Analysis, Insights and Forecast - by Type
- 7.1.1. Biocides
- 7.1.2. Dispersants and Wetting Agents
- 7.1.3. Defoamers and Deaerators
- 7.1.4. Rheology Modifiers
- 7.1.5. Surface Modifiers
- 7.1.6. Stabilizers
- 7.1.7. Flow and Leveling Additives
- 7.1.8. Other Types
- 7.2. Market Analysis, Insights and Forecast - by Application
- 7.2.1. Architectural
- 7.2.2. Wood
- 7.2.3. Transportation
- 7.2.4. Protective
- 7.2.5. Other Applications
- 7.3. Market Analysis, Insights and Forecast - by Geography
- 7.3.1. China
- 7.3.2. India
- 7.3.3. Japan
- 7.3.4. South Korea
- 7.3.5. Australia & New Zealand
- 7.3.6. ASEAN
- 7.3.7. Rest of Asia-Pacific
- 7.1. Market Analysis, Insights and Forecast - by Type
- 8. India APAC Paints & Coatings Additives Industry Analysis, Insights and Forecast, 2020-2032
- 8.1. Market Analysis, Insights and Forecast - by Type
- 8.1.1. Biocides
- 8.1.2. Dispersants and Wetting Agents
- 8.1.3. Defoamers and Deaerators
- 8.1.4. Rheology Modifiers
- 8.1.5. Surface Modifiers
- 8.1.6. Stabilizers
- 8.1.7. Flow and Leveling Additives
- 8.1.8. Other Types
- 8.2. Market Analysis, Insights and Forecast - by Application
- 8.2.1. Architectural
- 8.2.2. Wood
- 8.2.3. Transportation
- 8.2.4. Protective
- 8.2.5. Other Applications
- 8.3. Market Analysis, Insights and Forecast - by Geography
- 8.3.1. China
- 8.3.2. India
- 8.3.3. Japan
- 8.3.4. South Korea
- 8.3.5. Australia & New Zealand
- 8.3.6. ASEAN
- 8.3.7. Rest of Asia-Pacific
- 8.1. Market Analysis, Insights and Forecast - by Type
- 9. Japan APAC Paints & Coatings Additives Industry Analysis, Insights and Forecast, 2020-2032
- 9.1. Market Analysis, Insights and Forecast - by Type
- 9.1.1. Biocides
- 9.1.2. Dispersants and Wetting Agents
- 9.1.3. Defoamers and Deaerators
- 9.1.4. Rheology Modifiers
- 9.1.5. Surface Modifiers
- 9.1.6. Stabilizers
- 9.1.7. Flow and Leveling Additives
- 9.1.8. Other Types
- 9.2. Market Analysis, Insights and Forecast - by Application
- 9.2.1. Architectural
- 9.2.2. Wood
- 9.2.3. Transportation
- 9.2.4. Protective
- 9.2.5. Other Applications
- 9.3. Market Analysis, Insights and Forecast - by Geography
- 9.3.1. China
- 9.3.2. India
- 9.3.3. Japan
- 9.3.4. South Korea
- 9.3.5. Australia & New Zealand
- 9.3.6. ASEAN
- 9.3.7. Rest of Asia-Pacific
- 9.1. Market Analysis, Insights and Forecast - by Type
- 10. South Korea APAC Paints & Coatings Additives Industry Analysis, Insights and Forecast, 2020-2032
- 10.1. Market Analysis, Insights and Forecast - by Type
- 10.1.1. Biocides
- 10.1.2. Dispersants and Wetting Agents
- 10.1.3. Defoamers and Deaerators
- 10.1.4. Rheology Modifiers
- 10.1.5. Surface Modifiers
- 10.1.6. Stabilizers
- 10.1.7. Flow and Leveling Additives
- 10.1.8. Other Types
- 10.2. Market Analysis, Insights and Forecast - by Application
- 10.2.1. Architectural
- 10.2.2. Wood
- 10.2.3. Transportation
- 10.2.4. Protective
- 10.2.5. Other Applications
- 10.3. Market Analysis, Insights and Forecast - by Geography
- 10.3.1. China
- 10.3.2. India
- 10.3.3. Japan
- 10.3.4. South Korea
- 10.3.5. Australia & New Zealand
- 10.3.6. ASEAN
- 10.3.7. Rest of Asia-Pacific
- 10.1. Market Analysis, Insights and Forecast - by Type
- 11. Australia APAC Paints & Coatings Additives Industry Analysis, Insights and Forecast, 2020-2032
- 11.1. Market Analysis, Insights and Forecast - by Type
- 11.1.1. Biocides
- 11.1.2. Dispersants and Wetting Agents
- 11.1.3. Defoamers and Deaerators
- 11.1.4. Rheology Modifiers
- 11.1.5. Surface Modifiers
- 11.1.6. Stabilizers
- 11.1.7. Flow and Leveling Additives
- 11.1.8. Other Types
- 11.2. Market Analysis, Insights and Forecast - by Application
- 11.2.1. Architectural
- 11.2.2. Wood
- 11.2.3. Transportation
- 11.2.4. Protective
- 11.2.5. Other Applications
- 11.3. Market Analysis, Insights and Forecast - by Geography
- 11.3.1. China
- 11.3.2. India
- 11.3.3. Japan
- 11.3.4. South Korea
- 11.3.5. Australia & New Zealand
- 11.3.6. ASEAN
- 11.3.7. Rest of Asia-Pacific
- 11.1. Market Analysis, Insights and Forecast - by Type
- 12. ASEAN APAC Paints & Coatings Additives Industry Analysis, Insights and Forecast, 2020-2032
- 12.1. Market Analysis, Insights and Forecast - by Type
- 12.1.1. Biocides
- 12.1.2. Dispersants and Wetting Agents
- 12.1.3. Defoamers and Deaerators
- 12.1.4. Rheology Modifiers
- 12.1.5. Surface Modifiers
- 12.1.6. Stabilizers
- 12.1.7. Flow and Leveling Additives
- 12.1.8. Other Types
- 12.2. Market Analysis, Insights and Forecast - by Application
- 12.2.1. Architectural
- 12.2.2. Wood
- 12.2.3. Transportation
- 12.2.4. Protective
- 12.2.5. Other Applications
- 12.3. Market Analysis, Insights and Forecast - by Geography
- 12.3.1. China
- 12.3.2. India
- 12.3.3. Japan
- 12.3.4. South Korea
- 12.3.5. Australia & New Zealand
- 12.3.6. ASEAN
- 12.3.7. Rest of Asia-Pacific
- 12.1. Market Analysis, Insights and Forecast - by Type
- 13. Rest of Asia Pacific APAC Paints & Coatings Additives Industry Analysis, Insights and Forecast, 2020-2032
- 13.1. Market Analysis, Insights and Forecast - by Type
- 13.1.1. Biocides
- 13.1.2. Dispersants and Wetting Agents
- 13.1.3. Defoamers and Deaerators
- 13.1.4. Rheology Modifiers
- 13.1.5. Surface Modifiers
- 13.1.6. Stabilizers
- 13.1.7. Flow and Leveling Additives
- 13.1.8. Other Types
- 13.2. Market Analysis, Insights and Forecast - by Application
- 13.2.1. Architectural
- 13.2.2. Wood
- 13.2.3. Transportation
- 13.2.4. Protective
- 13.2.5. Other Applications
- 13.3. Market Analysis, Insights and Forecast - by Geography
- 13.3.1. China
- 13.3.2. India
- 13.3.3. Japan
- 13.3.4. South Korea
- 13.3.5. Australia & New Zealand
- 13.3.6. ASEAN
- 13.3.7. Rest of Asia-Pacific
- 13.1. Market Analysis, Insights and Forecast - by Type
- 14. Competitive Analysis
- 14.1. Company Profiles
- 14.1.1 The Sherwin-Williams Company*List Not Exhaustive
- 14.1.1.1. Company Overview
- 14.1.1.2. Products
- 14.1.1.3. Company Financials
- 14.1.1.4. SWOT Analysis
- 14.1.2 K-TECH (INDIA) LIMITED
- 14.1.2.1. Company Overview
- 14.1.2.2. Products
- 14.1.2.3. Company Financials
- 14.1.2.4. SWOT Analysis
- 14.1.3 Clariant
- 14.1.3.1. Company Overview
- 14.1.3.2. Products
- 14.1.3.3. Company Financials
- 14.1.3.4. SWOT Analysis
- 14.1.4 Altana
- 14.1.4.1. Company Overview
- 14.1.4.2. Products
- 14.1.4.3. Company Financials
- 14.1.4.4. SWOT Analysis
- 14.1.5 Solvay
- 14.1.5.1. Company Overview
- 14.1.5.2. Products
- 14.1.5.3. Company Financials
- 14.1.5.4. SWOT Analysis
- 14.1.6 Evonik Industries AG
- 14.1.6.1. Company Overview
- 14.1.6.2. Products
- 14.1.6.3. Company Financials
- 14.1.6.4. SWOT Analysis
- 14.1.7 3M
- 14.1.7.1. Company Overview
- 14.1.7.2. Products
- 14.1.7.3. Company Financials
- 14.1.7.4. SWOT Analysis
- 14.1.8 Ashland
- 14.1.8.1. Company Overview
- 14.1.8.2. Products
- 14.1.8.3. Company Financials
- 14.1.8.4. SWOT Analysis
- 14.1.9 BASF SE
- 14.1.9.1. Company Overview
- 14.1.9.2. Products
- 14.1.9.3. Company Financials
- 14.1.9.4. SWOT Analysis
- 14.1.10 Arkema Group
- 14.1.10.1. Company Overview
- 14.1.10.2. Products
- 14.1.10.3. Company Financials
- 14.1.10.4. SWOT Analysis
- 14.1.11 Axalta Coating Systems
- 14.1.11.1. Company Overview
- 14.1.11.2. Products
- 14.1.11.3. Company Financials
- 14.1.11.4. SWOT Analysis
- 14.1.12 ELEMENTIS PLC
- 14.1.12.1. Company Overview
- 14.1.12.2. Products
- 14.1.12.3. Company Financials
- 14.1.12.4. SWOT Analysis
- 14.1.13 ALLNEX NETHERLANDS B V
- 14.1.13.1. Company Overview
- 14.1.13.2. Products
- 14.1.13.3. Company Financials
- 14.1.13.4. SWOT Analysis
- 14.1.14 Akzo Nobel N V
- 14.1.14.1. Company Overview
- 14.1.14.2. Products
- 14.1.14.3. Company Financials
- 14.1.14.4. SWOT Analysis
- 14.1.15 Dow
- 14.1.15.1. Company Overview
- 14.1.15.2. Products
- 14.1.15.3. Company Financials
- 14.1.15.4. SWOT Analysis
- 14.1.16 Eastman Chemical Company
- 14.1.16.1. Company Overview
- 14.1.16.2. Products
- 14.1.16.3. Company Financials
- 14.1.16.4. SWOT Analysis
- 14.1.17 The Chemours Company
- 14.1.17.1. Company Overview
- 14.1.17.2. Products
- 14.1.17.3. Company Financials
- 14.1.17.4. SWOT Analysis
- 14.1.18 The Lubrizol Corporation
- 14.1.18.1. Company Overview
- 14.1.18.2. Products
- 14.1.18.3. Company Financials
- 14.1.18.4. SWOT Analysis
- 14.1.1 The Sherwin-Williams Company*List Not Exhaustive
- 14.2. Market Entropy
- 14.2.1 Company's Key Areas Served
- 14.2.2 Recent Developments
- 14.3. Company Market Share Analysis 2025
- 14.3.1 Top 5 Companies Market Share Analysis
- 14.3.2 Top 3 Companies Market Share Analysis
- 14.4. List of Potential Customers
- 15. Research Methodology
List of Figures
- Figure 1: Global APAC Paints & Coatings Additives Industry Revenue Breakdown (undefined, %) by Region 2025 & 2033
- Figure 2: China APAC Paints & Coatings Additives Industry Revenue (undefined), by Type 2025 & 2033
- Figure 3: China APAC Paints & Coatings Additives Industry Revenue Share (%), by Type 2025 & 2033
- Figure 4: China APAC Paints & Coatings Additives Industry Revenue (undefined), by Application 2025 & 2033
- Figure 5: China APAC Paints & Coatings Additives Industry Revenue Share (%), by Application 2025 & 2033
- Figure 6: China APAC Paints & Coatings Additives Industry Revenue (undefined), by Geography 2025 & 2033
- Figure 7: China APAC Paints & Coatings Additives Industry Revenue Share (%), by Geography 2025 & 2033
- Figure 8: China APAC Paints & Coatings Additives Industry Revenue (undefined), by Country 2025 & 2033
- Figure 9: China APAC Paints & Coatings Additives Industry Revenue Share (%), by Country 2025 & 2033
- Figure 10: India APAC Paints & Coatings Additives Industry Revenue (undefined), by Type 2025 & 2033
- Figure 11: India APAC Paints & Coatings Additives Industry Revenue Share (%), by Type 2025 & 2033
- Figure 12: India APAC Paints & Coatings Additives Industry Revenue (undefined), by Application 2025 & 2033
- Figure 13: India APAC Paints & Coatings Additives Industry Revenue Share (%), by Application 2025 & 2033
- Figure 14: India APAC Paints & Coatings Additives Industry Revenue (undefined), by Geography 2025 & 2033
- Figure 15: India APAC Paints & Coatings Additives Industry Revenue Share (%), by Geography 2025 & 2033
- Figure 16: India APAC Paints & Coatings Additives Industry Revenue (undefined), by Country 2025 & 2033
- Figure 17: India APAC Paints & Coatings Additives Industry Revenue Share (%), by Country 2025 & 2033
- Figure 18: Japan APAC Paints & Coatings Additives Industry Revenue (undefined), by Type 2025 & 2033
- Figure 19: Japan APAC Paints & Coatings Additives Industry Revenue Share (%), by Type 2025 & 2033
- Figure 20: Japan APAC Paints & Coatings Additives Industry Revenue (undefined), by Application 2025 & 2033
- Figure 21: Japan APAC Paints & Coatings Additives Industry Revenue Share (%), by Application 2025 & 2033
- Figure 22: Japan APAC Paints & Coatings Additives Industry Revenue (undefined), by Geography 2025 & 2033
- Figure 23: Japan APAC Paints & Coatings Additives Industry Revenue Share (%), by Geography 2025 & 2033
- Figure 24: Japan APAC Paints & Coatings Additives Industry Revenue (undefined), by Country 2025 & 2033
- Figure 25: Japan APAC Paints & Coatings Additives Industry Revenue Share (%), by Country 2025 & 2033
- Figure 26: South Korea APAC Paints & Coatings Additives Industry Revenue (undefined), by Type 2025 & 2033
- Figure 27: South Korea APAC Paints & Coatings Additives Industry Revenue Share (%), by Type 2025 & 2033
- Figure 28: South Korea APAC Paints & Coatings Additives Industry Revenue (undefined), by Application 2025 & 2033
- Figure 29: South Korea APAC Paints & Coatings Additives Industry Revenue Share (%), by Application 2025 & 2033
- Figure 30: South Korea APAC Paints & Coatings Additives Industry Revenue (undefined), by Geography 2025 & 2033
- Figure 31: South Korea APAC Paints & Coatings Additives Industry Revenue Share (%), by Geography 2025 & 2033
- Figure 32: South Korea APAC Paints & Coatings Additives Industry Revenue (undefined), by Country 2025 & 2033
- Figure 33: South Korea APAC Paints & Coatings Additives Industry Revenue Share (%), by Country 2025 & 2033
- Figure 34: Australia APAC Paints & Coatings Additives Industry Revenue (undefined), by Type 2025 & 2033
- Figure 35: Australia APAC Paints & Coatings Additives Industry Revenue Share (%), by Type 2025 & 2033
- Figure 36: Australia APAC Paints & Coatings Additives Industry Revenue (undefined), by Application 2025 & 2033
- Figure 37: Australia APAC Paints & Coatings Additives Industry Revenue Share (%), by Application 2025 & 2033
- Figure 38: Australia APAC Paints & Coatings Additives Industry Revenue (undefined), by Geography 2025 & 2033
- Figure 39: Australia APAC Paints & Coatings Additives Industry Revenue Share (%), by Geography 2025 & 2033
- Figure 40: Australia APAC Paints & Coatings Additives Industry Revenue (undefined), by Country 2025 & 2033
- Figure 41: Australia APAC Paints & Coatings Additives Industry Revenue Share (%), by Country 2025 & 2033
- Figure 42: ASEAN APAC Paints & Coatings Additives Industry Revenue (undefined), by Type 2025 & 2033
- Figure 43: ASEAN APAC Paints & Coatings Additives Industry Revenue Share (%), by Type 2025 & 2033
- Figure 44: ASEAN APAC Paints & Coatings Additives Industry Revenue (undefined), by Application 2025 & 2033
- Figure 45: ASEAN APAC Paints & Coatings Additives Industry Revenue Share (%), by Application 2025 & 2033
- Figure 46: ASEAN APAC Paints & Coatings Additives Industry Revenue (undefined), by Geography 2025 & 2033
- Figure 47: ASEAN APAC Paints & Coatings Additives Industry Revenue Share (%), by Geography 2025 & 2033
- Figure 48: ASEAN APAC Paints & Coatings Additives Industry Revenue (undefined), by Country 2025 & 2033
- Figure 49: ASEAN APAC Paints & Coatings Additives Industry Revenue Share (%), by Country 2025 & 2033
- Figure 50: Rest of Asia Pacific APAC Paints & Coatings Additives Industry Revenue (undefined), by Type 2025 & 2033
- Figure 51: Rest of Asia Pacific APAC Paints & Coatings Additives Industry Revenue Share (%), by Type 2025 & 2033
- Figure 52: Rest of Asia Pacific APAC Paints & Coatings Additives Industry Revenue (undefined), by Application 2025 & 2033
- Figure 53: Rest of Asia Pacific APAC Paints & Coatings Additives Industry Revenue Share (%), by Application 2025 & 2033
- Figure 54: Rest of Asia Pacific APAC Paints & Coatings Additives Industry Revenue (undefined), by Geography 2025 & 2033
- Figure 55: Rest of Asia Pacific APAC Paints & Coatings Additives Industry Revenue Share (%), by Geography 2025 & 2033
- Figure 56: Rest of Asia Pacific APAC Paints & Coatings Additives Industry Revenue (undefined), by Country 2025 & 2033
- Figure 57: Rest of Asia Pacific APAC Paints & Coatings Additives Industry Revenue Share (%), by Country 2025 & 2033
List of Tables
- Table 1: Global APAC Paints & Coatings Additives Industry Revenue undefined Forecast, by Type 2020 & 2033
- Table 2: Global APAC Paints & Coatings Additives Industry Revenue undefined Forecast, by Application 2020 & 2033
- Table 3: Global APAC Paints & Coatings Additives Industry Revenue undefined Forecast, by Geography 2020 & 2033
- Table 4: Global APAC Paints & Coatings Additives Industry Revenue undefined Forecast, by Region 2020 & 2033
- Table 5: Global APAC Paints & Coatings Additives Industry Revenue undefined Forecast, by Type 2020 & 2033
- Table 6: Global APAC Paints & Coatings Additives Industry Revenue undefined Forecast, by Application 2020 & 2033
- Table 7: Global APAC Paints & Coatings Additives Industry Revenue undefined Forecast, by Geography 2020 & 2033
- Table 8: Global APAC Paints & Coatings Additives Industry Revenue undefined Forecast, by Country 2020 & 2033
- Table 9: Global APAC Paints & Coatings Additives Industry Revenue undefined Forecast, by Type 2020 & 2033
- Table 10: Global APAC Paints & Coatings Additives Industry Revenue undefined Forecast, by Application 2020 & 2033
- Table 11: Global APAC Paints & Coatings Additives Industry Revenue undefined Forecast, by Geography 2020 & 2033
- Table 12: Global APAC Paints & Coatings Additives Industry Revenue undefined Forecast, by Country 2020 & 2033
- Table 13: Global APAC Paints & Coatings Additives Industry Revenue undefined Forecast, by Type 2020 & 2033
- Table 14: Global APAC Paints & Coatings Additives Industry Revenue undefined Forecast, by Application 2020 & 2033
- Table 15: Global APAC Paints & Coatings Additives Industry Revenue undefined Forecast, by Geography 2020 & 2033
- Table 16: Global APAC Paints & Coatings Additives Industry Revenue undefined Forecast, by Country 2020 & 2033
- Table 17: Global APAC Paints & Coatings Additives Industry Revenue undefined Forecast, by Type 2020 & 2033
- Table 18: Global APAC Paints & Coatings Additives Industry Revenue undefined Forecast, by Application 2020 & 2033
- Table 19: Global APAC Paints & Coatings Additives Industry Revenue undefined Forecast, by Geography 2020 & 2033
- Table 20: Global APAC Paints & Coatings Additives Industry Revenue undefined Forecast, by Country 2020 & 2033
- Table 21: Global APAC Paints & Coatings Additives Industry Revenue undefined Forecast, by Type 2020 & 2033
- Table 22: Global APAC Paints & Coatings Additives Industry Revenue undefined Forecast, by Application 2020 & 2033
- Table 23: Global APAC Paints & Coatings Additives Industry Revenue undefined Forecast, by Geography 2020 & 2033
- Table 24: Global APAC Paints & Coatings Additives Industry Revenue undefined Forecast, by Country 2020 & 2033
- Table 25: Global APAC Paints & Coatings Additives Industry Revenue undefined Forecast, by Type 2020 & 2033
- Table 26: Global APAC Paints & Coatings Additives Industry Revenue undefined Forecast, by Application 2020 & 2033
- Table 27: Global APAC Paints & Coatings Additives Industry Revenue undefined Forecast, by Geography 2020 & 2033
- Table 28: Global APAC Paints & Coatings Additives Industry Revenue undefined Forecast, by Country 2020 & 2033
- Table 29: Global APAC Paints & Coatings Additives Industry Revenue undefined Forecast, by Type 2020 & 2033
- Table 30: Global APAC Paints & Coatings Additives Industry Revenue undefined Forecast, by Application 2020 & 2033
- Table 31: Global APAC Paints & Coatings Additives Industry Revenue undefined Forecast, by Geography 2020 & 2033
- Table 32: Global APAC Paints & Coatings Additives Industry Revenue undefined Forecast, by Country 2020 & 2033
Frequently Asked Questions
1. What is the projected Compound Annual Growth Rate (CAGR) of the APAC Paints & Coatings Additives Industry?
The projected CAGR is approximately 6.9%.
2. Which companies are prominent players in the APAC Paints & Coatings Additives Industry?
Key companies in the market include The Sherwin-Williams Company*List Not Exhaustive, K-TECH (INDIA) LIMITED, Clariant, Altana, Solvay, Evonik Industries AG, 3M, Ashland, BASF SE, Arkema Group, Axalta Coating Systems, ELEMENTIS PLC, ALLNEX NETHERLANDS B V, Akzo Nobel N V, Dow, Eastman Chemical Company, The Chemours Company, The Lubrizol Corporation.
3. What are the main segments of the APAC Paints & Coatings Additives Industry?
The market segments include Type, Application, Geography.
4. Can you provide details about the market size?
The market size is estimated to be USD XXX N/A as of 2022.
5. What are some drivers contributing to market growth?
; Rising Demand from Furniture Coatings in China; Increasing Construction Activities.
6. What are the notable trends driving market growth?
Architectural Segment to Dominate the Market.
7. Are there any restraints impacting market growth?
; Rising Environmental Regulations.
8. Can you provide examples of recent developments in the market?
N/A
9. What pricing options are available for accessing the report?
Pricing options include single-user, multi-user, and enterprise licenses priced at USD 4750, USD 5250, and USD 8750 respectively.
10. Is the market size provided in terms of value or volume?
The market size is provided in terms of value, measured in N/A.
11. Are there any specific market keywords associated with the report?
Yes, the market keyword associated with the report is "APAC Paints & Coatings Additives Industry," which aids in identifying and referencing the specific market segment covered.
12. How do I determine which pricing option suits my needs best?
The pricing options vary based on user requirements and access needs. Individual users may opt for single-user licenses, while businesses requiring broader access may choose multi-user or enterprise licenses for cost-effective access to the report.
13. Are there any additional resources or data provided in the APAC Paints & Coatings Additives Industry report?
While the report offers comprehensive insights, it's advisable to review the specific contents or supplementary materials provided to ascertain if additional resources or data are available.
14. How can I stay updated on further developments or reports in the APAC Paints & Coatings Additives Industry?
To stay informed about further developments, trends, and reports in the APAC Paints & Coatings Additives Industry, consider subscribing to industry newsletters, following relevant companies and organizations, or regularly checking reputable industry news sources and publications.
Methodology
Step 1 - Identification of Relevant Samples Size from Population Database


Step 2 - Approaches for Defining Global Market Size (Value, Volume* & Price*)

Note*: In applicable scenarios
Step 3 - Data Sources
Primary Research
- Web Analytics
- Survey Reports
- Research Institute
- Latest Research Reports
- Opinion Leaders
Secondary Research
- Annual Reports
- White Paper
- Latest Press Release
- Industry Association
- Paid Database
- Investor Presentations

Step 4 - Data Triangulation
Involves using different sources of information in order to increase the validity of a study
These sources are likely to be stakeholders in a program - participants, other researchers, program staff, other community members, and so on.
Then we put all data in single framework & apply various statistical tools to find out the dynamic on the market.
During the analysis stage, feedback from the stakeholder groups would be compared to determine areas of agreement as well as areas of divergence