

Key Insights
The APAC Pharma Logistics Market is poised for significant expansion, projected to reach a substantial valuation with a healthy Compound Annual Growth Rate (CAGR) of 6.68%. This robust growth is fueled by a confluence of powerful drivers, primarily the escalating demand for pharmaceuticals across the region, driven by an aging population, increasing chronic disease prevalence, and improving healthcare access. The burgeoning biopharmaceutical sector, with its complex and temperature-sensitive products, necessitates sophisticated cold chain logistics, which is a critical growth area. Furthermore, advancements in pharmaceutical manufacturing and the increasing outsourcing of logistics operations by pharma companies are creating substantial opportunities. The market is also benefiting from government initiatives aimed at strengthening healthcare infrastructure and promoting pharmaceutical trade within the APAC region.
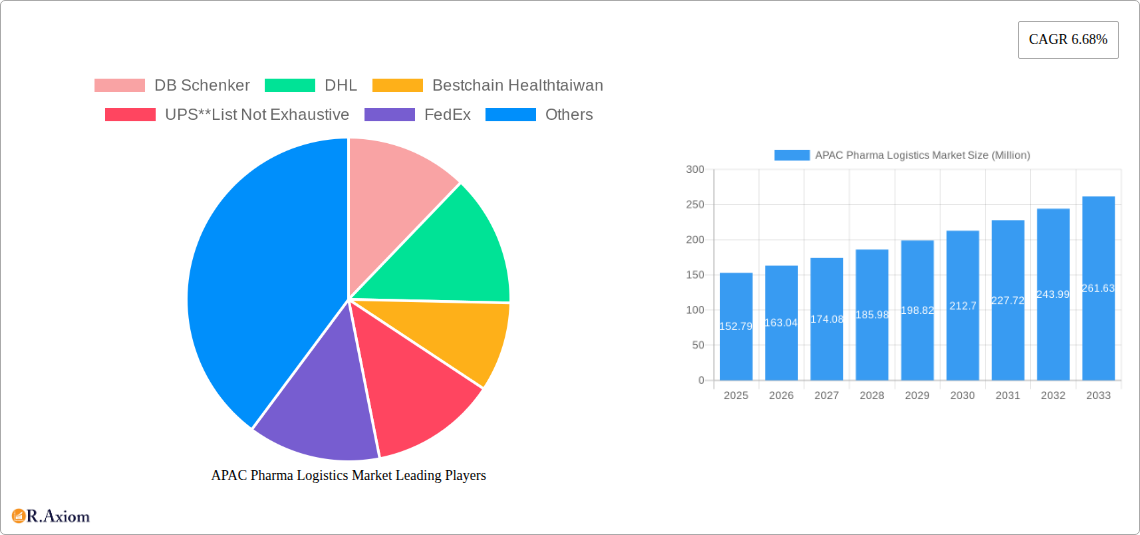
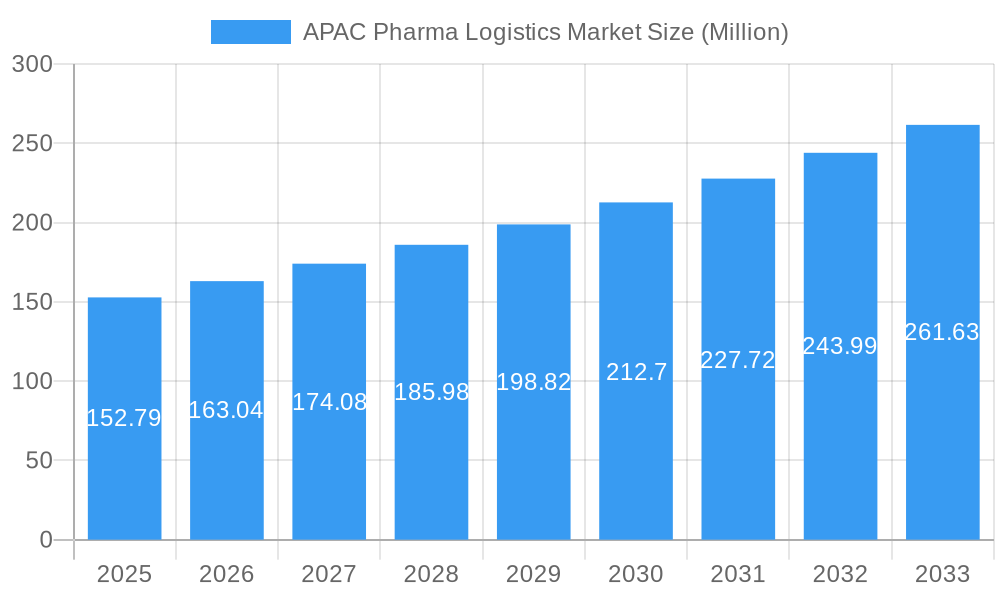
APAC Pharma Logistics Market Market Size (In Million)
Despite the promising outlook, the market faces certain restraints. The stringent regulatory landscape governing pharmaceutical logistics, including varying compliance standards across different countries, can pose challenges. High operational costs associated with specialized cold chain infrastructure, advanced tracking technologies, and trained personnel can also impact profitability. However, the industry is actively innovating to overcome these hurdles through technological integration, such as IoT for real-time monitoring and advanced analytics for route optimization. The market is segmented by product type, with generic drugs constituting a significant portion due to their widespread use, while branded drugs, particularly biologics, represent a high-value segment. The dominant mode of operation is cold chain transport, reflecting the sensitive nature of many pharmaceutical products, and road transport remains the primary mode of delivery due to its flexibility and cost-effectiveness for shorter distances, complemented by air freight for time-sensitive and high-value shipments.
APAC Pharma Logistics Market Company Market Share
This in-depth report provides a granular analysis of the APAC Pharma Logistics Market, offering critical insights into market dynamics, growth trajectories, and competitive landscapes from 2019 to 2033. With a base year of 2025 and a forecast period extending to 2033, this study is designed to empower industry stakeholders, including pharmaceutical manufacturers, logistics providers, and investors, with actionable intelligence to navigate the evolving Asia Pacific pharmaceutical supply chain. The report delves into key segments such as Generic Drugs, Branded Drugs, Cold Chain Transport, Bio Pharma, Air Freight, and China's significant market share, providing a data-driven outlook on the future of pharmaceutical logistics in the region.
APAC Pharma Logistics Market Market Concentration & Innovation
The APAC Pharma Logistics Market exhibits a moderate level of concentration, with several dominant players like DHL, DB Schenker, and Kuehne + Nagel commanding significant market share. However, a burgeoning number of regional and specialized logistics providers are fostering intense competition and driving innovation. Key innovation drivers include the increasing demand for temperature-controlled supply chains (cold chain logistics), the growing complexity of biopharmaceutical products, and the adoption of digital technologies such as IoT, AI, and blockchain for enhanced traceability and efficiency. Regulatory frameworks across the APAC region, while diverse, are increasingly aligning towards stricter quality control and Good Distribution Practices (GDP), pushing companies to invest in advanced logistics solutions. Product substitutes are limited in the context of specialized pharmaceutical logistics, as the efficacy and safety of drugs depend heavily on their specific handling requirements. End-user trends are characterized by a growing preference for integrated logistics solutions, real-time visibility, and a strong emphasis on patient safety. Merger and acquisition (M&A) activities, while present, are strategically focused on consolidating market presence, expanding service offerings, and acquiring technological capabilities. For instance, a hypothetical significant M&A deal could involve a major global player acquiring a strong regional cold chain logistics provider in India for an estimated value of USD 800 Million to bolster its presence in a high-growth market.
APAC Pharma Logistics Market Industry Trends & Insights
The APAC Pharma Logistics Market is poised for substantial growth, driven by a confluence of robust economic expansion, increasing healthcare expenditure, and a rapidly aging population across key countries like China, India, and Japan. The compound annual growth rate (CAGR) is estimated to be a healthy XX% during the forecast period. Technological disruptions are playing a pivotal role, with the integration of IoT sensors for real-time temperature monitoring, AI-powered route optimization, and blockchain for enhanced supply chain transparency and security becoming industry standards. The growing demand for biopharmaceuticals and specialized therapies necessitates advanced cold chain transport capabilities, which are a major growth catalyst. Consumer preferences are shifting towards more accessible and affordable healthcare, driving the demand for efficient generic drug distribution. However, the competitive landscape is dynamic, with established global logistics giants vying for market share against agile local players. Market penetration of advanced logistics solutions varies significantly across countries, with developed economies like Japan and South Korea leading in adoption, while emerging markets like India and Southeast Asia present significant untapped potential. The increasing prevalence of chronic diseases and the expansion of healthcare infrastructure further fuel the demand for reliable pharmaceutical logistics. The overall industry trend is towards greater digitalization, sustainability, and a patient-centric approach to supply chain management.
Dominant Markets & Segments in APAC Pharma Logistics Market
The APAC Pharma Logistics Market is characterized by distinct dominant markets and segments, each presenting unique growth drivers and opportunities.
Dominant Geography: China
- Key Drivers: China's vast population, expanding middle class, and significant government investment in healthcare infrastructure position it as the largest and most dynamic market. Economic policies promoting domestic pharmaceutical manufacturing and increasing R&D expenditure further bolster demand for sophisticated logistics.
- Dominance Analysis: China's market dominance stems from its sheer scale, coupled with a growing demand for both Generic Drugs and increasingly complex Bio Pharma products. The burgeoning e-commerce sector for pharmaceuticals also necessitates efficient road and air transport networks.
Dominant Segment: Cold Chain Transport
- Key Drivers: The escalating prevalence of biologics, vaccines, and temperature-sensitive drugs is the primary driver for Cold Chain Transport. Stringent regulatory requirements for maintaining product integrity during transit make this segment indispensable. Technological advancements in reefer containers and cold storage facilities are enabling broader reach.
- Dominance Analysis: The criticality of maintaining the efficacy and safety of sensitive pharmaceutical products ensures the sustained dominance of Cold Chain Transport. This segment is particularly crucial for Bio Pharma applications and the distribution of advanced therapies.
Dominant Segment: Bio Pharma
- Key Drivers: The rapid growth of the biotechnology sector, driven by novel drug discovery and personalized medicine, fuels the demand for specialized logistics solutions. These products often have unique handling requirements, including stringent temperature control and specialized packaging.
- Dominance Analysis: The high-value nature and complex handling needs of Bio Pharma products necessitate advanced logistics capabilities, leading to its dominance. This segment requires highly specialized services, including aseptic handling and advanced cold chain logistics.
Dominant Mode of Transport: Air Freight
- Key Drivers: The need for rapid delivery of time-sensitive and high-value pharmaceuticals, especially across the vast distances within APAC, makes Air Freight a critical component. Its speed and global reach are essential for maintaining the integrity of many pharmaceutical products.
- Dominance Analysis: For high-value, low-volume, and time-critical shipments of Branded Drugs and Bio Pharma products, Air Freight remains the dominant mode. It ensures rapid delivery from manufacturing hubs to distribution centers and ultimately to healthcare providers.
Dominant Product: Branded Drugs
- Key Drivers: The increasing demand for patented and specialized medications, driven by advancements in medical research and a growing awareness of treatment options, supports the dominance of Branded Drugs. These products often have higher price points and stringent handling requirements.
- Dominance Analysis: The market value and stringent handling requirements of Branded Drugs contribute significantly to the overall market revenue and necessitate specialized logistics services, including robust cold chain capabilities.
APAC Pharma Logistics Market Product Developments
The APAC Pharma Logistics Market is witnessing continuous product developments aimed at enhancing efficiency, safety, and visibility within the pharmaceutical supply chain. Innovations in temperature-controlled packaging, such as advanced insulation materials and active cooling systems, are crucial for maintaining the integrity of sensitive biologics and vaccines during transit. Digitalization is at the forefront, with the integration of IoT sensors providing real-time data on temperature, humidity, and location, enabling proactive intervention and risk mitigation. Blockchain technology is being implemented to ensure end-to-end traceability, combat counterfeit drugs, and streamline compliance. Furthermore, the development of specialized handling equipment and software solutions tailored for specific pharmaceutical products, like cell and gene therapies, is gaining traction, offering competitive advantages to logistics providers adept at managing these complex requirements.
Report Scope & Segmentation Analysis
This report encompasses a comprehensive analysis of the APAC Pharma Logistics Market, segmented across critical parameters to provide granular insights. The Product segmentation includes Generic Drugs and Branded Drugs, analyzing their respective market sizes, growth rates, and logistical demands. The Mode of Operation is dissected into Cold Chain Transport and Non-Cold Chain Transport, highlighting the distinct requirements and growth trends within each. For Application, the market is examined through the lenses of Bio Pharma, Chemical Pharma, and Specialized Pharma, underscoring the unique logistical challenges and opportunities each presents. The Mode of Transport analysis covers Air, Rail, Road, and Sea freight, evaluating their market share and strategic importance. Geographically, the report provides in-depth coverage of China, India, Japan, South Korea, Singapore, Australia, and the Rest of Asia Pacific, detailing market dynamics, regulatory landscapes, and growth projections for each region.
Key Drivers of APAC Pharma Logistics Market Growth
The APAC Pharma Logistics Market is propelled by several key drivers. Foremost is the escalating healthcare expenditure across the region, driven by aging demographics and rising incomes, leading to increased demand for pharmaceutical products. The expanding biologics and specialized medicine sector necessitates advanced cold chain logistics, a critical growth enabler. Technological advancements, including the adoption of IoT, AI, and blockchain for enhanced supply chain visibility and efficiency, are further stimulating growth. Government initiatives aimed at strengthening healthcare infrastructure and promoting pharmaceutical manufacturing also contribute significantly. The increasing complexity of pharmaceutical products and the stringent regulatory requirements for their safe transportation are driving the demand for specialized logistics services.
Challenges in the APAC Pharma Logistics Market Sector
The APAC Pharma Logistics Market faces several significant challenges that can impact growth and profitability. Regulatory fragmentation across different countries within the APAC region creates complexities in compliance and cross-border operations. The substantial investment required for establishing and maintaining robust cold chain infrastructure, including specialized vehicles and temperature-controlled warehouses, presents a financial barrier. Increasing fuel costs and the need for sustainable logistics solutions add to operational expenses. Furthermore, the scarcity of skilled labor proficient in handling specialized pharmaceutical logistics can hinder service quality. Intense competition among numerous players, both global and local, also exerts downward pressure on pricing. Supply chain disruptions, exacerbated by geopolitical events and natural disasters, pose a constant threat to product integrity and timely delivery.
Emerging Opportunities in APAC Pharma Logistics Market
Emerging opportunities within the APAC Pharma Logistics Market are abundant and diverse. The rapid growth of e-pharmacies and online healthcare platforms presents a significant opportunity for last-mile delivery solutions, especially in urban centers. The increasing adoption of personalized medicine and cell and gene therapies is creating a niche demand for highly specialized and ultra-cold chain logistics services. The expanding healthcare access in developing nations within Southeast Asia and the Indian subcontinent offers vast untapped potential for pharmaceutical logistics providers. Furthermore, the drive towards sustainable logistics presents opportunities for companies investing in green transportation solutions and eco-friendly packaging. The increasing focus on supply chain resilience and risk mitigation is also creating demand for advanced track-and-trace technologies and robust contingency planning services.
Leading Players in the APAC Pharma Logistics Market Market
- DB Schenker
- DHL
- Bestchain Healthtaiwan
- UPS
- FedEx
- CEVA Logistics
- Genco
- Kuehne + Nagel
- Mainfreight Ltd
- Bio Pharma Logistics
- Kerry Logistics
- Thermotraffic
- DSV Panalpina
- Arich Enterprise Co Ltd
Key Developments in APAC Pharma Logistics Market Industry
- December 2022: DHL Supply Chain disclosed its Northern Taiwan plant growth plans for five years. The investment of EUR 10 million (USD 10,515,247.1083) would expand DHL Supply Chain's market reach and meet the logistics needs of the LSHC and semiconductor industries. The newly inaugurated Taoyuan Distribution Center-Jian Guo, DHL Supply Chain's second location in Taoyuan, is a part of the development.
- August 2022: To bolster its efforts in China's pharmaceutical industry, Nippon Express (China) Co., Ltd., a group subsidiary of NIPPON EXPRESS HOLDINGS, INC., launched a Healthcare Branch in Shanghai. This new branch began operations on July 1.
Strategic Outlook for APAC Pharma Logistics Market Market
The strategic outlook for the APAC Pharma Logistics Market is exceptionally promising, driven by sustained demand for healthcare products and the continuous evolution of pharmaceutical innovation. Key growth catalysts include the burgeoning middle class, increasing disposable incomes, and a greater emphasis on preventive healthcare, all of which will fuel the demand for pharmaceutical distribution. The ongoing advancements in biotechnology and the development of novel therapeutics, particularly in areas like oncology and rare diseases, will necessitate the expansion and enhancement of cold chain logistics capabilities. Furthermore, the accelerating digital transformation within the industry, encompassing AI, IoT, and blockchain, will unlock new efficiencies, improve traceability, and bolster supply chain resilience. Strategic investments in infrastructure, technology, and talent development will be crucial for logistics providers aiming to capture market share and meet the evolving needs of pharmaceutical manufacturers and patients across the diverse APAC region. The increasing focus on sustainability also presents an opportunity for differentiation and long-term competitive advantage.
APAC Pharma Logistics Market Segmentation
-
1. Product
- 1.1. Generic Drugs
- 1.2. Branded Drugs
-
2. Mode of Operation
- 2.1. Cold Chain Transport
- 2.2. Non-Cold Chain Transport
-
3. Application
- 3.1. Bio Pharma
- 3.2. Chemical Pharma
- 3.3. Specialized Pharma
-
4. Mode of Transport
- 4.1. Air
- 4.2. Rail
- 4.3. Road
- 4.4. Sea
-
5. Geography
- 5.1. China
- 5.2. India
- 5.3. Japan
- 5.4. South Korea
- 5.5. Singapore
- 5.6. Australia
- 5.7. Rest of Asia Pacific
APAC Pharma Logistics Market Segmentation By Geography
- 1. China
- 2. India
- 3. Japan
- 4. South Korea
- 5. Singapore
- 6. Australia
- 7. Rest of Asia Pacific
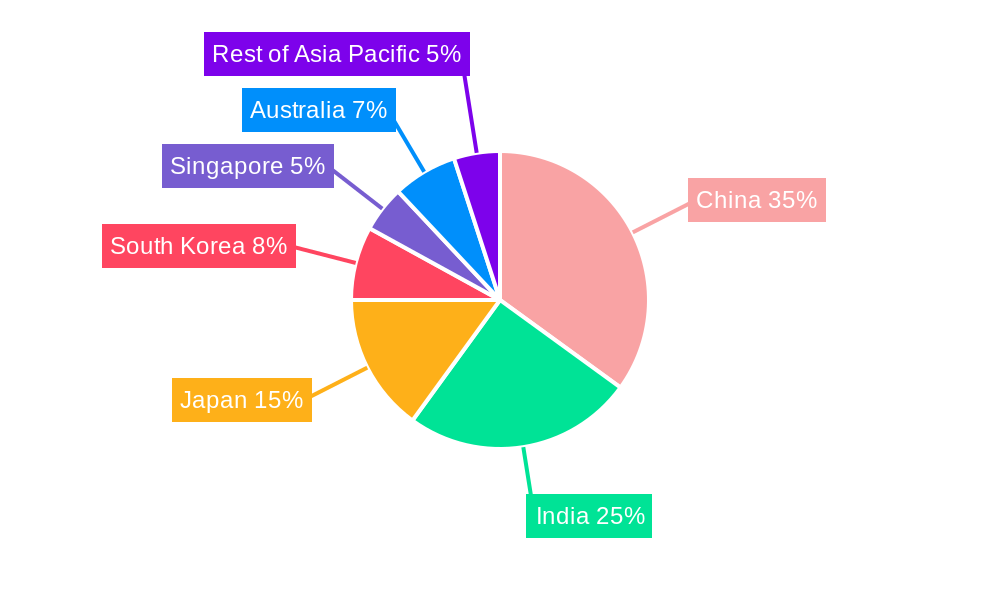
APAC Pharma Logistics Market Regional Market Share
Geographic Coverage of APAC Pharma Logistics Market
APAC Pharma Logistics Market REPORT HIGHLIGHTS
| Aspects | Details |
|---|---|
| Study Period | 2020-2034 |
| Base Year | 2025 |
| Estimated Year | 2026 |
| Forecast Period | 2026-2034 |
| Historical Period | 2020-2025 |
| Growth Rate | CAGR of 6.68% from 2020-2034 |
| Segmentation |
|
Table of Contents
- 1. Introduction
- 1.1. Research Scope
- 1.2. Market Segmentation
- 1.3. Research Objective
- 1.4. Definitions and Assumptions
- 2. Executive Summary
- 2.1. Market Snapshot
- 3. Market Dynamics
- 3.1. Market Drivers
- 3.2. Market Restrains
- 3.3. Market Trends
- 3.4. Market Opportunities
- 4. Market Factor Analysis
- 4.1. Porters Five Forces
- 4.1.1. Bargaining Power of Suppliers
- 4.1.2. Bargaining Power of Buyers
- 4.1.3. Threat of New Entrants
- 4.1.4. Threat of Substitutes
- 4.1.5. Competitive Rivalry
- 4.2. PESTEL analysis
- 4.3. BCG Analysis
- 4.3.1. Stars (High Growth, High Market Share)
- 4.3.2. Cash Cows (Low Growth, High Market Share)
- 4.3.3. Question Mark (High Growth, Low Market Share)
- 4.3.4. Dogs (Low Growth, Low Market Share)
- 4.4. Ansoff Matrix Analysis
- 4.5. Supply Chain Analysis
- 4.6. Regulatory Landscape
- 4.7. Current Market Potential and Opportunity Assessment (TAM–SAM–SOM Framework)
- 4.8. RAX Analyst Note
- 4.1. Porters Five Forces
- 5. Market Analysis, Insights and Forecast 2021-2033
- 5.1. Market Analysis, Insights and Forecast - by Product
- 5.1.1. Generic Drugs
- 5.1.2. Branded Drugs
- 5.2. Market Analysis, Insights and Forecast - by Mode of Operation
- 5.2.1. Cold Chain Transport
- 5.2.2. Non-Cold Chain Transport
- 5.3. Market Analysis, Insights and Forecast - by Application
- 5.3.1. Bio Pharma
- 5.3.2. Chemical Pharma
- 5.3.3. Specialized Pharma
- 5.4. Market Analysis, Insights and Forecast - by Mode of Transport
- 5.4.1. Air
- 5.4.2. Rail
- 5.4.3. Road
- 5.4.4. Sea
- 5.5. Market Analysis, Insights and Forecast - by Geography
- 5.5.1. China
- 5.5.2. India
- 5.5.3. Japan
- 5.5.4. South Korea
- 5.5.5. Singapore
- 5.5.6. Australia
- 5.5.7. Rest of Asia Pacific
- 5.6. Market Analysis, Insights and Forecast - by Region
- 5.6.1. China
- 5.6.2. India
- 5.6.3. Japan
- 5.6.4. South Korea
- 5.6.5. Singapore
- 5.6.6. Australia
- 5.6.7. Rest of Asia Pacific
- 5.1. Market Analysis, Insights and Forecast - by Product
- 6. Global APAC Pharma Logistics Market Analysis, Insights and Forecast, 2021-2033
- 6.1. Market Analysis, Insights and Forecast - by Product
- 6.1.1. Generic Drugs
- 6.1.2. Branded Drugs
- 6.2. Market Analysis, Insights and Forecast - by Mode of Operation
- 6.2.1. Cold Chain Transport
- 6.2.2. Non-Cold Chain Transport
- 6.3. Market Analysis, Insights and Forecast - by Application
- 6.3.1. Bio Pharma
- 6.3.2. Chemical Pharma
- 6.3.3. Specialized Pharma
- 6.4. Market Analysis, Insights and Forecast - by Mode of Transport
- 6.4.1. Air
- 6.4.2. Rail
- 6.4.3. Road
- 6.4.4. Sea
- 6.5. Market Analysis, Insights and Forecast - by Geography
- 6.5.1. China
- 6.5.2. India
- 6.5.3. Japan
- 6.5.4. South Korea
- 6.5.5. Singapore
- 6.5.6. Australia
- 6.5.7. Rest of Asia Pacific
- 6.1. Market Analysis, Insights and Forecast - by Product
- 7. China APAC Pharma Logistics Market Analysis, Insights and Forecast, 2020-2032
- 7.1. Market Analysis, Insights and Forecast - by Product
- 7.1.1. Generic Drugs
- 7.1.2. Branded Drugs
- 7.2. Market Analysis, Insights and Forecast - by Mode of Operation
- 7.2.1. Cold Chain Transport
- 7.2.2. Non-Cold Chain Transport
- 7.3. Market Analysis, Insights and Forecast - by Application
- 7.3.1. Bio Pharma
- 7.3.2. Chemical Pharma
- 7.3.3. Specialized Pharma
- 7.4. Market Analysis, Insights and Forecast - by Mode of Transport
- 7.4.1. Air
- 7.4.2. Rail
- 7.4.3. Road
- 7.4.4. Sea
- 7.5. Market Analysis, Insights and Forecast - by Geography
- 7.5.1. China
- 7.5.2. India
- 7.5.3. Japan
- 7.5.4. South Korea
- 7.5.5. Singapore
- 7.5.6. Australia
- 7.5.7. Rest of Asia Pacific
- 7.1. Market Analysis, Insights and Forecast - by Product
- 8. India APAC Pharma Logistics Market Analysis, Insights and Forecast, 2020-2032
- 8.1. Market Analysis, Insights and Forecast - by Product
- 8.1.1. Generic Drugs
- 8.1.2. Branded Drugs
- 8.2. Market Analysis, Insights and Forecast - by Mode of Operation
- 8.2.1. Cold Chain Transport
- 8.2.2. Non-Cold Chain Transport
- 8.3. Market Analysis, Insights and Forecast - by Application
- 8.3.1. Bio Pharma
- 8.3.2. Chemical Pharma
- 8.3.3. Specialized Pharma
- 8.4. Market Analysis, Insights and Forecast - by Mode of Transport
- 8.4.1. Air
- 8.4.2. Rail
- 8.4.3. Road
- 8.4.4. Sea
- 8.5. Market Analysis, Insights and Forecast - by Geography
- 8.5.1. China
- 8.5.2. India
- 8.5.3. Japan
- 8.5.4. South Korea
- 8.5.5. Singapore
- 8.5.6. Australia
- 8.5.7. Rest of Asia Pacific
- 8.1. Market Analysis, Insights and Forecast - by Product
- 9. Japan APAC Pharma Logistics Market Analysis, Insights and Forecast, 2020-2032
- 9.1. Market Analysis, Insights and Forecast - by Product
- 9.1.1. Generic Drugs
- 9.1.2. Branded Drugs
- 9.2. Market Analysis, Insights and Forecast - by Mode of Operation
- 9.2.1. Cold Chain Transport
- 9.2.2. Non-Cold Chain Transport
- 9.3. Market Analysis, Insights and Forecast - by Application
- 9.3.1. Bio Pharma
- 9.3.2. Chemical Pharma
- 9.3.3. Specialized Pharma
- 9.4. Market Analysis, Insights and Forecast - by Mode of Transport
- 9.4.1. Air
- 9.4.2. Rail
- 9.4.3. Road
- 9.4.4. Sea
- 9.5. Market Analysis, Insights and Forecast - by Geography
- 9.5.1. China
- 9.5.2. India
- 9.5.3. Japan
- 9.5.4. South Korea
- 9.5.5. Singapore
- 9.5.6. Australia
- 9.5.7. Rest of Asia Pacific
- 9.1. Market Analysis, Insights and Forecast - by Product
- 10. South Korea APAC Pharma Logistics Market Analysis, Insights and Forecast, 2020-2032
- 10.1. Market Analysis, Insights and Forecast - by Product
- 10.1.1. Generic Drugs
- 10.1.2. Branded Drugs
- 10.2. Market Analysis, Insights and Forecast - by Mode of Operation
- 10.2.1. Cold Chain Transport
- 10.2.2. Non-Cold Chain Transport
- 10.3. Market Analysis, Insights and Forecast - by Application
- 10.3.1. Bio Pharma
- 10.3.2. Chemical Pharma
- 10.3.3. Specialized Pharma
- 10.4. Market Analysis, Insights and Forecast - by Mode of Transport
- 10.4.1. Air
- 10.4.2. Rail
- 10.4.3. Road
- 10.4.4. Sea
- 10.5. Market Analysis, Insights and Forecast - by Geography
- 10.5.1. China
- 10.5.2. India
- 10.5.3. Japan
- 10.5.4. South Korea
- 10.5.5. Singapore
- 10.5.6. Australia
- 10.5.7. Rest of Asia Pacific
- 10.1. Market Analysis, Insights and Forecast - by Product
- 11. Singapore APAC Pharma Logistics Market Analysis, Insights and Forecast, 2020-2032
- 11.1. Market Analysis, Insights and Forecast - by Product
- 11.1.1. Generic Drugs
- 11.1.2. Branded Drugs
- 11.2. Market Analysis, Insights and Forecast - by Mode of Operation
- 11.2.1. Cold Chain Transport
- 11.2.2. Non-Cold Chain Transport
- 11.3. Market Analysis, Insights and Forecast - by Application
- 11.3.1. Bio Pharma
- 11.3.2. Chemical Pharma
- 11.3.3. Specialized Pharma
- 11.4. Market Analysis, Insights and Forecast - by Mode of Transport
- 11.4.1. Air
- 11.4.2. Rail
- 11.4.3. Road
- 11.4.4. Sea
- 11.5. Market Analysis, Insights and Forecast - by Geography
- 11.5.1. China
- 11.5.2. India
- 11.5.3. Japan
- 11.5.4. South Korea
- 11.5.5. Singapore
- 11.5.6. Australia
- 11.5.7. Rest of Asia Pacific
- 11.1. Market Analysis, Insights and Forecast - by Product
- 12. Australia APAC Pharma Logistics Market Analysis, Insights and Forecast, 2020-2032
- 12.1. Market Analysis, Insights and Forecast - by Product
- 12.1.1. Generic Drugs
- 12.1.2. Branded Drugs
- 12.2. Market Analysis, Insights and Forecast - by Mode of Operation
- 12.2.1. Cold Chain Transport
- 12.2.2. Non-Cold Chain Transport
- 12.3. Market Analysis, Insights and Forecast - by Application
- 12.3.1. Bio Pharma
- 12.3.2. Chemical Pharma
- 12.3.3. Specialized Pharma
- 12.4. Market Analysis, Insights and Forecast - by Mode of Transport
- 12.4.1. Air
- 12.4.2. Rail
- 12.4.3. Road
- 12.4.4. Sea
- 12.5. Market Analysis, Insights and Forecast - by Geography
- 12.5.1. China
- 12.5.2. India
- 12.5.3. Japan
- 12.5.4. South Korea
- 12.5.5. Singapore
- 12.5.6. Australia
- 12.5.7. Rest of Asia Pacific
- 12.1. Market Analysis, Insights and Forecast - by Product
- 13. Rest of Asia Pacific APAC Pharma Logistics Market Analysis, Insights and Forecast, 2020-2032
- 13.1. Market Analysis, Insights and Forecast - by Product
- 13.1.1. Generic Drugs
- 13.1.2. Branded Drugs
- 13.2. Market Analysis, Insights and Forecast - by Mode of Operation
- 13.2.1. Cold Chain Transport
- 13.2.2. Non-Cold Chain Transport
- 13.3. Market Analysis, Insights and Forecast - by Application
- 13.3.1. Bio Pharma
- 13.3.2. Chemical Pharma
- 13.3.3. Specialized Pharma
- 13.4. Market Analysis, Insights and Forecast - by Mode of Transport
- 13.4.1. Air
- 13.4.2. Rail
- 13.4.3. Road
- 13.4.4. Sea
- 13.5. Market Analysis, Insights and Forecast - by Geography
- 13.5.1. China
- 13.5.2. India
- 13.5.3. Japan
- 13.5.4. South Korea
- 13.5.5. Singapore
- 13.5.6. Australia
- 13.5.7. Rest of Asia Pacific
- 13.1. Market Analysis, Insights and Forecast - by Product
- 14. Competitive Analysis
- 14.1. Company Profiles
- 14.1.1 DB Schenker
- 14.1.1.1. Company Overview
- 14.1.1.2. Products
- 14.1.1.3. Company Financials
- 14.1.1.4. SWOT Analysis
- 14.1.2 DHL
- 14.1.2.1. Company Overview
- 14.1.2.2. Products
- 14.1.2.3. Company Financials
- 14.1.2.4. SWOT Analysis
- 14.1.3 Bestchain Healthtaiwan
- 14.1.3.1. Company Overview
- 14.1.3.2. Products
- 14.1.3.3. Company Financials
- 14.1.3.4. SWOT Analysis
- 14.1.4 UPS**List Not Exhaustive
- 14.1.4.1. Company Overview
- 14.1.4.2. Products
- 14.1.4.3. Company Financials
- 14.1.4.4. SWOT Analysis
- 14.1.5 FedEx
- 14.1.5.1. Company Overview
- 14.1.5.2. Products
- 14.1.5.3. Company Financials
- 14.1.5.4. SWOT Analysis
- 14.1.6 CEVA Logistics
- 14.1.6.1. Company Overview
- 14.1.6.2. Products
- 14.1.6.3. Company Financials
- 14.1.6.4. SWOT Analysis
- 14.1.7 Genco
- 14.1.7.1. Company Overview
- 14.1.7.2. Products
- 14.1.7.3. Company Financials
- 14.1.7.4. SWOT Analysis
- 14.1.8 Kuehne + Nagel
- 14.1.8.1. Company Overview
- 14.1.8.2. Products
- 14.1.8.3. Company Financials
- 14.1.8.4. SWOT Analysis
- 14.1.9 Mainfreight Ltd
- 14.1.9.1. Company Overview
- 14.1.9.2. Products
- 14.1.9.3. Company Financials
- 14.1.9.4. SWOT Analysis
- 14.1.10 Bio Pharma Logistics
- 14.1.10.1. Company Overview
- 14.1.10.2. Products
- 14.1.10.3. Company Financials
- 14.1.10.4. SWOT Analysis
- 14.1.11 Kerry Logistics
- 14.1.11.1. Company Overview
- 14.1.11.2. Products
- 14.1.11.3. Company Financials
- 14.1.11.4. SWOT Analysis
- 14.1.12 Thermotraffic
- 14.1.12.1. Company Overview
- 14.1.12.2. Products
- 14.1.12.3. Company Financials
- 14.1.12.4. SWOT Analysis
- 14.1.13 DSV Panalpina
- 14.1.13.1. Company Overview
- 14.1.13.2. Products
- 14.1.13.3. Company Financials
- 14.1.13.4. SWOT Analysis
- 14.1.14 Arich Enterprise Co Ltd
- 14.1.14.1. Company Overview
- 14.1.14.2. Products
- 14.1.14.3. Company Financials
- 14.1.14.4. SWOT Analysis
- 14.1.1 DB Schenker
- 14.2. Market Entropy
- 14.2.1 Company's Key Areas Served
- 14.2.2 Recent Developments
- 14.3. Company Market Share Analysis 2025
- 14.3.1 Top 5 Companies Market Share Analysis
- 14.3.2 Top 3 Companies Market Share Analysis
- 14.4. List of Potential Customers
- 15. Research Methodology
List of Figures
- Figure 1: Global APAC Pharma Logistics Market Revenue Breakdown (Million, %) by Region 2025 & 2033
- Figure 2: China APAC Pharma Logistics Market Revenue (Million), by Product 2025 & 2033
- Figure 3: China APAC Pharma Logistics Market Revenue Share (%), by Product 2025 & 2033
- Figure 4: China APAC Pharma Logistics Market Revenue (Million), by Mode of Operation 2025 & 2033
- Figure 5: China APAC Pharma Logistics Market Revenue Share (%), by Mode of Operation 2025 & 2033
- Figure 6: China APAC Pharma Logistics Market Revenue (Million), by Application 2025 & 2033
- Figure 7: China APAC Pharma Logistics Market Revenue Share (%), by Application 2025 & 2033
- Figure 8: China APAC Pharma Logistics Market Revenue (Million), by Mode of Transport 2025 & 2033
- Figure 9: China APAC Pharma Logistics Market Revenue Share (%), by Mode of Transport 2025 & 2033
- Figure 10: China APAC Pharma Logistics Market Revenue (Million), by Geography 2025 & 2033
- Figure 11: China APAC Pharma Logistics Market Revenue Share (%), by Geography 2025 & 2033
- Figure 12: China APAC Pharma Logistics Market Revenue (Million), by Country 2025 & 2033
- Figure 13: China APAC Pharma Logistics Market Revenue Share (%), by Country 2025 & 2033
- Figure 14: India APAC Pharma Logistics Market Revenue (Million), by Product 2025 & 2033
- Figure 15: India APAC Pharma Logistics Market Revenue Share (%), by Product 2025 & 2033
- Figure 16: India APAC Pharma Logistics Market Revenue (Million), by Mode of Operation 2025 & 2033
- Figure 17: India APAC Pharma Logistics Market Revenue Share (%), by Mode of Operation 2025 & 2033
- Figure 18: India APAC Pharma Logistics Market Revenue (Million), by Application 2025 & 2033
- Figure 19: India APAC Pharma Logistics Market Revenue Share (%), by Application 2025 & 2033
- Figure 20: India APAC Pharma Logistics Market Revenue (Million), by Mode of Transport 2025 & 2033
- Figure 21: India APAC Pharma Logistics Market Revenue Share (%), by Mode of Transport 2025 & 2033
- Figure 22: India APAC Pharma Logistics Market Revenue (Million), by Geography 2025 & 2033
- Figure 23: India APAC Pharma Logistics Market Revenue Share (%), by Geography 2025 & 2033
- Figure 24: India APAC Pharma Logistics Market Revenue (Million), by Country 2025 & 2033
- Figure 25: India APAC Pharma Logistics Market Revenue Share (%), by Country 2025 & 2033
- Figure 26: Japan APAC Pharma Logistics Market Revenue (Million), by Product 2025 & 2033
- Figure 27: Japan APAC Pharma Logistics Market Revenue Share (%), by Product 2025 & 2033
- Figure 28: Japan APAC Pharma Logistics Market Revenue (Million), by Mode of Operation 2025 & 2033
- Figure 29: Japan APAC Pharma Logistics Market Revenue Share (%), by Mode of Operation 2025 & 2033
- Figure 30: Japan APAC Pharma Logistics Market Revenue (Million), by Application 2025 & 2033
- Figure 31: Japan APAC Pharma Logistics Market Revenue Share (%), by Application 2025 & 2033
- Figure 32: Japan APAC Pharma Logistics Market Revenue (Million), by Mode of Transport 2025 & 2033
- Figure 33: Japan APAC Pharma Logistics Market Revenue Share (%), by Mode of Transport 2025 & 2033
- Figure 34: Japan APAC Pharma Logistics Market Revenue (Million), by Geography 2025 & 2033
- Figure 35: Japan APAC Pharma Logistics Market Revenue Share (%), by Geography 2025 & 2033
- Figure 36: Japan APAC Pharma Logistics Market Revenue (Million), by Country 2025 & 2033
- Figure 37: Japan APAC Pharma Logistics Market Revenue Share (%), by Country 2025 & 2033
- Figure 38: South Korea APAC Pharma Logistics Market Revenue (Million), by Product 2025 & 2033
- Figure 39: South Korea APAC Pharma Logistics Market Revenue Share (%), by Product 2025 & 2033
- Figure 40: South Korea APAC Pharma Logistics Market Revenue (Million), by Mode of Operation 2025 & 2033
- Figure 41: South Korea APAC Pharma Logistics Market Revenue Share (%), by Mode of Operation 2025 & 2033
- Figure 42: South Korea APAC Pharma Logistics Market Revenue (Million), by Application 2025 & 2033
- Figure 43: South Korea APAC Pharma Logistics Market Revenue Share (%), by Application 2025 & 2033
- Figure 44: South Korea APAC Pharma Logistics Market Revenue (Million), by Mode of Transport 2025 & 2033
- Figure 45: South Korea APAC Pharma Logistics Market Revenue Share (%), by Mode of Transport 2025 & 2033
- Figure 46: South Korea APAC Pharma Logistics Market Revenue (Million), by Geography 2025 & 2033
- Figure 47: South Korea APAC Pharma Logistics Market Revenue Share (%), by Geography 2025 & 2033
- Figure 48: South Korea APAC Pharma Logistics Market Revenue (Million), by Country 2025 & 2033
- Figure 49: South Korea APAC Pharma Logistics Market Revenue Share (%), by Country 2025 & 2033
- Figure 50: Singapore APAC Pharma Logistics Market Revenue (Million), by Product 2025 & 2033
- Figure 51: Singapore APAC Pharma Logistics Market Revenue Share (%), by Product 2025 & 2033
- Figure 52: Singapore APAC Pharma Logistics Market Revenue (Million), by Mode of Operation 2025 & 2033
- Figure 53: Singapore APAC Pharma Logistics Market Revenue Share (%), by Mode of Operation 2025 & 2033
- Figure 54: Singapore APAC Pharma Logistics Market Revenue (Million), by Application 2025 & 2033
- Figure 55: Singapore APAC Pharma Logistics Market Revenue Share (%), by Application 2025 & 2033
- Figure 56: Singapore APAC Pharma Logistics Market Revenue (Million), by Mode of Transport 2025 & 2033
- Figure 57: Singapore APAC Pharma Logistics Market Revenue Share (%), by Mode of Transport 2025 & 2033
- Figure 58: Singapore APAC Pharma Logistics Market Revenue (Million), by Geography 2025 & 2033
- Figure 59: Singapore APAC Pharma Logistics Market Revenue Share (%), by Geography 2025 & 2033
- Figure 60: Singapore APAC Pharma Logistics Market Revenue (Million), by Country 2025 & 2033
- Figure 61: Singapore APAC Pharma Logistics Market Revenue Share (%), by Country 2025 & 2033
- Figure 62: Australia APAC Pharma Logistics Market Revenue (Million), by Product 2025 & 2033
- Figure 63: Australia APAC Pharma Logistics Market Revenue Share (%), by Product 2025 & 2033
- Figure 64: Australia APAC Pharma Logistics Market Revenue (Million), by Mode of Operation 2025 & 2033
- Figure 65: Australia APAC Pharma Logistics Market Revenue Share (%), by Mode of Operation 2025 & 2033
- Figure 66: Australia APAC Pharma Logistics Market Revenue (Million), by Application 2025 & 2033
- Figure 67: Australia APAC Pharma Logistics Market Revenue Share (%), by Application 2025 & 2033
- Figure 68: Australia APAC Pharma Logistics Market Revenue (Million), by Mode of Transport 2025 & 2033
- Figure 69: Australia APAC Pharma Logistics Market Revenue Share (%), by Mode of Transport 2025 & 2033
- Figure 70: Australia APAC Pharma Logistics Market Revenue (Million), by Geography 2025 & 2033
- Figure 71: Australia APAC Pharma Logistics Market Revenue Share (%), by Geography 2025 & 2033
- Figure 72: Australia APAC Pharma Logistics Market Revenue (Million), by Country 2025 & 2033
- Figure 73: Australia APAC Pharma Logistics Market Revenue Share (%), by Country 2025 & 2033
- Figure 74: Rest of Asia Pacific APAC Pharma Logistics Market Revenue (Million), by Product 2025 & 2033
- Figure 75: Rest of Asia Pacific APAC Pharma Logistics Market Revenue Share (%), by Product 2025 & 2033
- Figure 76: Rest of Asia Pacific APAC Pharma Logistics Market Revenue (Million), by Mode of Operation 2025 & 2033
- Figure 77: Rest of Asia Pacific APAC Pharma Logistics Market Revenue Share (%), by Mode of Operation 2025 & 2033
- Figure 78: Rest of Asia Pacific APAC Pharma Logistics Market Revenue (Million), by Application 2025 & 2033
- Figure 79: Rest of Asia Pacific APAC Pharma Logistics Market Revenue Share (%), by Application 2025 & 2033
- Figure 80: Rest of Asia Pacific APAC Pharma Logistics Market Revenue (Million), by Mode of Transport 2025 & 2033
- Figure 81: Rest of Asia Pacific APAC Pharma Logistics Market Revenue Share (%), by Mode of Transport 2025 & 2033
- Figure 82: Rest of Asia Pacific APAC Pharma Logistics Market Revenue (Million), by Geography 2025 & 2033
- Figure 83: Rest of Asia Pacific APAC Pharma Logistics Market Revenue Share (%), by Geography 2025 & 2033
- Figure 84: Rest of Asia Pacific APAC Pharma Logistics Market Revenue (Million), by Country 2025 & 2033
- Figure 85: Rest of Asia Pacific APAC Pharma Logistics Market Revenue Share (%), by Country 2025 & 2033
List of Tables
- Table 1: Global APAC Pharma Logistics Market Revenue Million Forecast, by Product 2020 & 2033
- Table 2: Global APAC Pharma Logistics Market Revenue Million Forecast, by Mode of Operation 2020 & 2033
- Table 3: Global APAC Pharma Logistics Market Revenue Million Forecast, by Application 2020 & 2033
- Table 4: Global APAC Pharma Logistics Market Revenue Million Forecast, by Mode of Transport 2020 & 2033
- Table 5: Global APAC Pharma Logistics Market Revenue Million Forecast, by Geography 2020 & 2033
- Table 6: Global APAC Pharma Logistics Market Revenue Million Forecast, by Region 2020 & 2033
- Table 7: Global APAC Pharma Logistics Market Revenue Million Forecast, by Product 2020 & 2033
- Table 8: Global APAC Pharma Logistics Market Revenue Million Forecast, by Mode of Operation 2020 & 2033
- Table 9: Global APAC Pharma Logistics Market Revenue Million Forecast, by Application 2020 & 2033
- Table 10: Global APAC Pharma Logistics Market Revenue Million Forecast, by Mode of Transport 2020 & 2033
- Table 11: Global APAC Pharma Logistics Market Revenue Million Forecast, by Geography 2020 & 2033
- Table 12: Global APAC Pharma Logistics Market Revenue Million Forecast, by Country 2020 & 2033
- Table 13: Global APAC Pharma Logistics Market Revenue Million Forecast, by Product 2020 & 2033
- Table 14: Global APAC Pharma Logistics Market Revenue Million Forecast, by Mode of Operation 2020 & 2033
- Table 15: Global APAC Pharma Logistics Market Revenue Million Forecast, by Application 2020 & 2033
- Table 16: Global APAC Pharma Logistics Market Revenue Million Forecast, by Mode of Transport 2020 & 2033
- Table 17: Global APAC Pharma Logistics Market Revenue Million Forecast, by Geography 2020 & 2033
- Table 18: Global APAC Pharma Logistics Market Revenue Million Forecast, by Country 2020 & 2033
- Table 19: Global APAC Pharma Logistics Market Revenue Million Forecast, by Product 2020 & 2033
- Table 20: Global APAC Pharma Logistics Market Revenue Million Forecast, by Mode of Operation 2020 & 2033
- Table 21: Global APAC Pharma Logistics Market Revenue Million Forecast, by Application 2020 & 2033
- Table 22: Global APAC Pharma Logistics Market Revenue Million Forecast, by Mode of Transport 2020 & 2033
- Table 23: Global APAC Pharma Logistics Market Revenue Million Forecast, by Geography 2020 & 2033
- Table 24: Global APAC Pharma Logistics Market Revenue Million Forecast, by Country 2020 & 2033
- Table 25: Global APAC Pharma Logistics Market Revenue Million Forecast, by Product 2020 & 2033
- Table 26: Global APAC Pharma Logistics Market Revenue Million Forecast, by Mode of Operation 2020 & 2033
- Table 27: Global APAC Pharma Logistics Market Revenue Million Forecast, by Application 2020 & 2033
- Table 28: Global APAC Pharma Logistics Market Revenue Million Forecast, by Mode of Transport 2020 & 2033
- Table 29: Global APAC Pharma Logistics Market Revenue Million Forecast, by Geography 2020 & 2033
- Table 30: Global APAC Pharma Logistics Market Revenue Million Forecast, by Country 2020 & 2033
- Table 31: Global APAC Pharma Logistics Market Revenue Million Forecast, by Product 2020 & 2033
- Table 32: Global APAC Pharma Logistics Market Revenue Million Forecast, by Mode of Operation 2020 & 2033
- Table 33: Global APAC Pharma Logistics Market Revenue Million Forecast, by Application 2020 & 2033
- Table 34: Global APAC Pharma Logistics Market Revenue Million Forecast, by Mode of Transport 2020 & 2033
- Table 35: Global APAC Pharma Logistics Market Revenue Million Forecast, by Geography 2020 & 2033
- Table 36: Global APAC Pharma Logistics Market Revenue Million Forecast, by Country 2020 & 2033
- Table 37: Global APAC Pharma Logistics Market Revenue Million Forecast, by Product 2020 & 2033
- Table 38: Global APAC Pharma Logistics Market Revenue Million Forecast, by Mode of Operation 2020 & 2033
- Table 39: Global APAC Pharma Logistics Market Revenue Million Forecast, by Application 2020 & 2033
- Table 40: Global APAC Pharma Logistics Market Revenue Million Forecast, by Mode of Transport 2020 & 2033
- Table 41: Global APAC Pharma Logistics Market Revenue Million Forecast, by Geography 2020 & 2033
- Table 42: Global APAC Pharma Logistics Market Revenue Million Forecast, by Country 2020 & 2033
- Table 43: Global APAC Pharma Logistics Market Revenue Million Forecast, by Product 2020 & 2033
- Table 44: Global APAC Pharma Logistics Market Revenue Million Forecast, by Mode of Operation 2020 & 2033
- Table 45: Global APAC Pharma Logistics Market Revenue Million Forecast, by Application 2020 & 2033
- Table 46: Global APAC Pharma Logistics Market Revenue Million Forecast, by Mode of Transport 2020 & 2033
- Table 47: Global APAC Pharma Logistics Market Revenue Million Forecast, by Geography 2020 & 2033
- Table 48: Global APAC Pharma Logistics Market Revenue Million Forecast, by Country 2020 & 2033
Frequently Asked Questions
1. What is the projected Compound Annual Growth Rate (CAGR) of the APAC Pharma Logistics Market?
The projected CAGR is approximately 6.68%.
2. Which companies are prominent players in the APAC Pharma Logistics Market?
Key companies in the market include DB Schenker, DHL, Bestchain Healthtaiwan, UPS**List Not Exhaustive, FedEx, CEVA Logistics, Genco, Kuehne + Nagel, Mainfreight Ltd, Bio Pharma Logistics, Kerry Logistics, Thermotraffic, DSV Panalpina, Arich Enterprise Co Ltd.
3. What are the main segments of the APAC Pharma Logistics Market?
The market segments include Product, Mode of Operation, Application, Mode of Transport, Geography.
4. Can you provide details about the market size?
The market size is estimated to be USD 152.79 Million as of 2022.
5. What are some drivers contributing to market growth?
Growing Events in E-commerce Sector; Increasing Demand for Qualified Event Logistics Services.
6. What are the notable trends driving market growth?
Cold chain Logistics is driving the market.
7. Are there any restraints impacting market growth?
High Labour Cost; High Pricing.
8. Can you provide examples of recent developments in the market?
December 2022: DHL Supply Chain has disclosed its Northern Taiwan plant growth plans for five years. The investment of EUR 10 million (USD 10515247.1083) would expand DHL Supply Chain's market reach and meet the logistics needs of the LSHC and semiconductor industries. The newly inaugurated Taoyuan Distribution Center-Jian Guo, DHL Supply Chain's second location in Taoyuan, is a part of the development.
9. What pricing options are available for accessing the report?
Pricing options include single-user, multi-user, and enterprise licenses priced at USD 4750, USD 5250, and USD 8750 respectively.
10. Is the market size provided in terms of value or volume?
The market size is provided in terms of value, measured in Million.
11. Are there any specific market keywords associated with the report?
Yes, the market keyword associated with the report is "APAC Pharma Logistics Market," which aids in identifying and referencing the specific market segment covered.
12. How do I determine which pricing option suits my needs best?
The pricing options vary based on user requirements and access needs. Individual users may opt for single-user licenses, while businesses requiring broader access may choose multi-user or enterprise licenses for cost-effective access to the report.
13. Are there any additional resources or data provided in the APAC Pharma Logistics Market report?
While the report offers comprehensive insights, it's advisable to review the specific contents or supplementary materials provided to ascertain if additional resources or data are available.
14. How can I stay updated on further developments or reports in the APAC Pharma Logistics Market?
To stay informed about further developments, trends, and reports in the APAC Pharma Logistics Market, consider subscribing to industry newsletters, following relevant companies and organizations, or regularly checking reputable industry news sources and publications.
Methodology
Step 1 - Identification of Relevant Samples Size from Population Database


Step 2 - Approaches for Defining Global Market Size (Value, Volume* & Price*)

Note*: In applicable scenarios
Step 3 - Data Sources
Primary Research
- Web Analytics
- Survey Reports
- Research Institute
- Latest Research Reports
- Opinion Leaders
Secondary Research
- Annual Reports
- White Paper
- Latest Press Release
- Industry Association
- Paid Database
- Investor Presentations

Step 4 - Data Triangulation
Involves using different sources of information in order to increase the validity of a study
These sources are likely to be stakeholders in a program - participants, other researchers, program staff, other community members, and so on.
Then we put all data in single framework & apply various statistical tools to find out the dynamic on the market.
During the analysis stage, feedback from the stakeholder groups would be compared to determine areas of agreement as well as areas of divergence