

Key Insights
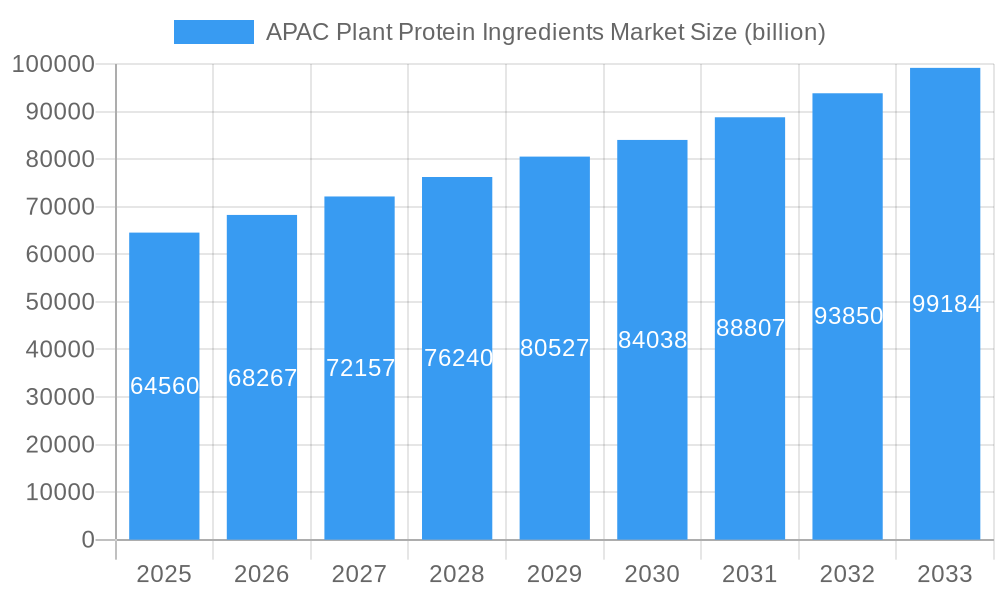
The Asia Pacific (APAC) plant protein ingredients market is poised for significant expansion, driven by a growing consumer demand for healthier and more sustainable food options. With a projected market size of USD 64.56 billion in 2025, the region is set to experience a robust CAGR of 5.8% during the forecast period of 2025-2033. This growth is fueled by increasing awareness of the health benefits associated with plant-based diets, including reduced risk of chronic diseases, and a rising concern over environmental sustainability. The demand for animal-free protein sources is further amplified by a growing middle class with higher disposable incomes and a greater propensity to adopt Western dietary trends, including flexitarianism and veganism. Furthermore, regulatory support and the increasing availability of diverse plant protein sources, such as soy, pea, and rice, are contributing to market penetration across various food and beverage applications.
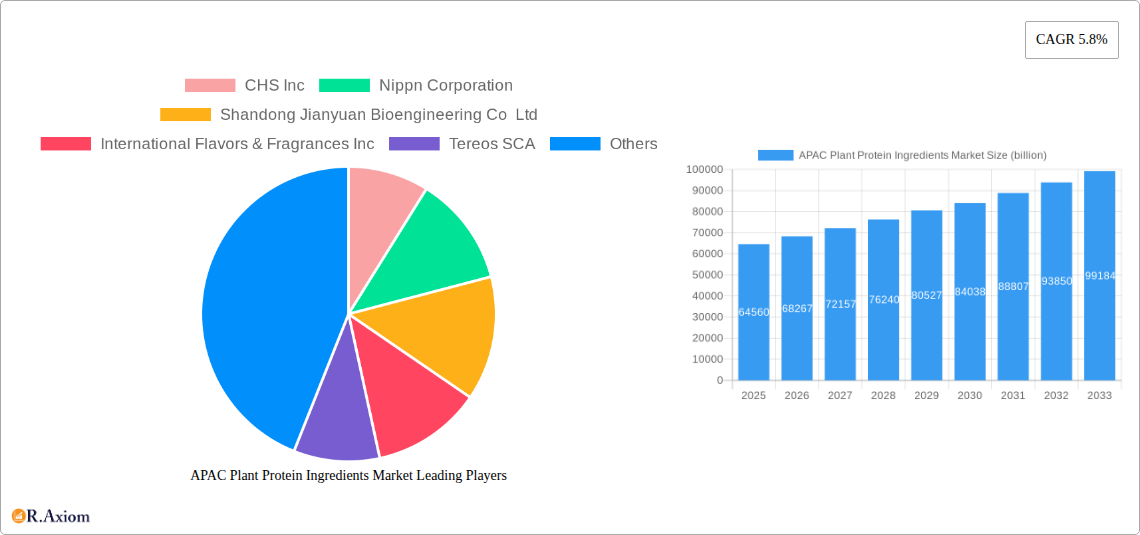
APAC Plant Protein Ingredients Market Market Size (In Billion)
The market's trajectory is further shaped by evolving consumer preferences for functional foods and beverages, leading to a surge in demand for plant protein ingredients in segments like dairy alternatives, meat substitutes, and nutritional supplements. The expanding personal care and cosmetics industry, which increasingly incorporates plant-derived ingredients for their nourishing and ethical appeal, also presents a notable growth avenue. While the market is characterized by strong drivers, challenges such as the need for enhanced taste and texture profiles, potential supply chain volatilities for certain protein sources, and the price competitiveness against conventional animal proteins will need to be strategically addressed by market players. Nevertheless, the overarching trend towards health and wellness, coupled with a strong emphasis on sustainable food systems, solidifies the optimistic outlook for the APAC plant protein ingredients market.
APAC Plant Protein Ingredients Market Company Market Share
This in-depth report delivers a thorough analysis of the APAC Plant Protein Ingredients Market, providing critical insights for stakeholders seeking to navigate this rapidly expanding sector. With a forecast period spanning 2025-2033, this study encompasses historical data from 2019-2024, using 2025 as the base and estimated year. We delve into market dynamics, key players, emerging trends, and future opportunities, presenting actionable intelligence for businesses in the plant-based protein industry, food ingredients market, and nutraceuticals sector across the Asia-Pacific region. The market is projected to reach a valuation exceeding $30 billion by 2033, driven by escalating consumer demand for healthier, sustainable, and ethical food choices.
APAC Plant Protein Ingredients Market Market Concentration & Innovation
The APAC Plant Protein Ingredients Market is characterized by a moderate to high market concentration, with a few dominant global players and a growing number of regional manufacturers. Innovation is a key differentiator, driven by the relentless pursuit of improved taste profiles, enhanced functionality, and novel protein sources. Significant R&D investments are channeled into developing plant-based alternatives that closely mimic the texture and flavor of traditional animal products. Regulatory frameworks, while evolving, are generally supportive of the plant protein market, with a focus on food safety and labeling standards. Product substitutes, primarily animal-derived proteins, are facing increasing competition from plant-based options due to their sustainability and perceived health benefits. End-user trends are overwhelmingly shifting towards plant-based diets, fueling demand across the food and beverage, supplements, and even personal care sectors. Mergers and acquisitions (M&A) activities are on the rise, with significant deal values indicating strategic consolidation and expansion. For instance, the acquisition of Meatless BV by BENEO signifies a strategic move to bolster capabilities in texturizing solutions for meat alternatives, a market segment projected to grow exponentially.
Key Innovation Drivers:
- Taste and Texture Enhancement Technologies
- Development of Novel Protein Sources (e.g., fungi, algae)
- Clean Label and Natural Ingredient Formulations
- Improved Digestibility and Bioavailability
M&A Activities:
- Strategic acquisitions by major players to expand product portfolios and market reach.
- Investments in promising startups and innovative technologies.
- Deal values in the hundreds of millions of dollars, reflecting strategic importance.
APAC Plant Protein Ingredients Market Industry Trends & Insights
The APAC Plant Protein Ingredients Market is experiencing robust growth, with a projected Compound Annual Growth Rate (CAGR) of approximately 12.5% during the forecast period (2025-2033). This expansion is propelled by a confluence of factors, including rising health consciousness among consumers, increasing awareness of the environmental impact of animal agriculture, and a growing preference for vegan and vegetarian lifestyles. Technological advancements in processing and extraction are leading to the development of higher-quality plant protein isolates and concentrates, improving their functional properties and widening their applicability in various food and beverage formulations. Consumer preferences are increasingly leaning towards clean label ingredients and products with shorter, recognizable ingredient lists, pushing manufacturers to innovate in this area. The competitive landscape is intensifying, with both established food giants and agile startups vying for market share. The penetration of plant-based foods and beverages in mainstream markets is rapidly increasing, transforming dietary habits and creating new market opportunities. The demand for sustainable and ethically sourced ingredients is a significant trend, influencing sourcing strategies and consumer perception.
Market Growth Drivers:
- Rising disposable incomes and urbanization in emerging economies.
- Government initiatives promoting healthy eating and sustainable agriculture.
- Celebrity endorsements and influencer marketing of plant-based lifestyles.
- Advancements in food technology enabling better product development.
Technological Disruptions:
- Precision fermentation for novel protein production.
- Advanced extrusion techniques for improved texture.
- Biotechnology for enhanced protein extraction efficiency.
Consumer Preferences:
- Demand for allergy-friendly options (e.g., soy-free, gluten-free).
- Growing interest in functional foods offering specific health benefits.
- Preference for visually appealing and convenient plant-based products.
Dominant Markets & Segments in APAC Plant Protein Ingredients Market
The APAC Plant Protein Ingredients Market is a dynamic and diverse landscape, with significant variations across regions and product categories. Southeast Asia, particularly countries like China, India, and Indonesia, is emerging as a dominant market due to its large population, increasing disposable incomes, and growing awareness of health and wellness trends. Pea protein holds a leading position within the Protein Type segment, driven by its versatility, allergen-friendly profile, and excellent nutritional value. However, soy protein continues to be a significant player due to its established presence and cost-effectiveness. The Food and Beverages end-user segment is the largest and fastest-growing, with the Meat/Poultry/Seafood and Meat Alternative Products sub-segment witnessing explosive growth as consumers seek sustainable alternatives. The Dairy and Dairy Alternative Products sub-segment is also experiencing substantial expansion, fueled by the rise of plant-based milk, yogurt, and cheese. The Supplements segment, particularly Sport/Performance Nutrition and Elderly Nutrition and Medical Nutrition, is another key area of growth, driven by the demand for convenient and effective nutritional solutions.
Dominant Regions & Countries:
- Southeast Asia: China, India, Indonesia, Vietnam
- East Asia: Japan, South Korea
- Oceania: Australia, New Zealand
- Key Drivers: Favorable economic policies promoting food innovation, robust infrastructure for ingredient sourcing and distribution, and a growing middle class with increasing purchasing power.
Dominant Protein Types:
- Pea Protein: High demand due to versatility, neutral taste, and allergen-friendly properties.
- Soy Protein: Established market presence, cost-effectiveness, and wide range of applications.
- Rice Protein: Growing popularity as an allergen-free alternative.
- Key Drivers: Nutritional profile, cost-competitiveness, functional properties (e.g., emulsification, gelling), and consumer acceptance.
Dominant End Users:
- Food and Beverages:
- Meat/Poultry/Seafood and Meat Alternative Products: Rapid growth driven by the plant-based meat revolution.
- Dairy and Dairy Alternative Products: Significant expansion due to the popularity of plant-based milks and yogurts.
- Bakery & Snacks: Increasing use for protein fortification and improved nutritional profiles.
- Supplements:
- Sport/Performance Nutrition: High demand for muscle building and recovery.
- Elderly Nutrition and Medical Nutrition: Growing need for easily digestible and nutrient-dense options.
- Key Drivers: Shifting consumer dietary habits, demand for healthier food options, focus on functional foods, and increasing awareness of protein's health benefits.
- Food and Beverages:
APAC Plant Protein Ingredients Market Product Developments
Product development in the APAC Plant Protein Ingredients Market is a continuous cycle of innovation, focusing on enhancing existing offerings and introducing novel solutions. Manufacturers are investing in advanced technologies to improve the solubility, emulsifying capabilities, and protein digestibility of their ingredients. Recent developments include the introduction of highly functional pea protein isolates with improved mouthfeel for plant-based dairy applications and the expansion of hemp protein powders with higher protein content and reduced grittiness for smoothies and bars. The market is also seeing a rise in blended plant protein formulations designed to offer a complete amino acid profile, catering to the growing demand for complete nutrition from plant sources. Competitive advantages are being gained through innovations that address specific consumer needs, such as allergen-free protein solutions and ingredients that contribute to the texture and appearance of meat alternatives.
Report Scope & Segmentation Analysis
This report meticulously analyzes the APAC Plant Protein Ingredients Market across key segments. The Protein Type segmentation includes Hemp Protein, Pea Protein, Potato Protein, Rice Protein, Soy Protein, Wheat Protein, and Other Plant Protein, each offering unique functionalities and market dynamics. The End User segmentation spans Animal Feed, Food and Beverages (further detailed by Bakery, Breakfast Cereals, Condiments/Sauces, Confectionery, Dairy and Dairy Alternative Products, Meat/Poultry/Seafood and Meat Alternative Products, RTE/RTC Food Products, Snacks), Personal Care and Cosmetics, and Supplements (including Baby Food and Infant Formula, Elderly Nutrition and Medical Nutrition, Sport/Performance Nutrition). Each segment is evaluated for its market size, growth projections, and competitive landscape, providing a granular understanding of market opportunities and challenges. The Food and Beverages segment is projected to dominate the market, driven by innovations in meat and dairy alternatives, with an estimated market size of over $20 billion by 2033. The Supplements segment is expected to grow at a CAGR of 14%, fueled by the increasing demand for sports nutrition and elderly care products.
Key Drivers of APAC Plant Protein Ingredients Market Growth
The APAC Plant Protein Ingredients Market is propelled by several potent growth drivers. Technological advancements in processing and extraction are yielding higher-quality and more functional plant protein ingredients, making them more attractive for diverse applications. The escalating global demand for sustainable and ethically sourced food products is a significant catalyst, as consumers become increasingly aware of the environmental impact of traditional animal agriculture. Furthermore, growing health consciousness and a rising prevalence of lifestyle diseases are encouraging consumers to adopt plant-based diets, which are perceived as healthier and more beneficial for disease prevention. Government initiatives in several APAC nations that promote healthy eating and support the development of the alternative protein industry also contribute to market expansion.
Challenges in the APAC Plant Protein Ingredients Market Sector
Despite its promising growth, the APAC Plant Protein Ingredients Market faces several challenges. Regulatory hurdles related to novel food ingredients and labeling requirements in certain countries can slow down market penetration. Supply chain complexities, including sourcing raw materials and ensuring consistent quality, can also pose difficulties for manufacturers. Price volatility of raw materials and the cost-competitiveness of plant-based proteins against traditional animal proteins remain a concern for widespread consumer adoption. Additionally, addressing off-flavors and undesirable textures in some plant protein ingredients continues to be an area of research and development to improve consumer acceptance.
Emerging Opportunities in APAC Plant Protein Ingredients Market
The APAC Plant Protein Ingredients Market presents a fertile ground for emerging opportunities. The expansion of plant-based meat and seafood alternatives is a significant trend, creating demand for innovative protein ingredients with superior texture and taste. The dairy-free and alternative milk market is also experiencing rapid growth, requiring specialized plant proteins for emulsification and mouthfeel. Opportunities exist in developing plant-based protein solutions for specialized dietary needs, such as those for infants, the elderly, and individuals with allergies. Furthermore, the untapped potential of novel protein sources like fungi, algae, and insect protein offers exciting avenues for future product development and market differentiation. The growing demand for functional ingredients that offer health benefits beyond basic nutrition also presents a significant opportunity.
Leading Players in the APAC Plant Protein Ingredients Market Market
- CHS Inc
- Nippn Corporation
- Shandong Jianyuan Bioengineering Co Ltd
- International Flavors & Fragrances Inc
- Tereos SCA
- Wilmar International Ltd
- Archer Daniels Midland Company
- Bunge Limited
- Fuji Oil Group
- Nagata Group
- Kerry Group PLC
- Südzucker AG
Key Developments in APAC Plant Protein Ingredients Market Industry
- May 2022: BENEO, a subsidiary of Südzucker, entered a purchase agreement to acquire Meatless BV, a producer of functional ingredients. BENEO is expanding its existing product offering with the acquisition to offer an even broader range of texturizing solutions for meat and fish alternatives.
- April 2021: ADM opened a new, cutting-edge plant-based innovation lab located in ADM’s Biopolis research hub in Singapore. The lab develops advanced products and customized solutions to meet the growing food and beverage demand in the Asia-Pacific region. The ADM Biopolis research hub in Singapore features a wide range of capabilities, including a food and flavor analytic lab, beverage and dairy applications lab and pilot plant, bakery and confectionery lab, meat and savory lab, sweet and savory creation lab, sensory evaluation facilities, customer innovation center, and a new plant-based innovation lab.
- April 2021: Bunge Limited has invested USD 45.7 million in Australian Plant Proteins (APP) to double the production of plant protein isolates in the country by March 2022. The ingredients manufactured by APP include fava bean isolate powder, yellow lentil isolate powder, and red lentil isolate powder.
Strategic Outlook for APAC Plant Protein Ingredients Market Market
The strategic outlook for the APAC Plant Protein Ingredients Market is overwhelmingly positive, driven by sustained consumer interest in health, sustainability, and ethical consumption. Key growth catalysts include continuous innovation in product development to improve taste, texture, and nutritional profiles, alongside strategic partnerships and acquisitions to expand market reach and technological capabilities. The increasing regulatory support for plant-based food innovation and the growing penetration of these products in mainstream markets will further fuel expansion. Companies that focus on offering diverse, high-quality, and sustainably produced plant protein ingredients tailored to evolving consumer preferences are poised for significant success in this dynamic and rapidly growing market. The market is expected to witness further consolidation and specialization, with a greater emphasis on niche applications and value-added products.
APAC Plant Protein Ingredients Market Segmentation
-
1. Protein Type
- 1.1. Hemp Protein
- 1.2. Pea Protein
- 1.3. Potato Protein
- 1.4. Rice Protein
- 1.5. Soy Protein
- 1.6. Wheat Protein
- 1.7. Other Plant Protein
-
2. End User
- 2.1. Animal Feed
-
2.2. Food and Beverages
-
2.2.1. By Sub End User
- 2.2.1.1. Bakery
- 2.2.1.2. Breakfast Cereals
- 2.2.1.3. Condiments/Sauces
- 2.2.1.4. Confectionery
- 2.2.1.5. Dairy and Dairy Alternative Products
- 2.2.1.6. Meat/Poultry/Seafood and Meat Alternative Products
- 2.2.1.7. RTE/RTC Food Products
- 2.2.1.8. Snacks
-
2.2.1. By Sub End User
- 2.3. Personal Care and Cosmetics
-
2.4. Supplements
- 2.4.1. Baby Food and Infant Formula
- 2.4.2. Elderly Nutrition and Medical Nutrition
- 2.4.3. Sport/Performance Nutrition
APAC Plant Protein Ingredients Market Segmentation By Geography
-
1. North America
- 1.1. United States
- 1.2. Canada
- 1.3. Mexico
-
2. South America
- 2.1. Brazil
- 2.2. Argentina
- 2.3. Rest of South America
-
3. Europe
- 3.1. United Kingdom
- 3.2. Germany
- 3.3. France
- 3.4. Italy
- 3.5. Spain
- 3.6. Russia
- 3.7. Benelux
- 3.8. Nordics
- 3.9. Rest of Europe
-
4. Middle East & Africa
- 4.1. Turkey
- 4.2. Israel
- 4.3. GCC
- 4.4. North Africa
- 4.5. South Africa
- 4.6. Rest of Middle East & Africa
-
5. Asia Pacific
- 5.1. China
- 5.2. India
- 5.3. Japan
- 5.4. South Korea
- 5.5. ASEAN
- 5.6. Oceania
- 5.7. Rest of Asia Pacific
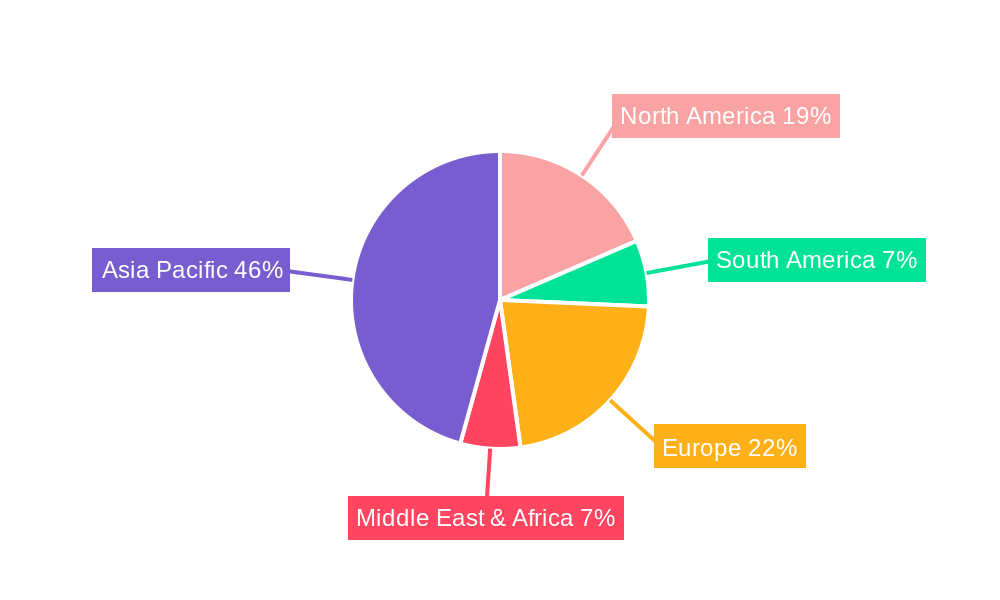
APAC Plant Protein Ingredients Market Regional Market Share
Geographic Coverage of APAC Plant Protein Ingredients Market
APAC Plant Protein Ingredients Market REPORT HIGHLIGHTS
| Aspects | Details |
|---|---|
| Study Period | 2020-2034 |
| Base Year | 2025 |
| Estimated Year | 2026 |
| Forecast Period | 2026-2034 |
| Historical Period | 2020-2025 |
| Growth Rate | CAGR of 5.8% from 2020-2034 |
| Segmentation |
|
Table of Contents
- 1. Introduction
- 1.1. Research Scope
- 1.2. Market Segmentation
- 1.3. Research Objective
- 1.4. Definitions and Assumptions
- 2. Executive Summary
- 2.1. Market Snapshot
- 3. Market Dynamics
- 3.1. Market Drivers
- 3.2. Market Restrains
- 3.3. Market Trends
- 3.4. Market Opportunities
- 4. Market Factor Analysis
- 4.1. Porters Five Forces
- 4.1.1. Bargaining Power of Suppliers
- 4.1.2. Bargaining Power of Buyers
- 4.1.3. Threat of New Entrants
- 4.1.4. Threat of Substitutes
- 4.1.5. Competitive Rivalry
- 4.2. PESTEL analysis
- 4.3. BCG Analysis
- 4.3.1. Stars (High Growth, High Market Share)
- 4.3.2. Cash Cows (Low Growth, High Market Share)
- 4.3.3. Question Mark (High Growth, Low Market Share)
- 4.3.4. Dogs (Low Growth, Low Market Share)
- 4.4. Ansoff Matrix Analysis
- 4.5. Supply Chain Analysis
- 4.6. Regulatory Landscape
- 4.7. Current Market Potential and Opportunity Assessment (TAM–SAM–SOM Framework)
- 4.8. RAX Analyst Note
- 4.1. Porters Five Forces
- 5. Market Analysis, Insights and Forecast 2021-2033
- 5.1. Market Analysis, Insights and Forecast - by Protein Type
- 5.1.1. Hemp Protein
- 5.1.2. Pea Protein
- 5.1.3. Potato Protein
- 5.1.4. Rice Protein
- 5.1.5. Soy Protein
- 5.1.6. Wheat Protein
- 5.1.7. Other Plant Protein
- 5.2. Market Analysis, Insights and Forecast - by End User
- 5.2.1. Animal Feed
- 5.2.2. Food and Beverages
- 5.2.2.1. By Sub End User
- 5.2.2.1.1. Bakery
- 5.2.2.1.2. Breakfast Cereals
- 5.2.2.1.3. Condiments/Sauces
- 5.2.2.1.4. Confectionery
- 5.2.2.1.5. Dairy and Dairy Alternative Products
- 5.2.2.1.6. Meat/Poultry/Seafood and Meat Alternative Products
- 5.2.2.1.7. RTE/RTC Food Products
- 5.2.2.1.8. Snacks
- 5.2.2.1. By Sub End User
- 5.2.3. Personal Care and Cosmetics
- 5.2.4. Supplements
- 5.2.4.1. Baby Food and Infant Formula
- 5.2.4.2. Elderly Nutrition and Medical Nutrition
- 5.2.4.3. Sport/Performance Nutrition
- 5.3. Market Analysis, Insights and Forecast - by Region
- 5.3.1. North America
- 5.3.2. South America
- 5.3.3. Europe
- 5.3.4. Middle East & Africa
- 5.3.5. Asia Pacific
- 5.1. Market Analysis, Insights and Forecast - by Protein Type
- 6. Global APAC Plant Protein Ingredients Market Analysis, Insights and Forecast, 2021-2033
- 6.1. Market Analysis, Insights and Forecast - by Protein Type
- 6.1.1. Hemp Protein
- 6.1.2. Pea Protein
- 6.1.3. Potato Protein
- 6.1.4. Rice Protein
- 6.1.5. Soy Protein
- 6.1.6. Wheat Protein
- 6.1.7. Other Plant Protein
- 6.2. Market Analysis, Insights and Forecast - by End User
- 6.2.1. Animal Feed
- 6.2.2. Food and Beverages
- 6.2.2.1. By Sub End User
- 6.2.2.1.1. Bakery
- 6.2.2.1.2. Breakfast Cereals
- 6.2.2.1.3. Condiments/Sauces
- 6.2.2.1.4. Confectionery
- 6.2.2.1.5. Dairy and Dairy Alternative Products
- 6.2.2.1.6. Meat/Poultry/Seafood and Meat Alternative Products
- 6.2.2.1.7. RTE/RTC Food Products
- 6.2.2.1.8. Snacks
- 6.2.2.1. By Sub End User
- 6.2.3. Personal Care and Cosmetics
- 6.2.4. Supplements
- 6.2.4.1. Baby Food and Infant Formula
- 6.2.4.2. Elderly Nutrition and Medical Nutrition
- 6.2.4.3. Sport/Performance Nutrition
- 6.1. Market Analysis, Insights and Forecast - by Protein Type
- 7. North America APAC Plant Protein Ingredients Market Analysis, Insights and Forecast, 2020-2032
- 7.1. Market Analysis, Insights and Forecast - by Protein Type
- 7.1.1. Hemp Protein
- 7.1.2. Pea Protein
- 7.1.3. Potato Protein
- 7.1.4. Rice Protein
- 7.1.5. Soy Protein
- 7.1.6. Wheat Protein
- 7.1.7. Other Plant Protein
- 7.2. Market Analysis, Insights and Forecast - by End User
- 7.2.1. Animal Feed
- 7.2.2. Food and Beverages
- 7.2.2.1. By Sub End User
- 7.2.2.1.1. Bakery
- 7.2.2.1.2. Breakfast Cereals
- 7.2.2.1.3. Condiments/Sauces
- 7.2.2.1.4. Confectionery
- 7.2.2.1.5. Dairy and Dairy Alternative Products
- 7.2.2.1.6. Meat/Poultry/Seafood and Meat Alternative Products
- 7.2.2.1.7. RTE/RTC Food Products
- 7.2.2.1.8. Snacks
- 7.2.2.1. By Sub End User
- 7.2.3. Personal Care and Cosmetics
- 7.2.4. Supplements
- 7.2.4.1. Baby Food and Infant Formula
- 7.2.4.2. Elderly Nutrition and Medical Nutrition
- 7.2.4.3. Sport/Performance Nutrition
- 7.1. Market Analysis, Insights and Forecast - by Protein Type
- 8. South America APAC Plant Protein Ingredients Market Analysis, Insights and Forecast, 2020-2032
- 8.1. Market Analysis, Insights and Forecast - by Protein Type
- 8.1.1. Hemp Protein
- 8.1.2. Pea Protein
- 8.1.3. Potato Protein
- 8.1.4. Rice Protein
- 8.1.5. Soy Protein
- 8.1.6. Wheat Protein
- 8.1.7. Other Plant Protein
- 8.2. Market Analysis, Insights and Forecast - by End User
- 8.2.1. Animal Feed
- 8.2.2. Food and Beverages
- 8.2.2.1. By Sub End User
- 8.2.2.1.1. Bakery
- 8.2.2.1.2. Breakfast Cereals
- 8.2.2.1.3. Condiments/Sauces
- 8.2.2.1.4. Confectionery
- 8.2.2.1.5. Dairy and Dairy Alternative Products
- 8.2.2.1.6. Meat/Poultry/Seafood and Meat Alternative Products
- 8.2.2.1.7. RTE/RTC Food Products
- 8.2.2.1.8. Snacks
- 8.2.2.1. By Sub End User
- 8.2.3. Personal Care and Cosmetics
- 8.2.4. Supplements
- 8.2.4.1. Baby Food and Infant Formula
- 8.2.4.2. Elderly Nutrition and Medical Nutrition
- 8.2.4.3. Sport/Performance Nutrition
- 8.1. Market Analysis, Insights and Forecast - by Protein Type
- 9. Europe APAC Plant Protein Ingredients Market Analysis, Insights and Forecast, 2020-2032
- 9.1. Market Analysis, Insights and Forecast - by Protein Type
- 9.1.1. Hemp Protein
- 9.1.2. Pea Protein
- 9.1.3. Potato Protein
- 9.1.4. Rice Protein
- 9.1.5. Soy Protein
- 9.1.6. Wheat Protein
- 9.1.7. Other Plant Protein
- 9.2. Market Analysis, Insights and Forecast - by End User
- 9.2.1. Animal Feed
- 9.2.2. Food and Beverages
- 9.2.2.1. By Sub End User
- 9.2.2.1.1. Bakery
- 9.2.2.1.2. Breakfast Cereals
- 9.2.2.1.3. Condiments/Sauces
- 9.2.2.1.4. Confectionery
- 9.2.2.1.5. Dairy and Dairy Alternative Products
- 9.2.2.1.6. Meat/Poultry/Seafood and Meat Alternative Products
- 9.2.2.1.7. RTE/RTC Food Products
- 9.2.2.1.8. Snacks
- 9.2.2.1. By Sub End User
- 9.2.3. Personal Care and Cosmetics
- 9.2.4. Supplements
- 9.2.4.1. Baby Food and Infant Formula
- 9.2.4.2. Elderly Nutrition and Medical Nutrition
- 9.2.4.3. Sport/Performance Nutrition
- 9.1. Market Analysis, Insights and Forecast - by Protein Type
- 10. Middle East & Africa APAC Plant Protein Ingredients Market Analysis, Insights and Forecast, 2020-2032
- 10.1. Market Analysis, Insights and Forecast - by Protein Type
- 10.1.1. Hemp Protein
- 10.1.2. Pea Protein
- 10.1.3. Potato Protein
- 10.1.4. Rice Protein
- 10.1.5. Soy Protein
- 10.1.6. Wheat Protein
- 10.1.7. Other Plant Protein
- 10.2. Market Analysis, Insights and Forecast - by End User
- 10.2.1. Animal Feed
- 10.2.2. Food and Beverages
- 10.2.2.1. By Sub End User
- 10.2.2.1.1. Bakery
- 10.2.2.1.2. Breakfast Cereals
- 10.2.2.1.3. Condiments/Sauces
- 10.2.2.1.4. Confectionery
- 10.2.2.1.5. Dairy and Dairy Alternative Products
- 10.2.2.1.6. Meat/Poultry/Seafood and Meat Alternative Products
- 10.2.2.1.7. RTE/RTC Food Products
- 10.2.2.1.8. Snacks
- 10.2.2.1. By Sub End User
- 10.2.3. Personal Care and Cosmetics
- 10.2.4. Supplements
- 10.2.4.1. Baby Food and Infant Formula
- 10.2.4.2. Elderly Nutrition and Medical Nutrition
- 10.2.4.3. Sport/Performance Nutrition
- 10.1. Market Analysis, Insights and Forecast - by Protein Type
- 11. Asia Pacific APAC Plant Protein Ingredients Market Analysis, Insights and Forecast, 2020-2032
- 11.1. Market Analysis, Insights and Forecast - by Protein Type
- 11.1.1. Hemp Protein
- 11.1.2. Pea Protein
- 11.1.3. Potato Protein
- 11.1.4. Rice Protein
- 11.1.5. Soy Protein
- 11.1.6. Wheat Protein
- 11.1.7. Other Plant Protein
- 11.2. Market Analysis, Insights and Forecast - by End User
- 11.2.1. Animal Feed
- 11.2.2. Food and Beverages
- 11.2.2.1. By Sub End User
- 11.2.2.1.1. Bakery
- 11.2.2.1.2. Breakfast Cereals
- 11.2.2.1.3. Condiments/Sauces
- 11.2.2.1.4. Confectionery
- 11.2.2.1.5. Dairy and Dairy Alternative Products
- 11.2.2.1.6. Meat/Poultry/Seafood and Meat Alternative Products
- 11.2.2.1.7. RTE/RTC Food Products
- 11.2.2.1.8. Snacks
- 11.2.2.1. By Sub End User
- 11.2.3. Personal Care and Cosmetics
- 11.2.4. Supplements
- 11.2.4.1. Baby Food and Infant Formula
- 11.2.4.2. Elderly Nutrition and Medical Nutrition
- 11.2.4.3. Sport/Performance Nutrition
- 11.1. Market Analysis, Insights and Forecast - by Protein Type
- 12. Competitive Analysis
- 12.1. Company Profiles
- 12.1.1 CHS Inc
- 12.1.1.1. Company Overview
- 12.1.1.2. Products
- 12.1.1.3. Company Financials
- 12.1.1.4. SWOT Analysis
- 12.1.2 Nippn Corporation
- 12.1.2.1. Company Overview
- 12.1.2.2. Products
- 12.1.2.3. Company Financials
- 12.1.2.4. SWOT Analysis
- 12.1.3 Shandong Jianyuan Bioengineering Co Ltd
- 12.1.3.1. Company Overview
- 12.1.3.2. Products
- 12.1.3.3. Company Financials
- 12.1.3.4. SWOT Analysis
- 12.1.4 International Flavors & Fragrances Inc
- 12.1.4.1. Company Overview
- 12.1.4.2. Products
- 12.1.4.3. Company Financials
- 12.1.4.4. SWOT Analysis
- 12.1.5 Tereos SCA
- 12.1.5.1. Company Overview
- 12.1.5.2. Products
- 12.1.5.3. Company Financials
- 12.1.5.4. SWOT Analysis
- 12.1.6 Wilmar International Lt
- 12.1.6.1. Company Overview
- 12.1.6.2. Products
- 12.1.6.3. Company Financials
- 12.1.6.4. SWOT Analysis
- 12.1.7 Archer Daniels Midland Company
- 12.1.7.1. Company Overview
- 12.1.7.2. Products
- 12.1.7.3. Company Financials
- 12.1.7.4. SWOT Analysis
- 12.1.8 Bunge Limited
- 12.1.8.1. Company Overview
- 12.1.8.2. Products
- 12.1.8.3. Company Financials
- 12.1.8.4. SWOT Analysis
- 12.1.9 Fuji Oil Group
- 12.1.9.1. Company Overview
- 12.1.9.2. Products
- 12.1.9.3. Company Financials
- 12.1.9.4. SWOT Analysis
- 12.1.10 Nagata Group
- 12.1.10.1. Company Overview
- 12.1.10.2. Products
- 12.1.10.3. Company Financials
- 12.1.10.4. SWOT Analysis
- 12.1.11 Kerry Group PLC
- 12.1.11.1. Company Overview
- 12.1.11.2. Products
- 12.1.11.3. Company Financials
- 12.1.11.4. SWOT Analysis
- 12.1.12 Südzucker AG
- 12.1.12.1. Company Overview
- 12.1.12.2. Products
- 12.1.12.3. Company Financials
- 12.1.12.4. SWOT Analysis
- 12.1.1 CHS Inc
- 12.2. Market Entropy
- 12.2.1 Company's Key Areas Served
- 12.2.2 Recent Developments
- 12.3. Company Market Share Analysis 2025
- 12.3.1 Top 5 Companies Market Share Analysis
- 12.3.2 Top 3 Companies Market Share Analysis
- 12.4. List of Potential Customers
- 13. Research Methodology
List of Figures
- Figure 1: Global APAC Plant Protein Ingredients Market Revenue Breakdown (billion, %) by Region 2025 & 2033
- Figure 2: Global APAC Plant Protein Ingredients Market Volume Breakdown (K Tons, %) by Region 2025 & 2033
- Figure 3: North America APAC Plant Protein Ingredients Market Revenue (billion), by Protein Type 2025 & 2033
- Figure 4: North America APAC Plant Protein Ingredients Market Volume (K Tons), by Protein Type 2025 & 2033
- Figure 5: North America APAC Plant Protein Ingredients Market Revenue Share (%), by Protein Type 2025 & 2033
- Figure 6: North America APAC Plant Protein Ingredients Market Volume Share (%), by Protein Type 2025 & 2033
- Figure 7: North America APAC Plant Protein Ingredients Market Revenue (billion), by End User 2025 & 2033
- Figure 8: North America APAC Plant Protein Ingredients Market Volume (K Tons), by End User 2025 & 2033
- Figure 9: North America APAC Plant Protein Ingredients Market Revenue Share (%), by End User 2025 & 2033
- Figure 10: North America APAC Plant Protein Ingredients Market Volume Share (%), by End User 2025 & 2033
- Figure 11: North America APAC Plant Protein Ingredients Market Revenue (billion), by Country 2025 & 2033
- Figure 12: North America APAC Plant Protein Ingredients Market Volume (K Tons), by Country 2025 & 2033
- Figure 13: North America APAC Plant Protein Ingredients Market Revenue Share (%), by Country 2025 & 2033
- Figure 14: North America APAC Plant Protein Ingredients Market Volume Share (%), by Country 2025 & 2033
- Figure 15: South America APAC Plant Protein Ingredients Market Revenue (billion), by Protein Type 2025 & 2033
- Figure 16: South America APAC Plant Protein Ingredients Market Volume (K Tons), by Protein Type 2025 & 2033
- Figure 17: South America APAC Plant Protein Ingredients Market Revenue Share (%), by Protein Type 2025 & 2033
- Figure 18: South America APAC Plant Protein Ingredients Market Volume Share (%), by Protein Type 2025 & 2033
- Figure 19: South America APAC Plant Protein Ingredients Market Revenue (billion), by End User 2025 & 2033
- Figure 20: South America APAC Plant Protein Ingredients Market Volume (K Tons), by End User 2025 & 2033
- Figure 21: South America APAC Plant Protein Ingredients Market Revenue Share (%), by End User 2025 & 2033
- Figure 22: South America APAC Plant Protein Ingredients Market Volume Share (%), by End User 2025 & 2033
- Figure 23: South America APAC Plant Protein Ingredients Market Revenue (billion), by Country 2025 & 2033
- Figure 24: South America APAC Plant Protein Ingredients Market Volume (K Tons), by Country 2025 & 2033
- Figure 25: South America APAC Plant Protein Ingredients Market Revenue Share (%), by Country 2025 & 2033
- Figure 26: South America APAC Plant Protein Ingredients Market Volume Share (%), by Country 2025 & 2033
- Figure 27: Europe APAC Plant Protein Ingredients Market Revenue (billion), by Protein Type 2025 & 2033
- Figure 28: Europe APAC Plant Protein Ingredients Market Volume (K Tons), by Protein Type 2025 & 2033
- Figure 29: Europe APAC Plant Protein Ingredients Market Revenue Share (%), by Protein Type 2025 & 2033
- Figure 30: Europe APAC Plant Protein Ingredients Market Volume Share (%), by Protein Type 2025 & 2033
- Figure 31: Europe APAC Plant Protein Ingredients Market Revenue (billion), by End User 2025 & 2033
- Figure 32: Europe APAC Plant Protein Ingredients Market Volume (K Tons), by End User 2025 & 2033
- Figure 33: Europe APAC Plant Protein Ingredients Market Revenue Share (%), by End User 2025 & 2033
- Figure 34: Europe APAC Plant Protein Ingredients Market Volume Share (%), by End User 2025 & 2033
- Figure 35: Europe APAC Plant Protein Ingredients Market Revenue (billion), by Country 2025 & 2033
- Figure 36: Europe APAC Plant Protein Ingredients Market Volume (K Tons), by Country 2025 & 2033
- Figure 37: Europe APAC Plant Protein Ingredients Market Revenue Share (%), by Country 2025 & 2033
- Figure 38: Europe APAC Plant Protein Ingredients Market Volume Share (%), by Country 2025 & 2033
- Figure 39: Middle East & Africa APAC Plant Protein Ingredients Market Revenue (billion), by Protein Type 2025 & 2033
- Figure 40: Middle East & Africa APAC Plant Protein Ingredients Market Volume (K Tons), by Protein Type 2025 & 2033
- Figure 41: Middle East & Africa APAC Plant Protein Ingredients Market Revenue Share (%), by Protein Type 2025 & 2033
- Figure 42: Middle East & Africa APAC Plant Protein Ingredients Market Volume Share (%), by Protein Type 2025 & 2033
- Figure 43: Middle East & Africa APAC Plant Protein Ingredients Market Revenue (billion), by End User 2025 & 2033
- Figure 44: Middle East & Africa APAC Plant Protein Ingredients Market Volume (K Tons), by End User 2025 & 2033
- Figure 45: Middle East & Africa APAC Plant Protein Ingredients Market Revenue Share (%), by End User 2025 & 2033
- Figure 46: Middle East & Africa APAC Plant Protein Ingredients Market Volume Share (%), by End User 2025 & 2033
- Figure 47: Middle East & Africa APAC Plant Protein Ingredients Market Revenue (billion), by Country 2025 & 2033
- Figure 48: Middle East & Africa APAC Plant Protein Ingredients Market Volume (K Tons), by Country 2025 & 2033
- Figure 49: Middle East & Africa APAC Plant Protein Ingredients Market Revenue Share (%), by Country 2025 & 2033
- Figure 50: Middle East & Africa APAC Plant Protein Ingredients Market Volume Share (%), by Country 2025 & 2033
- Figure 51: Asia Pacific APAC Plant Protein Ingredients Market Revenue (billion), by Protein Type 2025 & 2033
- Figure 52: Asia Pacific APAC Plant Protein Ingredients Market Volume (K Tons), by Protein Type 2025 & 2033
- Figure 53: Asia Pacific APAC Plant Protein Ingredients Market Revenue Share (%), by Protein Type 2025 & 2033
- Figure 54: Asia Pacific APAC Plant Protein Ingredients Market Volume Share (%), by Protein Type 2025 & 2033
- Figure 55: Asia Pacific APAC Plant Protein Ingredients Market Revenue (billion), by End User 2025 & 2033
- Figure 56: Asia Pacific APAC Plant Protein Ingredients Market Volume (K Tons), by End User 2025 & 2033
- Figure 57: Asia Pacific APAC Plant Protein Ingredients Market Revenue Share (%), by End User 2025 & 2033
- Figure 58: Asia Pacific APAC Plant Protein Ingredients Market Volume Share (%), by End User 2025 & 2033
- Figure 59: Asia Pacific APAC Plant Protein Ingredients Market Revenue (billion), by Country 2025 & 2033
- Figure 60: Asia Pacific APAC Plant Protein Ingredients Market Volume (K Tons), by Country 2025 & 2033
- Figure 61: Asia Pacific APAC Plant Protein Ingredients Market Revenue Share (%), by Country 2025 & 2033
- Figure 62: Asia Pacific APAC Plant Protein Ingredients Market Volume Share (%), by Country 2025 & 2033
List of Tables
- Table 1: Global APAC Plant Protein Ingredients Market Revenue billion Forecast, by Protein Type 2020 & 2033
- Table 2: Global APAC Plant Protein Ingredients Market Volume K Tons Forecast, by Protein Type 2020 & 2033
- Table 3: Global APAC Plant Protein Ingredients Market Revenue billion Forecast, by End User 2020 & 2033
- Table 4: Global APAC Plant Protein Ingredients Market Volume K Tons Forecast, by End User 2020 & 2033
- Table 5: Global APAC Plant Protein Ingredients Market Revenue billion Forecast, by Region 2020 & 2033
- Table 6: Global APAC Plant Protein Ingredients Market Volume K Tons Forecast, by Region 2020 & 2033
- Table 7: Global APAC Plant Protein Ingredients Market Revenue billion Forecast, by Protein Type 2020 & 2033
- Table 8: Global APAC Plant Protein Ingredients Market Volume K Tons Forecast, by Protein Type 2020 & 2033
- Table 9: Global APAC Plant Protein Ingredients Market Revenue billion Forecast, by End User 2020 & 2033
- Table 10: Global APAC Plant Protein Ingredients Market Volume K Tons Forecast, by End User 2020 & 2033
- Table 11: Global APAC Plant Protein Ingredients Market Revenue billion Forecast, by Country 2020 & 2033
- Table 12: Global APAC Plant Protein Ingredients Market Volume K Tons Forecast, by Country 2020 & 2033
- Table 13: United States APAC Plant Protein Ingredients Market Revenue (billion) Forecast, by Application 2020 & 2033
- Table 14: United States APAC Plant Protein Ingredients Market Volume (K Tons) Forecast, by Application 2020 & 2033
- Table 15: Canada APAC Plant Protein Ingredients Market Revenue (billion) Forecast, by Application 2020 & 2033
- Table 16: Canada APAC Plant Protein Ingredients Market Volume (K Tons) Forecast, by Application 2020 & 2033
- Table 17: Mexico APAC Plant Protein Ingredients Market Revenue (billion) Forecast, by Application 2020 & 2033
- Table 18: Mexico APAC Plant Protein Ingredients Market Volume (K Tons) Forecast, by Application 2020 & 2033
- Table 19: Global APAC Plant Protein Ingredients Market Revenue billion Forecast, by Protein Type 2020 & 2033
- Table 20: Global APAC Plant Protein Ingredients Market Volume K Tons Forecast, by Protein Type 2020 & 2033
- Table 21: Global APAC Plant Protein Ingredients Market Revenue billion Forecast, by End User 2020 & 2033
- Table 22: Global APAC Plant Protein Ingredients Market Volume K Tons Forecast, by End User 2020 & 2033
- Table 23: Global APAC Plant Protein Ingredients Market Revenue billion Forecast, by Country 2020 & 2033
- Table 24: Global APAC Plant Protein Ingredients Market Volume K Tons Forecast, by Country 2020 & 2033
- Table 25: Brazil APAC Plant Protein Ingredients Market Revenue (billion) Forecast, by Application 2020 & 2033
- Table 26: Brazil APAC Plant Protein Ingredients Market Volume (K Tons) Forecast, by Application 2020 & 2033
- Table 27: Argentina APAC Plant Protein Ingredients Market Revenue (billion) Forecast, by Application 2020 & 2033
- Table 28: Argentina APAC Plant Protein Ingredients Market Volume (K Tons) Forecast, by Application 2020 & 2033
- Table 29: Rest of South America APAC Plant Protein Ingredients Market Revenue (billion) Forecast, by Application 2020 & 2033
- Table 30: Rest of South America APAC Plant Protein Ingredients Market Volume (K Tons) Forecast, by Application 2020 & 2033
- Table 31: Global APAC Plant Protein Ingredients Market Revenue billion Forecast, by Protein Type 2020 & 2033
- Table 32: Global APAC Plant Protein Ingredients Market Volume K Tons Forecast, by Protein Type 2020 & 2033
- Table 33: Global APAC Plant Protein Ingredients Market Revenue billion Forecast, by End User 2020 & 2033
- Table 34: Global APAC Plant Protein Ingredients Market Volume K Tons Forecast, by End User 2020 & 2033
- Table 35: Global APAC Plant Protein Ingredients Market Revenue billion Forecast, by Country 2020 & 2033
- Table 36: Global APAC Plant Protein Ingredients Market Volume K Tons Forecast, by Country 2020 & 2033
- Table 37: United Kingdom APAC Plant Protein Ingredients Market Revenue (billion) Forecast, by Application 2020 & 2033
- Table 38: United Kingdom APAC Plant Protein Ingredients Market Volume (K Tons) Forecast, by Application 2020 & 2033
- Table 39: Germany APAC Plant Protein Ingredients Market Revenue (billion) Forecast, by Application 2020 & 2033
- Table 40: Germany APAC Plant Protein Ingredients Market Volume (K Tons) Forecast, by Application 2020 & 2033
- Table 41: France APAC Plant Protein Ingredients Market Revenue (billion) Forecast, by Application 2020 & 2033
- Table 42: France APAC Plant Protein Ingredients Market Volume (K Tons) Forecast, by Application 2020 & 2033
- Table 43: Italy APAC Plant Protein Ingredients Market Revenue (billion) Forecast, by Application 2020 & 2033
- Table 44: Italy APAC Plant Protein Ingredients Market Volume (K Tons) Forecast, by Application 2020 & 2033
- Table 45: Spain APAC Plant Protein Ingredients Market Revenue (billion) Forecast, by Application 2020 & 2033
- Table 46: Spain APAC Plant Protein Ingredients Market Volume (K Tons) Forecast, by Application 2020 & 2033
- Table 47: Russia APAC Plant Protein Ingredients Market Revenue (billion) Forecast, by Application 2020 & 2033
- Table 48: Russia APAC Plant Protein Ingredients Market Volume (K Tons) Forecast, by Application 2020 & 2033
- Table 49: Benelux APAC Plant Protein Ingredients Market Revenue (billion) Forecast, by Application 2020 & 2033
- Table 50: Benelux APAC Plant Protein Ingredients Market Volume (K Tons) Forecast, by Application 2020 & 2033
- Table 51: Nordics APAC Plant Protein Ingredients Market Revenue (billion) Forecast, by Application 2020 & 2033
- Table 52: Nordics APAC Plant Protein Ingredients Market Volume (K Tons) Forecast, by Application 2020 & 2033
- Table 53: Rest of Europe APAC Plant Protein Ingredients Market Revenue (billion) Forecast, by Application 2020 & 2033
- Table 54: Rest of Europe APAC Plant Protein Ingredients Market Volume (K Tons) Forecast, by Application 2020 & 2033
- Table 55: Global APAC Plant Protein Ingredients Market Revenue billion Forecast, by Protein Type 2020 & 2033
- Table 56: Global APAC Plant Protein Ingredients Market Volume K Tons Forecast, by Protein Type 2020 & 2033
- Table 57: Global APAC Plant Protein Ingredients Market Revenue billion Forecast, by End User 2020 & 2033
- Table 58: Global APAC Plant Protein Ingredients Market Volume K Tons Forecast, by End User 2020 & 2033
- Table 59: Global APAC Plant Protein Ingredients Market Revenue billion Forecast, by Country 2020 & 2033
- Table 60: Global APAC Plant Protein Ingredients Market Volume K Tons Forecast, by Country 2020 & 2033
- Table 61: Turkey APAC Plant Protein Ingredients Market Revenue (billion) Forecast, by Application 2020 & 2033
- Table 62: Turkey APAC Plant Protein Ingredients Market Volume (K Tons) Forecast, by Application 2020 & 2033
- Table 63: Israel APAC Plant Protein Ingredients Market Revenue (billion) Forecast, by Application 2020 & 2033
- Table 64: Israel APAC Plant Protein Ingredients Market Volume (K Tons) Forecast, by Application 2020 & 2033
- Table 65: GCC APAC Plant Protein Ingredients Market Revenue (billion) Forecast, by Application 2020 & 2033
- Table 66: GCC APAC Plant Protein Ingredients Market Volume (K Tons) Forecast, by Application 2020 & 2033
- Table 67: North Africa APAC Plant Protein Ingredients Market Revenue (billion) Forecast, by Application 2020 & 2033
- Table 68: North Africa APAC Plant Protein Ingredients Market Volume (K Tons) Forecast, by Application 2020 & 2033
- Table 69: South Africa APAC Plant Protein Ingredients Market Revenue (billion) Forecast, by Application 2020 & 2033
- Table 70: South Africa APAC Plant Protein Ingredients Market Volume (K Tons) Forecast, by Application 2020 & 2033
- Table 71: Rest of Middle East & Africa APAC Plant Protein Ingredients Market Revenue (billion) Forecast, by Application 2020 & 2033
- Table 72: Rest of Middle East & Africa APAC Plant Protein Ingredients Market Volume (K Tons) Forecast, by Application 2020 & 2033
- Table 73: Global APAC Plant Protein Ingredients Market Revenue billion Forecast, by Protein Type 2020 & 2033
- Table 74: Global APAC Plant Protein Ingredients Market Volume K Tons Forecast, by Protein Type 2020 & 2033
- Table 75: Global APAC Plant Protein Ingredients Market Revenue billion Forecast, by End User 2020 & 2033
- Table 76: Global APAC Plant Protein Ingredients Market Volume K Tons Forecast, by End User 2020 & 2033
- Table 77: Global APAC Plant Protein Ingredients Market Revenue billion Forecast, by Country 2020 & 2033
- Table 78: Global APAC Plant Protein Ingredients Market Volume K Tons Forecast, by Country 2020 & 2033
- Table 79: China APAC Plant Protein Ingredients Market Revenue (billion) Forecast, by Application 2020 & 2033
- Table 80: China APAC Plant Protein Ingredients Market Volume (K Tons) Forecast, by Application 2020 & 2033
- Table 81: India APAC Plant Protein Ingredients Market Revenue (billion) Forecast, by Application 2020 & 2033
- Table 82: India APAC Plant Protein Ingredients Market Volume (K Tons) Forecast, by Application 2020 & 2033
- Table 83: Japan APAC Plant Protein Ingredients Market Revenue (billion) Forecast, by Application 2020 & 2033
- Table 84: Japan APAC Plant Protein Ingredients Market Volume (K Tons) Forecast, by Application 2020 & 2033
- Table 85: South Korea APAC Plant Protein Ingredients Market Revenue (billion) Forecast, by Application 2020 & 2033
- Table 86: South Korea APAC Plant Protein Ingredients Market Volume (K Tons) Forecast, by Application 2020 & 2033
- Table 87: ASEAN APAC Plant Protein Ingredients Market Revenue (billion) Forecast, by Application 2020 & 2033
- Table 88: ASEAN APAC Plant Protein Ingredients Market Volume (K Tons) Forecast, by Application 2020 & 2033
- Table 89: Oceania APAC Plant Protein Ingredients Market Revenue (billion) Forecast, by Application 2020 & 2033
- Table 90: Oceania APAC Plant Protein Ingredients Market Volume (K Tons) Forecast, by Application 2020 & 2033
- Table 91: Rest of Asia Pacific APAC Plant Protein Ingredients Market Revenue (billion) Forecast, by Application 2020 & 2033
- Table 92: Rest of Asia Pacific APAC Plant Protein Ingredients Market Volume (K Tons) Forecast, by Application 2020 & 2033
Frequently Asked Questions
1. What is the projected Compound Annual Growth Rate (CAGR) of the APAC Plant Protein Ingredients Market?
The projected CAGR is approximately 5.8%.
2. Which companies are prominent players in the APAC Plant Protein Ingredients Market?
Key companies in the market include CHS Inc, Nippn Corporation, Shandong Jianyuan Bioengineering Co Ltd, International Flavors & Fragrances Inc, Tereos SCA, Wilmar International Lt, Archer Daniels Midland Company, Bunge Limited, Fuji Oil Group, Nagata Group, Kerry Group PLC, Südzucker AG.
3. What are the main segments of the APAC Plant Protein Ingredients Market?
The market segments include Protein Type, End User.
4. Can you provide details about the market size?
The market size is estimated to be USD 64.56 billion as of 2022.
5. What are some drivers contributing to market growth?
Increasing Demand for Organic Plant Proteins; Increasing Application of Pea Protein in Food and Beverages.
6. What are the notable trends driving market growth?
OTHER KEY INDUSTRY TRENDS COVERED IN THE REPORT.
7. Are there any restraints impacting market growth?
Presence of Alternative protein sources.
8. Can you provide examples of recent developments in the market?
May 2022: BENEO, a subsidiary of Südzucker, entered a purchase agreement to acquire Meatless BV, a producer of functional ingredients. BENEO is expanding its existing product offering with the acquisition to offer an even broader range of texturizing solutions for meat and fish alternatives.April 2021: ADM opened a new, cutting-edge plant-based innovation lab located in ADM’s Biopolis research hub in Singapore. The lab develops advanced products and customized solutions to meet the growing food and beverage demand in the Asia-Pacific region. The ADM Biopolis research hub in Singapore features a wide range of capabilities, including a food and flavor analytic lab, beverage and dairy applications lab and pilot plant, bakery and confectionery lab, meat and savory lab, sweet and savory creation lab, sensory evaluation facilities, customer innovation center, and a new plant-based innovation lab.April 2021: Bunge Limited has invested USD 45.7 million in Australian Plant Proteins (APP) to double the production of plant protein isolates in the country by March 2022. The ingredients manufactured by APP include fava bean isolate powder, yellow lentil isolate powder, and red lentil isolate powder.
9. What pricing options are available for accessing the report?
Pricing options include single-user, multi-user, and enterprise licenses priced at USD 3800, USD 4500, and USD 5800 respectively.
10. Is the market size provided in terms of value or volume?
The market size is provided in terms of value, measured in billion and volume, measured in K Tons.
11. Are there any specific market keywords associated with the report?
Yes, the market keyword associated with the report is "APAC Plant Protein Ingredients Market," which aids in identifying and referencing the specific market segment covered.
12. How do I determine which pricing option suits my needs best?
The pricing options vary based on user requirements and access needs. Individual users may opt for single-user licenses, while businesses requiring broader access may choose multi-user or enterprise licenses for cost-effective access to the report.
13. Are there any additional resources or data provided in the APAC Plant Protein Ingredients Market report?
While the report offers comprehensive insights, it's advisable to review the specific contents or supplementary materials provided to ascertain if additional resources or data are available.
14. How can I stay updated on further developments or reports in the APAC Plant Protein Ingredients Market?
To stay informed about further developments, trends, and reports in the APAC Plant Protein Ingredients Market, consider subscribing to industry newsletters, following relevant companies and organizations, or regularly checking reputable industry news sources and publications.
Methodology
Step 1 - Identification of Relevant Samples Size from Population Database


Step 2 - Approaches for Defining Global Market Size (Value, Volume* & Price*)

Note*: In applicable scenarios
Step 3 - Data Sources
Primary Research
- Web Analytics
- Survey Reports
- Research Institute
- Latest Research Reports
- Opinion Leaders
Secondary Research
- Annual Reports
- White Paper
- Latest Press Release
- Industry Association
- Paid Database
- Investor Presentations

Step 4 - Data Triangulation
Involves using different sources of information in order to increase the validity of a study
These sources are likely to be stakeholders in a program - participants, other researchers, program staff, other community members, and so on.
Then we put all data in single framework & apply various statistical tools to find out the dynamic on the market.
During the analysis stage, feedback from the stakeholder groups would be compared to determine areas of agreement as well as areas of divergence