


Key Insights
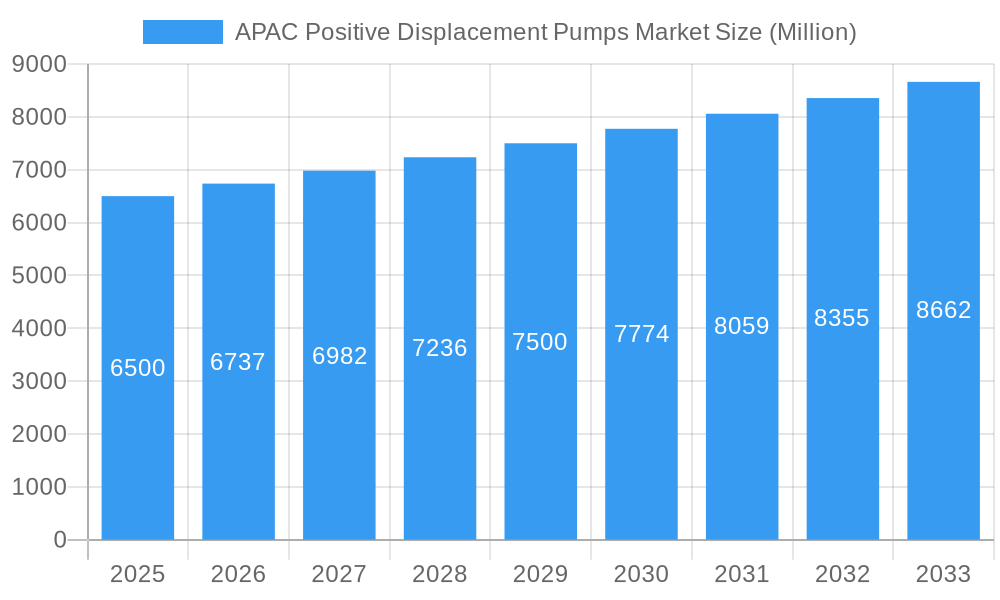
The Asia Pacific (APAC) Positive Displacement (PD) Pumps market is projected for significant expansion, fueled by robust industrial growth and escalating demand across pivotal sectors. With an estimated market size of $20,721.9 million in the base year of 2025, the region is anticipated to achieve a Compound Annual Growth Rate (CAGR) of 5.4%. This upward trajectory is primarily driven by the expanding oil and gas sector's need for efficient fluid transfer in exploration and production, the chemical industry's requirement for precise substance handling, and the food and beverage sector's demand for sanitary pumping solutions. Additionally, critical advancements in waste management and the pharmaceutical industry will continue to stimulate demand for sophisticated PD pumps. Emerging economies within APAC, notably China and India, are leading this expansion through rapid industrialization and substantial infrastructure development.

APAC Positive Displacement Pumps Market Market Size (In Billion)

Key market dynamics include the increasing adoption of advanced PD pump technologies, such as screw and progressive cavity pumps, for handling viscous and abrasive fluids, alongside a growing emphasis on energy-efficient and low-maintenance solutions. Potential challenges may arise from fluctuating raw material prices and high initial investment costs. However, the region's dedication to technological innovation and supportive government initiatives promoting industrial development and environmental compliance are expected to mitigate these restraints. The competitive landscape comprises leading global players and strong regional manufacturers, actively pursuing market share through innovation and strategic expansion.
APAC Positive Displacement Pumps Market Company Market Share
APAC Positive Displacement Pumps Market: Comprehensive Growth Forecast & Strategic Analysis (2019–2033)
This in-depth report provides a strategic analysis of the APAC Positive Displacement Pumps Market, offering critical insights and actionable intelligence for industry stakeholders. Spanning a study period from 2019 to 2033, with a base year of 2025, this research delves into market dynamics, key trends, dominant segments, and future growth trajectories. Our comprehensive coverage includes detailed segmentation by pump type and end-user industry, alongside an analysis of leading players and recent industry developments. The report is meticulously crafted to empower decision-makers with precise data and forward-looking perspectives on this rapidly evolving market.
APAC Positive Displacement Pumps Market Market Concentration & Innovation
The APAC Positive Displacement Pumps Market exhibits a moderate to high concentration, with several global giants and strong regional players vying for market share. Leading companies such as The Weir Group PLC, Xylem Inc, KSB SE & Co KGaA, SPX Flow Inc, NETZSCH Holding, TSURUMI MANUFACTURING CO LTD, Sulzer AG, Pentair PLC, Atlas Copco, and GRUNDFOS are actively engaged in innovation to maintain their competitive edge. Innovation drivers include the increasing demand for energy-efficient pumps, the development of smart pumps with IoT capabilities for predictive maintenance, and the growing need for pumps capable of handling challenging media and extreme operating conditions. Regulatory frameworks, particularly concerning environmental protection and safety standards in industries like chemicals and pharmaceuticals, are also shaping product development and market entry strategies. The presence of product substitutes, such as centrifugal pumps in certain applications, necessitates continuous technological advancement and cost optimization within the positive displacement pump segment. End-user trends, such as the adoption of advanced manufacturing processes and the drive for operational efficiency across various industries, are significantly influencing product demand. Mergers and acquisitions (M&A) activities, while not explicitly quantified, are anticipated to play a role in market consolidation and the expansion of product portfolios and geographical reach. Market share estimations and detailed M&A deal values are provided within the full report.
APAC Positive Displacement Pumps Market Industry Trends & Insights
The APAC Positive Displacement Pumps Market is poised for robust expansion, driven by a confluence of technological advancements, growing industrialization, and increasing investments across key sectors. The market is projected to witness a Compound Annual Growth Rate (CAGR) of approximately 5.5% during the forecast period (2025–2033). This growth is underpinned by the escalating demand from critical end-user industries such as Oil & Gas, Chemicals, Food & Beverage, Waste & Wastewater, Pharmaceutical, and Power. The Oil & Gas sector, in particular, continues to be a significant contributor, with ongoing exploration and production activities requiring reliable and efficient pumping solutions for various upstream, midstream, and downstream applications. The chemical industry's expansion, fueled by increasing demand for specialized chemicals and polymers, also presents substantial opportunities for positive displacement pumps, especially for handling corrosive, viscous, and abrasive fluids. The Food & Beverage industry is witnessing a growing adoption of hygienic and precise pumping technologies for processing and packaging, further boosting demand for specialized positive displacement pump types like lobe and progressive cavity pumps. The burgeoning waste and wastewater management sector across APAC nations, driven by stringent environmental regulations and growing urbanization, is a key growth driver. Pharmaceutical and healthcare sectors are also contributing to market growth with their increasing need for high-precision, contamination-free fluid transfer solutions.
Technological disruptions are playing a pivotal role in shaping the market. The development of advanced materials for pump components is enhancing durability and resistance to extreme conditions. Furthermore, the integration of IoT and AI technologies is leading to the evolution of "smart" positive displacement pumps, enabling real-time monitoring, predictive maintenance, and optimized operational performance. This shift towards digitalization offers significant advantages in terms of reduced downtime and operational costs for end-users. Consumer preferences are increasingly leaning towards energy-efficient, low-maintenance, and environmentally friendly pumping solutions. Manufacturers are responding by developing pumps with improved energy efficiency ratings and reduced carbon footprints. The competitive dynamics within the APAC market are characterized by intense rivalry among established global players and emerging regional manufacturers. This competition fosters innovation and drives product differentiation. Market penetration is steadily increasing across various industrial segments as businesses recognize the superior performance and reliability of positive displacement pumps for specific applications compared to alternative pumping technologies. The study period (2019–2033) encompasses historical trends and future projections, with the base year of 2025 serving as a critical benchmark for growth analysis.
Dominant Markets & Segments in APAC Positive Displacement Pumps Market
The APAC Positive Displacement Pumps Market demonstrates distinct regional dominance and segment leadership, driven by specific economic, infrastructural, and regulatory factors.
Leading Region:
- East Asia: This region, encompassing countries like China, Japan, and South Korea, stands as the dominant market for positive displacement pumps in APAC.
- Key Drivers:
- Robust Industrial Base: Significant presence of large-scale manufacturing in sectors like automotive, electronics, chemicals, and heavy machinery.
- Extensive Infrastructure Development: Ongoing investments in infrastructure, including water treatment facilities, power plants, and industrial complexes, necessitate substantial pumping solutions.
- Government Support for Industrial Growth: Favorable policies and initiatives promoting domestic manufacturing and technological advancement.
- High Demand from Chemical and Pharmaceutical Industries: These sectors are particularly strong in East Asia, requiring specialized positive displacement pumps for handling diverse fluid types.
- Technological Advancement & R&D: Strong focus on research and development leads to the adoption of advanced pumping technologies.
- Key Drivers:
Leading Country:
- China: As the largest economy in APAC, China exhibits the most significant demand for positive displacement pumps, driven by its massive industrial output and ongoing urbanization. The country’s vast chemical sector, extensive refining capacity, and continuous development in water and wastewater management projects are major contributors to this dominance. The government's push for industrial upgrading and environmental protection further accentuates the need for efficient and reliable pumping systems.
Dominant Segments:
By Type:
- Progressive Cavity Pumps: This segment is expected to witness substantial growth, particularly in industries like oil & gas (for enhanced oil recovery), waste & wastewater (sludge and slurry handling), and food & beverage (for viscous products). Their ability to handle high viscosities, solids, and shear-sensitive fluids makes them indispensable.
- Gear Pumps: Remain a strong segment due to their reliability and widespread use in hydraulic systems, lubrication, and chemical transfer applications. Their simplicity and robustness ensure continued demand in various industrial settings.
- Diaphragm Pumps: These are crucial in the chemical, pharmaceutical, and wastewater sectors, especially where leak-free operation and the handling of corrosive or abrasive media are paramount. Their ability to operate dry and handle a wide range of pressures makes them highly versatile.
By End-User Industry:
- Oil & Gas: This sector continues to be a cornerstone of the positive displacement pump market in APAC. From upstream exploration and extraction to downstream refining and petrochemical operations, the need for robust and reliable pumps to handle crude oil, refined products, and associated fluids is immense. The ongoing investments in energy infrastructure and the pursuit of energy independence in several APAC nations further solidify this segment's dominance.
- Chemicals: The rapidly expanding chemical industry across APAC, driven by demand for a wide array of products, fuels a significant need for positive displacement pumps. These pumps are essential for the safe and efficient transfer of corrosive, toxic, abrasive, and viscous chemicals. The increasing focus on specialized chemicals and advanced materials necessitates pumps capable of precise metering and handling challenging media.
- Waste & Wastewater: With increasing urbanization and stricter environmental regulations across APAC, the demand for efficient waste and wastewater treatment solutions is soaring. Positive displacement pumps, especially progressive cavity and diaphragm types, are critical for handling sludge, slurries, and various types of wastewater, contributing significantly to the market's growth.
The dominance of these regions and segments is further analyzed by considering factors such as economic policies favoring industrial growth, investment in infrastructure projects like smart cities and advanced manufacturing facilities, and the stringency of environmental and safety regulations, all of which are detailed within the full report.
APAC Positive Displacement Pumps Market Product Developments
Product development in the APAC Positive Displacement Pumps Market is characterized by a focus on enhancing efficiency, reliability, and intelligence. The industry is witnessing a trend towards pumps designed for specific, demanding applications, improved material science for increased durability against corrosive and abrasive substances, and the integration of smart technologies for remote monitoring and predictive maintenance. These innovations aim to meet the evolving needs of diverse end-user industries, offering competitive advantages through reduced operational costs, extended service life, and minimized downtime. The market fit for these developments is strong, driven by increasing industrial automation and a growing emphasis on sustainable and efficient operations across the region.
Report Scope & Segmentation Analysis
This report provides a comprehensive analysis of the APAC Positive Displacement Pumps Market, meticulously segmented to offer granular insights. The segmentation includes:
- By Type: Diaphragm, Piston, Gear, Lobe, Progressive Cavity, Screw, Vane, and Peristaltic pumps. Each type is analyzed for its specific applications, market share, growth projections, and competitive dynamics within the APAC region.
- By End-user Industry: Oil & Gas, Chemicals, Food & Beverage, Waste & Wastewater, Pharmaceutical, Power, and Other End-user Industries. Market sizes, growth rates, and key drivers for each industry segment are detailed, alongside the specific pumping requirements and adoption trends within these sectors.
The analysis for each segment includes projected market sizes in USD Million for the forecast period (2025–2033) and an assessment of the competitive landscape, identifying key players and their market penetration strategies.
Key Drivers of APAC Positive Displacement Pumps Market Growth
The APAC Positive Displacement Pumps Market is propelled by several key growth drivers. Technologically, the increasing demand for pumps capable of handling abrasive, viscous, and shear-sensitive fluids, coupled with advancements in smart pump technology offering predictive maintenance and IoT integration, is a significant catalyst. Economically, rapid industrialization across APAC, particularly in China, India, and Southeast Asian nations, fuels the demand for reliable fluid transfer solutions in sectors like chemicals, oil & gas, and food & beverage. Government initiatives promoting infrastructure development, such as water and wastewater treatment projects and the expansion of power generation facilities, also contribute substantially. Regulatory factors, including stringent environmental regulations mandating efficient waste management and safe handling of industrial chemicals, further drive the adoption of specialized positive displacement pumps.
Challenges in the APAC Positive Displacement Pumps Market Sector
Despite strong growth prospects, the APAC Positive Displacement Pumps Market faces several challenges. Intense competition from both global manufacturers and emerging local players can lead to price pressures and reduced profit margins. The supply chain for specialized components and raw materials can be subject to disruptions, impacting production timelines and costs. High initial capital investment for certain advanced positive displacement pump technologies can be a barrier for smaller enterprises. Furthermore, varying regulatory landscapes across different APAC countries can create complexity in market entry and compliance. The availability of technically skilled labor for installation, maintenance, and repair of sophisticated pumping systems also poses a challenge in certain developing economies.
Emerging Opportunities in APAC Positive Displacement Pumps Market
Emerging opportunities within the APAC Positive Displacement Pumps Market are abundant. The growing focus on sustainable development and renewable energy projects, such as solar and wind power, is creating new avenues for specialized pump applications. The expansion of the pharmaceutical and biotechnology sectors, driven by an aging population and increased healthcare spending, presents a significant opportunity for high-precision, sterile pumping solutions. The increasing adoption of Industry 4.0 principles by manufacturers across APAC opens doors for smart pumps with advanced digital capabilities, offering enhanced operational efficiency and data analytics. Furthermore, the ongoing demand for improved water management and sanitation infrastructure in developing nations within APAC presents substantial opportunities for wastewater and sludge handling pumps.
Leading Players in the APAC Positive Displacement Pumps Market Market
- The Weir Group PLC
- Xylem Inc
- KSB SE & Co KGaA
- SPX Flow Inc
- NETZSCH Holding
- TSURUMI MANUFACTURING CO LTD
- Sulzer AG
- Pentair PLC
- Atlas Copco
- GRUNDFOS
Key Developments in APAC Positive Displacement Pumps Market Industry
- February 2022: NETZSCH Pumps and Systems announced the expansion of its product portfolio with the launch of the PERIPRO peristaltic pump. The pump model is available in chemical, industrial, and food versions. Moreover, the newly launched product complements the company's well-known technologies of NEMO progressing cavity pumps, NOTOS multi screw pumps, and TORNADO rotary lobe pumps.
Strategic Outlook for APAC Positive Displacement Pumps Market Market
The strategic outlook for the APAC Positive Displacement Pumps Market is highly positive, characterized by sustained growth driven by ongoing industrial expansion and technological innovation. The increasing adoption of smart technologies, focus on energy efficiency, and stringent environmental regulations will continue to shape product development and market demand. Key growth catalysts include strategic investments in infrastructure, the burgeoning demand from the chemicals, oil & gas, and waste & wastewater sectors, and the increasing emphasis on operational efficiency and sustainability by end-users. Companies that can effectively leverage technological advancements, offer customized solutions, and navigate the diverse regulatory environments across APAC will be best positioned for success. The market presents significant opportunities for expansion through new product development, strategic partnerships, and geographical penetration, particularly in emerging economies within the region.
APAC Positive Displacement Pumps Market Segmentation
-
1. Type
- 1.1. Diaphragm
- 1.2. Piston
- 1.3. Gear
- 1.4. Lobe
- 1.5. Progressive Cavity
- 1.6. Screw
- 1.7. Vane
- 1.8. Peristaltic
-
2. End-user Industry
- 2.1. Oil & Gas
- 2.2. Chemicals
- 2.3. Food & Beverage
- 2.4. Waste & Wastewater
- 2.5. Pharmaceutical
- 2.6. Power
- 2.7. Other End-user Industries
APAC Positive Displacement Pumps Market Segmentation By Geography
-
1. North America
- 1.1. United States
- 1.2. Canada
- 1.3. Mexico
-
2. South America
- 2.1. Brazil
- 2.2. Argentina
- 2.3. Rest of South America
-
3. Europe
- 3.1. United Kingdom
- 3.2. Germany
- 3.3. France
- 3.4. Italy
- 3.5. Spain
- 3.6. Russia
- 3.7. Benelux
- 3.8. Nordics
- 3.9. Rest of Europe
-
4. Middle East & Africa
- 4.1. Turkey
- 4.2. Israel
- 4.3. GCC
- 4.4. North Africa
- 4.5. South Africa
- 4.6. Rest of Middle East & Africa
-
5. Asia Pacific
- 5.1. China
- 5.2. India
- 5.3. Japan
- 5.4. South Korea
- 5.5. ASEAN
- 5.6. Oceania
- 5.7. Rest of Asia Pacific
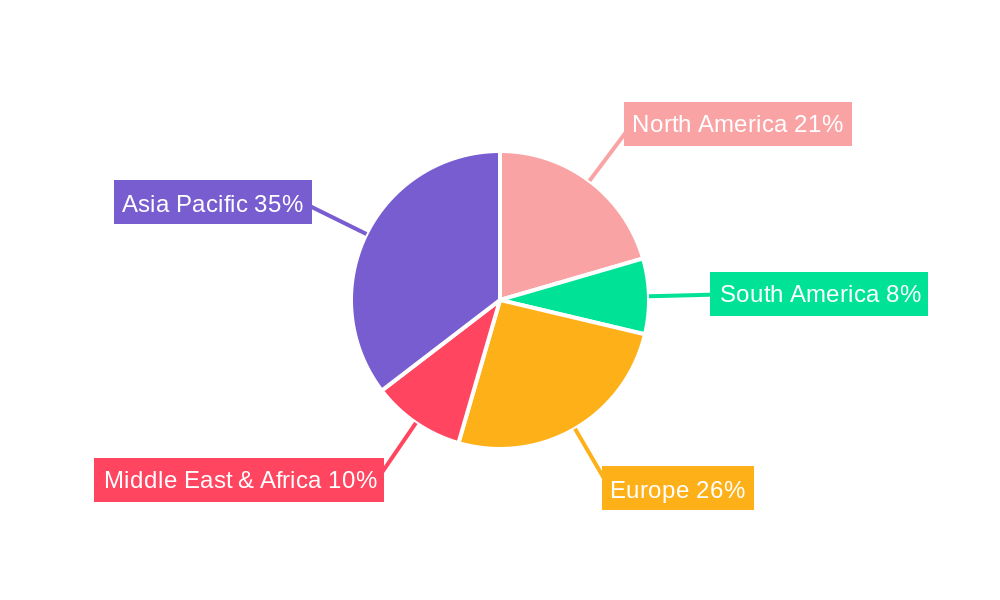
APAC Positive Displacement Pumps Market Regional Market Share
Geographic Coverage of APAC Positive Displacement Pumps Market
APAC Positive Displacement Pumps Market REPORT HIGHLIGHTS
| Aspects | Details |
|---|---|
| Study Period | 2020-2034 |
| Base Year | 2025 |
| Estimated Year | 2026 |
| Forecast Period | 2026-2034 |
| Historical Period | 2020-2025 |
| Growth Rate | CAGR of 5.4% from 2020-2034 |
| Segmentation |
|
Table of Contents
- 1. Introduction
- 1.1. Research Scope
- 1.2. Market Segmentation
- 1.3. Research Methodology
- 1.4. Definitions and Assumptions
- 2. Executive Summary
- 2.1. Introduction
- 3. Market Dynamics
- 3.1. Introduction
- 3.2. Market Drivers
- 3.2.1. Increased Focus on Wastewater Management
- 3.3. Market Restrains
- 3.3.1. Environmental and Safe Use Concerns
- 3.4. Market Trends
- 3.4.1. Waste and Wastewater Industry is Expected to Register Significant Growth
- 4. Market Factor Analysis
- 4.1. Porters Five Forces
- 4.2. Supply/Value Chain
- 4.3. PESTEL analysis
- 4.4. Market Entropy
- 4.5. Patent/Trademark Analysis
- 5. Global APAC Positive Displacement Pumps Market Analysis, Insights and Forecast, 2020-2032
- 5.1. Market Analysis, Insights and Forecast - by Type
- 5.1.1. Diaphragm
- 5.1.2. Piston
- 5.1.3. Gear
- 5.1.4. Lobe
- 5.1.5. Progressive Cavity
- 5.1.6. Screw
- 5.1.7. Vane
- 5.1.8. Peristaltic
- 5.2. Market Analysis, Insights and Forecast - by End-user Industry
- 5.2.1. Oil & Gas
- 5.2.2. Chemicals
- 5.2.3. Food & Beverage
- 5.2.4. Waste & Wastewater
- 5.2.5. Pharmaceutical
- 5.2.6. Power
- 5.2.7. Other End-user Industries
- 5.3. Market Analysis, Insights and Forecast - by Region
- 5.3.1. North America
- 5.3.2. South America
- 5.3.3. Europe
- 5.3.4. Middle East & Africa
- 5.3.5. Asia Pacific
- 5.1. Market Analysis, Insights and Forecast - by Type
- 6. North America APAC Positive Displacement Pumps Market Analysis, Insights and Forecast, 2020-2032
- 6.1. Market Analysis, Insights and Forecast - by Type
- 6.1.1. Diaphragm
- 6.1.2. Piston
- 6.1.3. Gear
- 6.1.4. Lobe
- 6.1.5. Progressive Cavity
- 6.1.6. Screw
- 6.1.7. Vane
- 6.1.8. Peristaltic
- 6.2. Market Analysis, Insights and Forecast - by End-user Industry
- 6.2.1. Oil & Gas
- 6.2.2. Chemicals
- 6.2.3. Food & Beverage
- 6.2.4. Waste & Wastewater
- 6.2.5. Pharmaceutical
- 6.2.6. Power
- 6.2.7. Other End-user Industries
- 6.1. Market Analysis, Insights and Forecast - by Type
- 7. South America APAC Positive Displacement Pumps Market Analysis, Insights and Forecast, 2020-2032
- 7.1. Market Analysis, Insights and Forecast - by Type
- 7.1.1. Diaphragm
- 7.1.2. Piston
- 7.1.3. Gear
- 7.1.4. Lobe
- 7.1.5. Progressive Cavity
- 7.1.6. Screw
- 7.1.7. Vane
- 7.1.8. Peristaltic
- 7.2. Market Analysis, Insights and Forecast - by End-user Industry
- 7.2.1. Oil & Gas
- 7.2.2. Chemicals
- 7.2.3. Food & Beverage
- 7.2.4. Waste & Wastewater
- 7.2.5. Pharmaceutical
- 7.2.6. Power
- 7.2.7. Other End-user Industries
- 7.1. Market Analysis, Insights and Forecast - by Type
- 8. Europe APAC Positive Displacement Pumps Market Analysis, Insights and Forecast, 2020-2032
- 8.1. Market Analysis, Insights and Forecast - by Type
- 8.1.1. Diaphragm
- 8.1.2. Piston
- 8.1.3. Gear
- 8.1.4. Lobe
- 8.1.5. Progressive Cavity
- 8.1.6. Screw
- 8.1.7. Vane
- 8.1.8. Peristaltic
- 8.2. Market Analysis, Insights and Forecast - by End-user Industry
- 8.2.1. Oil & Gas
- 8.2.2. Chemicals
- 8.2.3. Food & Beverage
- 8.2.4. Waste & Wastewater
- 8.2.5. Pharmaceutical
- 8.2.6. Power
- 8.2.7. Other End-user Industries
- 8.1. Market Analysis, Insights and Forecast - by Type
- 9. Middle East & Africa APAC Positive Displacement Pumps Market Analysis, Insights and Forecast, 2020-2032
- 9.1. Market Analysis, Insights and Forecast - by Type
- 9.1.1. Diaphragm
- 9.1.2. Piston
- 9.1.3. Gear
- 9.1.4. Lobe
- 9.1.5. Progressive Cavity
- 9.1.6. Screw
- 9.1.7. Vane
- 9.1.8. Peristaltic
- 9.2. Market Analysis, Insights and Forecast - by End-user Industry
- 9.2.1. Oil & Gas
- 9.2.2. Chemicals
- 9.2.3. Food & Beverage
- 9.2.4. Waste & Wastewater
- 9.2.5. Pharmaceutical
- 9.2.6. Power
- 9.2.7. Other End-user Industries
- 9.1. Market Analysis, Insights and Forecast - by Type
- 10. Asia Pacific APAC Positive Displacement Pumps Market Analysis, Insights and Forecast, 2020-2032
- 10.1. Market Analysis, Insights and Forecast - by Type
- 10.1.1. Diaphragm
- 10.1.2. Piston
- 10.1.3. Gear
- 10.1.4. Lobe
- 10.1.5. Progressive Cavity
- 10.1.6. Screw
- 10.1.7. Vane
- 10.1.8. Peristaltic
- 10.2. Market Analysis, Insights and Forecast - by End-user Industry
- 10.2.1. Oil & Gas
- 10.2.2. Chemicals
- 10.2.3. Food & Beverage
- 10.2.4. Waste & Wastewater
- 10.2.5. Pharmaceutical
- 10.2.6. Power
- 10.2.7. Other End-user Industries
- 10.1. Market Analysis, Insights and Forecast - by Type
- 11. Competitive Analysis
- 11.1. Global Market Share Analysis 2025
- 11.2. Company Profiles
- 11.2.1 The Weir Group PLC
- 11.2.1.1. Overview
- 11.2.1.2. Products
- 11.2.1.3. SWOT Analysis
- 11.2.1.4. Recent Developments
- 11.2.1.5. Financials (Based on Availability)
- 11.2.2 Xylem Inc
- 11.2.2.1. Overview
- 11.2.2.2. Products
- 11.2.2.3. SWOT Analysis
- 11.2.2.4. Recent Developments
- 11.2.2.5. Financials (Based on Availability)
- 11.2.3 KSB SE & Co KGaA
- 11.2.3.1. Overview
- 11.2.3.2. Products
- 11.2.3.3. SWOT Analysis
- 11.2.3.4. Recent Developments
- 11.2.3.5. Financials (Based on Availability)
- 11.2.4 SPX Flow Inc
- 11.2.4.1. Overview
- 11.2.4.2. Products
- 11.2.4.3. SWOT Analysis
- 11.2.4.4. Recent Developments
- 11.2.4.5. Financials (Based on Availability)
- 11.2.5 NETZSCH Holding
- 11.2.5.1. Overview
- 11.2.5.2. Products
- 11.2.5.3. SWOT Analysis
- 11.2.5.4. Recent Developments
- 11.2.5.5. Financials (Based on Availability)
- 11.2.6 TSURUMI MANUFACTURING CO LTD
- 11.2.6.1. Overview
- 11.2.6.2. Products
- 11.2.6.3. SWOT Analysis
- 11.2.6.4. Recent Developments
- 11.2.6.5. Financials (Based on Availability)
- 11.2.7 Sulzer AG
- 11.2.7.1. Overview
- 11.2.7.2. Products
- 11.2.7.3. SWOT Analysis
- 11.2.7.4. Recent Developments
- 11.2.7.5. Financials (Based on Availability)
- 11.2.8 Pentair PLC
- 11.2.8.1. Overview
- 11.2.8.2. Products
- 11.2.8.3. SWOT Analysis
- 11.2.8.4. Recent Developments
- 11.2.8.5. Financials (Based on Availability)
- 11.2.9 Atlas Copco
- 11.2.9.1. Overview
- 11.2.9.2. Products
- 11.2.9.3. SWOT Analysis
- 11.2.9.4. Recent Developments
- 11.2.9.5. Financials (Based on Availability)
- 11.2.10 GRUNDFOS
- 11.2.10.1. Overview
- 11.2.10.2. Products
- 11.2.10.3. SWOT Analysis
- 11.2.10.4. Recent Developments
- 11.2.10.5. Financials (Based on Availability)
- 11.2.1 The Weir Group PLC
List of Figures
- Figure 1: Global APAC Positive Displacement Pumps Market Revenue Breakdown (million, %) by Region 2025 & 2033
- Figure 2: Global APAC Positive Displacement Pumps Market Volume Breakdown (K Unit, %) by Region 2025 & 2033
- Figure 3: North America APAC Positive Displacement Pumps Market Revenue (million), by Type 2025 & 2033
- Figure 4: North America APAC Positive Displacement Pumps Market Volume (K Unit), by Type 2025 & 2033
- Figure 5: North America APAC Positive Displacement Pumps Market Revenue Share (%), by Type 2025 & 2033
- Figure 6: North America APAC Positive Displacement Pumps Market Volume Share (%), by Type 2025 & 2033
- Figure 7: North America APAC Positive Displacement Pumps Market Revenue (million), by End-user Industry 2025 & 2033
- Figure 8: North America APAC Positive Displacement Pumps Market Volume (K Unit), by End-user Industry 2025 & 2033
- Figure 9: North America APAC Positive Displacement Pumps Market Revenue Share (%), by End-user Industry 2025 & 2033
- Figure 10: North America APAC Positive Displacement Pumps Market Volume Share (%), by End-user Industry 2025 & 2033
- Figure 11: North America APAC Positive Displacement Pumps Market Revenue (million), by Country 2025 & 2033
- Figure 12: North America APAC Positive Displacement Pumps Market Volume (K Unit), by Country 2025 & 2033
- Figure 13: North America APAC Positive Displacement Pumps Market Revenue Share (%), by Country 2025 & 2033
- Figure 14: North America APAC Positive Displacement Pumps Market Volume Share (%), by Country 2025 & 2033
- Figure 15: South America APAC Positive Displacement Pumps Market Revenue (million), by Type 2025 & 2033
- Figure 16: South America APAC Positive Displacement Pumps Market Volume (K Unit), by Type 2025 & 2033
- Figure 17: South America APAC Positive Displacement Pumps Market Revenue Share (%), by Type 2025 & 2033
- Figure 18: South America APAC Positive Displacement Pumps Market Volume Share (%), by Type 2025 & 2033
- Figure 19: South America APAC Positive Displacement Pumps Market Revenue (million), by End-user Industry 2025 & 2033
- Figure 20: South America APAC Positive Displacement Pumps Market Volume (K Unit), by End-user Industry 2025 & 2033
- Figure 21: South America APAC Positive Displacement Pumps Market Revenue Share (%), by End-user Industry 2025 & 2033
- Figure 22: South America APAC Positive Displacement Pumps Market Volume Share (%), by End-user Industry 2025 & 2033
- Figure 23: South America APAC Positive Displacement Pumps Market Revenue (million), by Country 2025 & 2033
- Figure 24: South America APAC Positive Displacement Pumps Market Volume (K Unit), by Country 2025 & 2033
- Figure 25: South America APAC Positive Displacement Pumps Market Revenue Share (%), by Country 2025 & 2033
- Figure 26: South America APAC Positive Displacement Pumps Market Volume Share (%), by Country 2025 & 2033
- Figure 27: Europe APAC Positive Displacement Pumps Market Revenue (million), by Type 2025 & 2033
- Figure 28: Europe APAC Positive Displacement Pumps Market Volume (K Unit), by Type 2025 & 2033
- Figure 29: Europe APAC Positive Displacement Pumps Market Revenue Share (%), by Type 2025 & 2033
- Figure 30: Europe APAC Positive Displacement Pumps Market Volume Share (%), by Type 2025 & 2033
- Figure 31: Europe APAC Positive Displacement Pumps Market Revenue (million), by End-user Industry 2025 & 2033
- Figure 32: Europe APAC Positive Displacement Pumps Market Volume (K Unit), by End-user Industry 2025 & 2033
- Figure 33: Europe APAC Positive Displacement Pumps Market Revenue Share (%), by End-user Industry 2025 & 2033
- Figure 34: Europe APAC Positive Displacement Pumps Market Volume Share (%), by End-user Industry 2025 & 2033
- Figure 35: Europe APAC Positive Displacement Pumps Market Revenue (million), by Country 2025 & 2033
- Figure 36: Europe APAC Positive Displacement Pumps Market Volume (K Unit), by Country 2025 & 2033
- Figure 37: Europe APAC Positive Displacement Pumps Market Revenue Share (%), by Country 2025 & 2033
- Figure 38: Europe APAC Positive Displacement Pumps Market Volume Share (%), by Country 2025 & 2033
- Figure 39: Middle East & Africa APAC Positive Displacement Pumps Market Revenue (million), by Type 2025 & 2033
- Figure 40: Middle East & Africa APAC Positive Displacement Pumps Market Volume (K Unit), by Type 2025 & 2033
- Figure 41: Middle East & Africa APAC Positive Displacement Pumps Market Revenue Share (%), by Type 2025 & 2033
- Figure 42: Middle East & Africa APAC Positive Displacement Pumps Market Volume Share (%), by Type 2025 & 2033
- Figure 43: Middle East & Africa APAC Positive Displacement Pumps Market Revenue (million), by End-user Industry 2025 & 2033
- Figure 44: Middle East & Africa APAC Positive Displacement Pumps Market Volume (K Unit), by End-user Industry 2025 & 2033
- Figure 45: Middle East & Africa APAC Positive Displacement Pumps Market Revenue Share (%), by End-user Industry 2025 & 2033
- Figure 46: Middle East & Africa APAC Positive Displacement Pumps Market Volume Share (%), by End-user Industry 2025 & 2033
- Figure 47: Middle East & Africa APAC Positive Displacement Pumps Market Revenue (million), by Country 2025 & 2033
- Figure 48: Middle East & Africa APAC Positive Displacement Pumps Market Volume (K Unit), by Country 2025 & 2033
- Figure 49: Middle East & Africa APAC Positive Displacement Pumps Market Revenue Share (%), by Country 2025 & 2033
- Figure 50: Middle East & Africa APAC Positive Displacement Pumps Market Volume Share (%), by Country 2025 & 2033
- Figure 51: Asia Pacific APAC Positive Displacement Pumps Market Revenue (million), by Type 2025 & 2033
- Figure 52: Asia Pacific APAC Positive Displacement Pumps Market Volume (K Unit), by Type 2025 & 2033
- Figure 53: Asia Pacific APAC Positive Displacement Pumps Market Revenue Share (%), by Type 2025 & 2033
- Figure 54: Asia Pacific APAC Positive Displacement Pumps Market Volume Share (%), by Type 2025 & 2033
- Figure 55: Asia Pacific APAC Positive Displacement Pumps Market Revenue (million), by End-user Industry 2025 & 2033
- Figure 56: Asia Pacific APAC Positive Displacement Pumps Market Volume (K Unit), by End-user Industry 2025 & 2033
- Figure 57: Asia Pacific APAC Positive Displacement Pumps Market Revenue Share (%), by End-user Industry 2025 & 2033
- Figure 58: Asia Pacific APAC Positive Displacement Pumps Market Volume Share (%), by End-user Industry 2025 & 2033
- Figure 59: Asia Pacific APAC Positive Displacement Pumps Market Revenue (million), by Country 2025 & 2033
- Figure 60: Asia Pacific APAC Positive Displacement Pumps Market Volume (K Unit), by Country 2025 & 2033
- Figure 61: Asia Pacific APAC Positive Displacement Pumps Market Revenue Share (%), by Country 2025 & 2033
- Figure 62: Asia Pacific APAC Positive Displacement Pumps Market Volume Share (%), by Country 2025 & 2033
List of Tables
- Table 1: Global APAC Positive Displacement Pumps Market Revenue million Forecast, by Type 2020 & 2033
- Table 2: Global APAC Positive Displacement Pumps Market Volume K Unit Forecast, by Type 2020 & 2033
- Table 3: Global APAC Positive Displacement Pumps Market Revenue million Forecast, by End-user Industry 2020 & 2033
- Table 4: Global APAC Positive Displacement Pumps Market Volume K Unit Forecast, by End-user Industry 2020 & 2033
- Table 5: Global APAC Positive Displacement Pumps Market Revenue million Forecast, by Region 2020 & 2033
- Table 6: Global APAC Positive Displacement Pumps Market Volume K Unit Forecast, by Region 2020 & 2033
- Table 7: Global APAC Positive Displacement Pumps Market Revenue million Forecast, by Type 2020 & 2033
- Table 8: Global APAC Positive Displacement Pumps Market Volume K Unit Forecast, by Type 2020 & 2033
- Table 9: Global APAC Positive Displacement Pumps Market Revenue million Forecast, by End-user Industry 2020 & 2033
- Table 10: Global APAC Positive Displacement Pumps Market Volume K Unit Forecast, by End-user Industry 2020 & 2033
- Table 11: Global APAC Positive Displacement Pumps Market Revenue million Forecast, by Country 2020 & 2033
- Table 12: Global APAC Positive Displacement Pumps Market Volume K Unit Forecast, by Country 2020 & 2033
- Table 13: United States APAC Positive Displacement Pumps Market Revenue (million) Forecast, by Application 2020 & 2033
- Table 14: United States APAC Positive Displacement Pumps Market Volume (K Unit) Forecast, by Application 2020 & 2033
- Table 15: Canada APAC Positive Displacement Pumps Market Revenue (million) Forecast, by Application 2020 & 2033
- Table 16: Canada APAC Positive Displacement Pumps Market Volume (K Unit) Forecast, by Application 2020 & 2033
- Table 17: Mexico APAC Positive Displacement Pumps Market Revenue (million) Forecast, by Application 2020 & 2033
- Table 18: Mexico APAC Positive Displacement Pumps Market Volume (K Unit) Forecast, by Application 2020 & 2033
- Table 19: Global APAC Positive Displacement Pumps Market Revenue million Forecast, by Type 2020 & 2033
- Table 20: Global APAC Positive Displacement Pumps Market Volume K Unit Forecast, by Type 2020 & 2033
- Table 21: Global APAC Positive Displacement Pumps Market Revenue million Forecast, by End-user Industry 2020 & 2033
- Table 22: Global APAC Positive Displacement Pumps Market Volume K Unit Forecast, by End-user Industry 2020 & 2033
- Table 23: Global APAC Positive Displacement Pumps Market Revenue million Forecast, by Country 2020 & 2033
- Table 24: Global APAC Positive Displacement Pumps Market Volume K Unit Forecast, by Country 2020 & 2033
- Table 25: Brazil APAC Positive Displacement Pumps Market Revenue (million) Forecast, by Application 2020 & 2033
- Table 26: Brazil APAC Positive Displacement Pumps Market Volume (K Unit) Forecast, by Application 2020 & 2033
- Table 27: Argentina APAC Positive Displacement Pumps Market Revenue (million) Forecast, by Application 2020 & 2033
- Table 28: Argentina APAC Positive Displacement Pumps Market Volume (K Unit) Forecast, by Application 2020 & 2033
- Table 29: Rest of South America APAC Positive Displacement Pumps Market Revenue (million) Forecast, by Application 2020 & 2033
- Table 30: Rest of South America APAC Positive Displacement Pumps Market Volume (K Unit) Forecast, by Application 2020 & 2033
- Table 31: Global APAC Positive Displacement Pumps Market Revenue million Forecast, by Type 2020 & 2033
- Table 32: Global APAC Positive Displacement Pumps Market Volume K Unit Forecast, by Type 2020 & 2033
- Table 33: Global APAC Positive Displacement Pumps Market Revenue million Forecast, by End-user Industry 2020 & 2033
- Table 34: Global APAC Positive Displacement Pumps Market Volume K Unit Forecast, by End-user Industry 2020 & 2033
- Table 35: Global APAC Positive Displacement Pumps Market Revenue million Forecast, by Country 2020 & 2033
- Table 36: Global APAC Positive Displacement Pumps Market Volume K Unit Forecast, by Country 2020 & 2033
- Table 37: United Kingdom APAC Positive Displacement Pumps Market Revenue (million) Forecast, by Application 2020 & 2033
- Table 38: United Kingdom APAC Positive Displacement Pumps Market Volume (K Unit) Forecast, by Application 2020 & 2033
- Table 39: Germany APAC Positive Displacement Pumps Market Revenue (million) Forecast, by Application 2020 & 2033
- Table 40: Germany APAC Positive Displacement Pumps Market Volume (K Unit) Forecast, by Application 2020 & 2033
- Table 41: France APAC Positive Displacement Pumps Market Revenue (million) Forecast, by Application 2020 & 2033
- Table 42: France APAC Positive Displacement Pumps Market Volume (K Unit) Forecast, by Application 2020 & 2033
- Table 43: Italy APAC Positive Displacement Pumps Market Revenue (million) Forecast, by Application 2020 & 2033
- Table 44: Italy APAC Positive Displacement Pumps Market Volume (K Unit) Forecast, by Application 2020 & 2033
- Table 45: Spain APAC Positive Displacement Pumps Market Revenue (million) Forecast, by Application 2020 & 2033
- Table 46: Spain APAC Positive Displacement Pumps Market Volume (K Unit) Forecast, by Application 2020 & 2033
- Table 47: Russia APAC Positive Displacement Pumps Market Revenue (million) Forecast, by Application 2020 & 2033
- Table 48: Russia APAC Positive Displacement Pumps Market Volume (K Unit) Forecast, by Application 2020 & 2033
- Table 49: Benelux APAC Positive Displacement Pumps Market Revenue (million) Forecast, by Application 2020 & 2033
- Table 50: Benelux APAC Positive Displacement Pumps Market Volume (K Unit) Forecast, by Application 2020 & 2033
- Table 51: Nordics APAC Positive Displacement Pumps Market Revenue (million) Forecast, by Application 2020 & 2033
- Table 52: Nordics APAC Positive Displacement Pumps Market Volume (K Unit) Forecast, by Application 2020 & 2033
- Table 53: Rest of Europe APAC Positive Displacement Pumps Market Revenue (million) Forecast, by Application 2020 & 2033
- Table 54: Rest of Europe APAC Positive Displacement Pumps Market Volume (K Unit) Forecast, by Application 2020 & 2033
- Table 55: Global APAC Positive Displacement Pumps Market Revenue million Forecast, by Type 2020 & 2033
- Table 56: Global APAC Positive Displacement Pumps Market Volume K Unit Forecast, by Type 2020 & 2033
- Table 57: Global APAC Positive Displacement Pumps Market Revenue million Forecast, by End-user Industry 2020 & 2033
- Table 58: Global APAC Positive Displacement Pumps Market Volume K Unit Forecast, by End-user Industry 2020 & 2033
- Table 59: Global APAC Positive Displacement Pumps Market Revenue million Forecast, by Country 2020 & 2033
- Table 60: Global APAC Positive Displacement Pumps Market Volume K Unit Forecast, by Country 2020 & 2033
- Table 61: Turkey APAC Positive Displacement Pumps Market Revenue (million) Forecast, by Application 2020 & 2033
- Table 62: Turkey APAC Positive Displacement Pumps Market Volume (K Unit) Forecast, by Application 2020 & 2033
- Table 63: Israel APAC Positive Displacement Pumps Market Revenue (million) Forecast, by Application 2020 & 2033
- Table 64: Israel APAC Positive Displacement Pumps Market Volume (K Unit) Forecast, by Application 2020 & 2033
- Table 65: GCC APAC Positive Displacement Pumps Market Revenue (million) Forecast, by Application 2020 & 2033
- Table 66: GCC APAC Positive Displacement Pumps Market Volume (K Unit) Forecast, by Application 2020 & 2033
- Table 67: North Africa APAC Positive Displacement Pumps Market Revenue (million) Forecast, by Application 2020 & 2033
- Table 68: North Africa APAC Positive Displacement Pumps Market Volume (K Unit) Forecast, by Application 2020 & 2033
- Table 69: South Africa APAC Positive Displacement Pumps Market Revenue (million) Forecast, by Application 2020 & 2033
- Table 70: South Africa APAC Positive Displacement Pumps Market Volume (K Unit) Forecast, by Application 2020 & 2033
- Table 71: Rest of Middle East & Africa APAC Positive Displacement Pumps Market Revenue (million) Forecast, by Application 2020 & 2033
- Table 72: Rest of Middle East & Africa APAC Positive Displacement Pumps Market Volume (K Unit) Forecast, by Application 2020 & 2033
- Table 73: Global APAC Positive Displacement Pumps Market Revenue million Forecast, by Type 2020 & 2033
- Table 74: Global APAC Positive Displacement Pumps Market Volume K Unit Forecast, by Type 2020 & 2033
- Table 75: Global APAC Positive Displacement Pumps Market Revenue million Forecast, by End-user Industry 2020 & 2033
- Table 76: Global APAC Positive Displacement Pumps Market Volume K Unit Forecast, by End-user Industry 2020 & 2033
- Table 77: Global APAC Positive Displacement Pumps Market Revenue million Forecast, by Country 2020 & 2033
- Table 78: Global APAC Positive Displacement Pumps Market Volume K Unit Forecast, by Country 2020 & 2033
- Table 79: China APAC Positive Displacement Pumps Market Revenue (million) Forecast, by Application 2020 & 2033
- Table 80: China APAC Positive Displacement Pumps Market Volume (K Unit) Forecast, by Application 2020 & 2033
- Table 81: India APAC Positive Displacement Pumps Market Revenue (million) Forecast, by Application 2020 & 2033
- Table 82: India APAC Positive Displacement Pumps Market Volume (K Unit) Forecast, by Application 2020 & 2033
- Table 83: Japan APAC Positive Displacement Pumps Market Revenue (million) Forecast, by Application 2020 & 2033
- Table 84: Japan APAC Positive Displacement Pumps Market Volume (K Unit) Forecast, by Application 2020 & 2033
- Table 85: South Korea APAC Positive Displacement Pumps Market Revenue (million) Forecast, by Application 2020 & 2033
- Table 86: South Korea APAC Positive Displacement Pumps Market Volume (K Unit) Forecast, by Application 2020 & 2033
- Table 87: ASEAN APAC Positive Displacement Pumps Market Revenue (million) Forecast, by Application 2020 & 2033
- Table 88: ASEAN APAC Positive Displacement Pumps Market Volume (K Unit) Forecast, by Application 2020 & 2033
- Table 89: Oceania APAC Positive Displacement Pumps Market Revenue (million) Forecast, by Application 2020 & 2033
- Table 90: Oceania APAC Positive Displacement Pumps Market Volume (K Unit) Forecast, by Application 2020 & 2033
- Table 91: Rest of Asia Pacific APAC Positive Displacement Pumps Market Revenue (million) Forecast, by Application 2020 & 2033
- Table 92: Rest of Asia Pacific APAC Positive Displacement Pumps Market Volume (K Unit) Forecast, by Application 2020 & 2033
Frequently Asked Questions
1. What is the projected Compound Annual Growth Rate (CAGR) of the APAC Positive Displacement Pumps Market?
The projected CAGR is approximately 5.4%.
2. Which companies are prominent players in the APAC Positive Displacement Pumps Market?
Key companies in the market include The Weir Group PLC, Xylem Inc, KSB SE & Co KGaA, SPX Flow Inc, NETZSCH Holding, TSURUMI MANUFACTURING CO LTD , Sulzer AG, Pentair PLC, Atlas Copco, GRUNDFOS.
3. What are the main segments of the APAC Positive Displacement Pumps Market?
The market segments include Type, End-user Industry.
4. Can you provide details about the market size?
The market size is estimated to be USD 20721.9 million as of 2022.
5. What are some drivers contributing to market growth?
Increased Focus on Wastewater Management.
6. What are the notable trends driving market growth?
Waste and Wastewater Industry is Expected to Register Significant Growth.
7. Are there any restraints impacting market growth?
Environmental and Safe Use Concerns.
8. Can you provide examples of recent developments in the market?
February 2022 - NETZSCH Pumps and Systems announced the expansion of its product portfolio with the launch of the PERIPRO peristaltic pump. The pump model is available in chemical, industrial, and food versions. Moreover, the newly launched product complements the company's well-known technologies of NEMO progressing cavity pumps, NOTOS multi screw pumps, and TORNADO rotary lobe pumps.
9. What pricing options are available for accessing the report?
Pricing options include single-user, multi-user, and enterprise licenses priced at USD 4750, USD 4950, and USD 6800 respectively.
10. Is the market size provided in terms of value or volume?
The market size is provided in terms of value, measured in million and volume, measured in K Unit.
11. Are there any specific market keywords associated with the report?
Yes, the market keyword associated with the report is "APAC Positive Displacement Pumps Market," which aids in identifying and referencing the specific market segment covered.
12. How do I determine which pricing option suits my needs best?
The pricing options vary based on user requirements and access needs. Individual users may opt for single-user licenses, while businesses requiring broader access may choose multi-user or enterprise licenses for cost-effective access to the report.
13. Are there any additional resources or data provided in the APAC Positive Displacement Pumps Market report?
While the report offers comprehensive insights, it's advisable to review the specific contents or supplementary materials provided to ascertain if additional resources or data are available.
14. How can I stay updated on further developments or reports in the APAC Positive Displacement Pumps Market?
To stay informed about further developments, trends, and reports in the APAC Positive Displacement Pumps Market, consider subscribing to industry newsletters, following relevant companies and organizations, or regularly checking reputable industry news sources and publications.
Methodology
Step 1 - Identification of Relevant Samples Size from Population Database


Step 2 - Approaches for Defining Global Market Size (Value, Volume* & Price*)

Note*: In applicable scenarios
Step 3 - Data Sources
Primary Research
- Web Analytics
- Survey Reports
- Research Institute
- Latest Research Reports
- Opinion Leaders
Secondary Research
- Annual Reports
- White Paper
- Latest Press Release
- Industry Association
- Paid Database
- Investor Presentations

Step 4 - Data Triangulation
Involves using different sources of information in order to increase the validity of a study
These sources are likely to be stakeholders in a program - participants, other researchers, program staff, other community members, and so on.
Then we put all data in single framework & apply various statistical tools to find out the dynamic on the market.
During the analysis stage, feedback from the stakeholder groups would be compared to determine areas of agreement as well as areas of divergence