Key Insights
The Asia-Pacific (APAC) Scale Inhibitors Market is projected for substantial growth, reaching an estimated $3.98 billion by 2025, with a CAGR of 5.1% through 2033. This expansion is driven by increasing demand for industrial water treatment solutions in sectors such as power generation, oil refining, and chemical manufacturing. Regional industrialization and stringent environmental regulations promoting efficient water management are key growth catalysts. Scale inhibitors are vital for preventing mineral deposits, enhancing operational efficiency, and protecting equipment, thereby ensuring continuity and cost savings. Emerging APAC economies are significantly investing in infrastructure and industrial capacity, boosting the need for advanced water treatment chemicals. Market segmentation includes Scale & Corrosion Inhibitors, Coagulants & Flocculants, and pH Boosters, reflecting diverse treatment requirements. The prevalence of Blended/Specialty Chemicals underscores a trend towards customized, high-performance solutions.
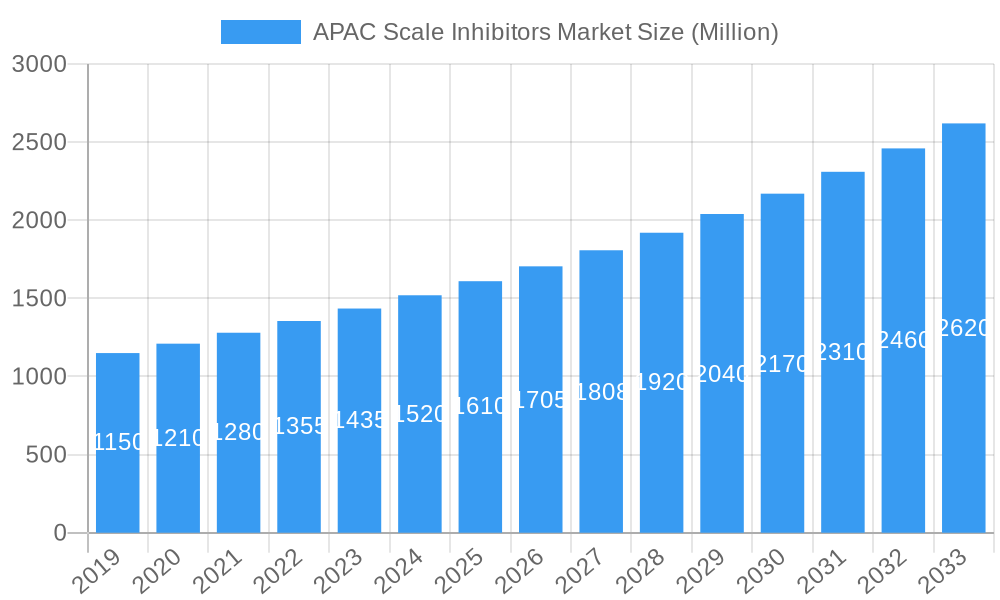
APAC Scale Inhibitors Market Market Size (In Billion)
Key market trends include a heightened focus on sustainable water management and the development of eco-friendly inhibitor formulations. Companies are prioritizing R&D to deliver solutions with minimal environmental impact, aligning with global sustainability objectives. China and India are expected to lead market growth due to their extensive industrial bases and growing water scarcity concerns. ASEAN nations also present significant expansion opportunities. While strong growth drivers exist, potential challenges include raw material price volatility and intense market competition. Nevertheless, the persistent need for operational efficiency, asset protection, and regulatory compliance in sectors like power generation, steel, and oil refineries will sustain demand, ensuring a dynamic outlook for APAC's scale inhibitor market.
APAC Scale Inhibitors Market Company Market Share
This comprehensive market analysis details the APAC Scale Inhibitors Market's historical performance, current dynamics, and future growth. Utilizing advanced analytics and extensive research, this report offers critical insights into market concentration, innovation, regulatory landscapes, product advancements, and competitive strategies. The market is segmented by Type, Chemistry, End-user Industry, and Geography, with robust forecasts and actionable intelligence for stakeholders. The study covers the period from 2019 to 2033, with 2025 as the base year and estimated year, and forecasts from 2025 to 2033, building on 2019-2024 historical data.
APAC Scale Inhibitors Market Market Concentration & Innovation
The APAC Scale Inhibitors Market exhibits a moderately consolidated structure, with a few dominant players holding significant market share. Innovation is a critical differentiator, driven by the escalating demand for advanced water treatment solutions, stricter environmental regulations, and the need for enhanced operational efficiency across various industrial sectors. Key innovation drivers include the development of eco-friendly and biodegradable scale inhibitors, multifunctional formulations offering combined scale and corrosion inhibition, and specialized chemistries tailored for specific challenging water conditions. Regulatory frameworks, such as evolving wastewater discharge standards and chemical safety regulations across countries like China, India, and Japan, are increasingly influencing product development and market entry strategies. The threat of product substitutes, while present in the form of alternative water treatment methods, is mitigated by the cost-effectiveness and targeted efficacy of scale inhibitors. End-user trends, particularly the growing emphasis on water conservation and sustainable industrial practices, are propelling the adoption of advanced scale inhibition technologies. Mergers and acquisitions (M&A) activities, while not extensively documented with public deal values for this specific segment, are expected to play a role in market consolidation and expansion, as larger players seek to acquire innovative technologies or gain market access. For instance, a hypothetical M&A deal could involve a major player acquiring a specialized scale inhibitor manufacturer in the ASEAN region for an estimated XX Million, aiming to bolster their product portfolio and geographic reach.
APAC Scale Inhibitors Market Industry Trends & Insights
The APAC Scale Inhibitors Market is poised for substantial growth, driven by a confluence of robust industrial expansion, increasing water scarcity, and the imperative for efficient industrial operations. The market is projected to witness a Compound Annual Growth Rate (CAGR) of approximately 5.8% from 2025 to 2033, reaching an estimated market size of over XX Million by 2033. This growth is underpinned by several key trends. Firstly, the rapidly industrializing economies of China and India are major consumers of scale inhibitors, fueled by massive investments in infrastructure, manufacturing, and energy sectors. The escalating demand for clean water and the need to protect critical industrial assets from scale deposition, which can lead to significant operational inefficiencies and costly downtime, are primary market drivers. Technological disruptions are also playing a crucial role. The development of advanced chemistries, such as phosphonates, polymers, and sophisticated blended formulations, offers enhanced performance and environmental profiles, catering to the evolving needs of end-users. The shift towards more sustainable and environmentally friendly chemical solutions is a significant consumer preference, pushing manufacturers to invest in R&D for biodegradable and low-toxicity scale inhibitors. Competitive dynamics are intensifying, with both global chemical giants and regional specialized manufacturers vying for market share. Strategic partnerships, product innovation, and a focus on customer-centric solutions are key strategies being employed by leading players. The increasing adoption of smart water management systems, which often integrate scale inhibitor dosing based on real-time water quality data, is another emerging trend that will shape the market's future. The penetration of advanced scale inhibitors is expected to increase significantly as industries across the APAC region prioritize water resource management and operational longevity of their equipment. For example, in the power generation sector, the demand for scale inhibitors is directly linked to the operational efficiency and lifespan of boilers and cooling towers, a critical concern across the region's expanding energy infrastructure.
Dominant Markets & Segments in APAC Scale Inhibitors Market
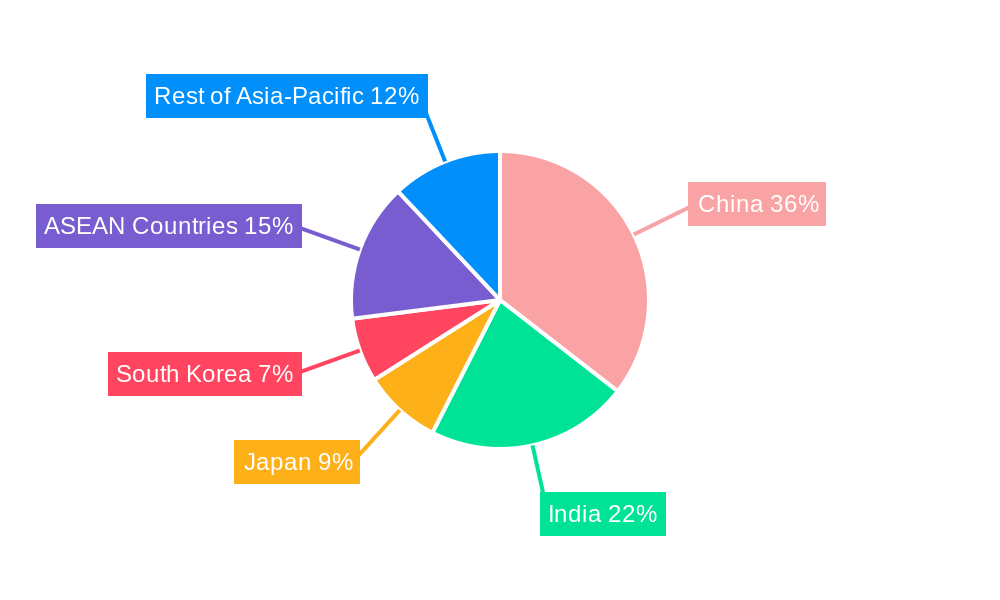
The APAC Scale Inhibitors Market is characterized by distinct regional and segment dominance. China stands out as the largest and fastest-growing market, primarily due to its colossal industrial base, extensive manufacturing activities, and significant investments in the power generation, oil refining, and chemical sectors. Favorable government policies promoting industrial growth and water resource management further bolster its position. Following closely, India presents a robust growth opportunity, driven by its rapid industrialization, increasing demand for clean water in the textile, sugar, and paper industries, and a growing emphasis on improving water use efficiency.
Scale & Corrosion Inhibitors represent the most dominant segment by Type, directly addressing the core need to prevent mineral scale buildup and metal corrosion in critical industrial equipment. This segment is crucial for maintaining the operational integrity and longevity of assets across all major end-user industries.
In terms of Chemistry, Blended/Specialty Chemicals are gaining significant traction, offering tailored solutions with superior performance and environmental benefits compared to basic chemicals. These customized formulations cater to specific operational challenges and regulatory requirements.
Among End-user Industries, Power Generation is a leading consumer of scale inhibitors, owing to the immense water volumes used in cooling towers and boilers. The drive for operational efficiency and the prevention of costly downtime make this sector a consistent and significant market. The Oil Refinery and Chemical & Petrochemical industries also represent substantial markets, where the prevention of scale deposition is critical for maintaining process efficiency and preventing equipment damage in high-temperature and high-pressure environments.
- Key Drivers for Dominance:
- China: Massive industrial output, significant investments in infrastructure and energy, supportive government policies for industrial development, and growing environmental awareness.
- India: Rapid industrialization across diverse sectors, increasing demand for water treatment solutions, and a growing focus on sustainability and resource efficiency.
- Scale & Corrosion Inhibitors: Essential for maintaining operational integrity and preventing asset degradation in virtually all industrial water systems.
- Blended/Specialty Chemicals: Offer superior performance, cost-effectiveness, and environmental compliance, meeting the nuanced needs of modern industries.
- Power Generation: High water consumption, critical need for uninterrupted operations, and focus on energy efficiency and asset protection.
- Oil Refinery & Chemical & Petrochemical: Demanding operational conditions necessitate robust scale and corrosion management for safety and efficiency.
The dominance in these segments is driven by specific factors. For instance, in Power Generation, the sheer scale of operations and the continuous need for efficient heat transfer make effective scale inhibition a non-negotiable requirement. Similarly, in the Oil & Gas sector, the prevention of fouling and corrosion in pipelines and refining equipment is paramount for safety and productivity. The shift towards blended chemicals reflects a move up the value chain, as industries seek more effective and environmentally conscious solutions that go beyond basic chemical treatments.
APAC Scale Inhibitors Market Product Developments
Product development in the APAC Scale Inhibitors Market is characterized by an increasing focus on environmentally sustainable formulations, enhanced performance under extreme conditions, and multifunctional capabilities. Innovations are geared towards biodegradable scale inhibitors that minimize ecological impact, alongside advanced chemistries like highly efficient polymeric dispersants and scale inhibitors designed for high-salinity or high-temperature environments. Companies are also developing smart scale inhibitor formulations that can be precisely dosed based on real-time water quality monitoring, leading to optimized chemical usage and cost savings. These product developments offer competitive advantages by enabling clients to meet stringent environmental regulations, reduce operational costs, and extend the lifespan of critical equipment. The market is witnessing a trend towards integrated solutions that combine scale inhibition with corrosion control and microbial management.
Report Scope & Segmentation Analysis
This report meticulously analyzes the APAC Scale Inhibitors Market segmented across several critical dimensions. The Type segmentation includes Scale & Corrosion Inhibitors, Coagulants & Flocculants, pH Boosters, Oxygen Scavengers, and Others. Each segment's market size and projected growth are detailed, with Scale & Corrosion Inhibitors expected to dominate due to their widespread application. The Chemistry segmentation categorizes the market into Basic Chemicals and Blended/Specialty Chemicals, with Blended/Specialty Chemicals projected to exhibit higher growth rates owing to their advanced functionalities. The End-user Industry segmentation covers Power Generation, Steel & Metal Industry, Oil Refinery, Chemical & Petrochemical, Textile & Dye Industry, Sugar Mill, Paper Mill, Food & Beverage, Institutional, Pharmaceutical, and Others. Power Generation and Oil Refinery are anticipated to be the largest segments. Geographically, the report delves into China, India, Japan, South Korea, ASEAN Countries, and the Rest of Asia-Pacific, with China and India expected to lead in market size and growth. The competitive landscape within each segment is also analyzed.
Key Drivers of APAC Scale Inhibitors Market Growth
The APAC Scale Inhibitors Market growth is propelled by several interconnected factors. Rapid industrialization and urbanization across the region are leading to increased demand for water treatment solutions in sectors like power generation, manufacturing, and oil & gas. Escalating water scarcity and the growing imperative for efficient water management are driving industries to adopt advanced technologies that minimize water consumption and waste. Stringent environmental regulations, particularly concerning water discharge quality and chemical safety, are pushing manufacturers and end-users towards more eco-friendly and compliant scale inhibitor formulations. Technological advancements in chemical formulations, offering improved efficacy and reduced environmental impact, also act as significant growth catalysts. Furthermore, the increasing focus on operational efficiency and asset longevity across industries compels investments in scale inhibition to prevent costly downtime and maintenance.
Challenges in the APAC Scale Inhibitors Market Sector
Despite robust growth prospects, the APAC Scale Inhibitors Market faces several challenges. The highly fragmented nature of some end-user industries, especially in developing economies, can lead to price sensitivity and resistance to adopting premium, advanced scale inhibitor solutions. Fluctuations in raw material prices, particularly for key chemical components, can impact manufacturing costs and profitability. Regulatory complexities and varying enforcement standards across different APAC countries can create hurdles for market entry and product standardization. Furthermore, the presence of counterfeit or substandard products in certain markets can undermine the credibility of genuine scale inhibitors and pose risks to industrial operations. Supply chain disruptions, exacerbated by geopolitical events or localized logistical challenges, can also affect the availability and timely delivery of critical chemicals.
Emerging Opportunities in APAC Scale Inhibitors Market
The APAC Scale Inhibitors Market presents significant emerging opportunities. The growing adoption of digital water management systems and the Industrial Internet of Things (IIoT) is creating demand for intelligent scale inhibitors that can be dynamically dosed and monitored remotely. The increasing focus on circular economy principles and sustainable manufacturing practices is opening avenues for biodegradable and bio-based scale inhibitors. Untapped potential exists in the rapidly developing economies within the ASEAN region, where industrialization is accelerating, and the demand for effective water treatment solutions is on the rise. Furthermore, the increasing emphasis on preventative maintenance and asset protection across all industrial sectors creates a sustained demand for high-performance scale inhibition technologies. The development of specialized scale inhibitors for niche applications, such as in the food & beverage processing or pharmaceutical industries where hygiene and regulatory compliance are paramount, also offers lucrative growth avenues.
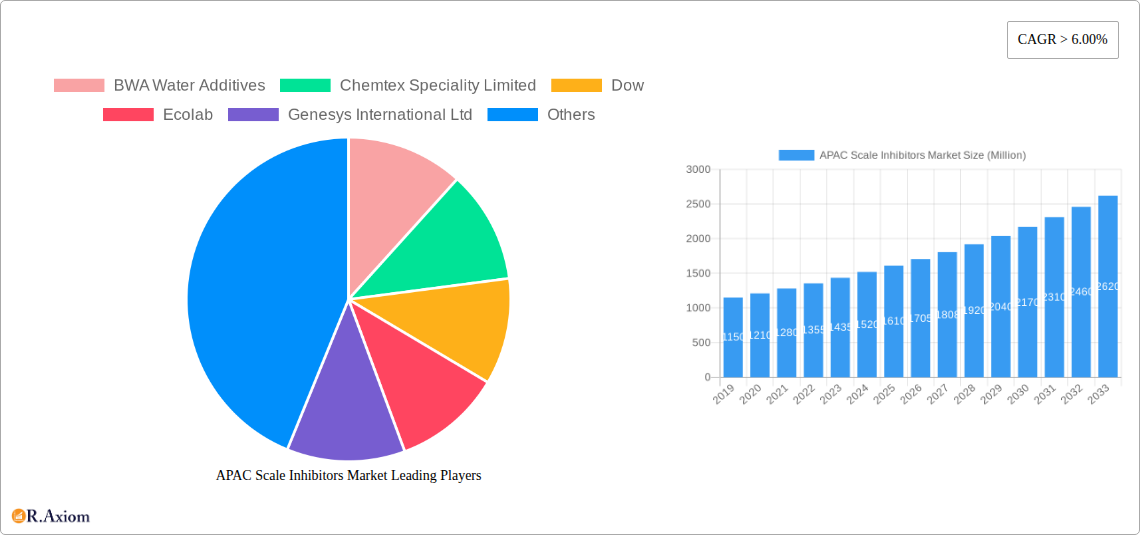
Leading Players in the APAC Scale Inhibitors Market Market
- BWA Water Additives
- Chemtex Speciality Limited
- Dow
- Ecolab
- Genesys International Ltd
- Ion Exchange India Limited
- Italmatch Chemicals S P A
- Kemira
- King Lee Technologies
- Kurita Water Industries Ltd
- Solenis
- Suez
- Thermax Ltd
Key Developments in APAC Scale Inhibitors Market Industry
- 2024/03: Solenis launches a new line of environmentally friendly scale inhibitors designed for the pulp and paper industry.
- 2023/11: Ecolab expands its water treatment solutions portfolio in Southeast Asia, focusing on sustainable scale inhibition technologies for industrial applications.
- 2023/07: Dow introduces advanced polymeric scale inhibitors with enhanced thermal stability for oil and gas applications in China.
- 2023/02: Kemira invests in expanding its production capacity for specialty chemicals in India to meet growing regional demand for scale inhibitors.
- 2022/10: Kurita Water Industries Ltd announces a strategic partnership to develop smart water management solutions incorporating advanced scale inhibition for the power sector in Japan.
- 2022/05: BWA Water Additives acquires a regional distributor to strengthen its market presence in the ASEAN countries.
Strategic Outlook for APAC Scale Inhibitors Market Market
The strategic outlook for the APAC Scale Inhibitors Market is highly positive, characterized by sustained demand driven by industrial growth and the critical need for efficient water management. Key growth catalysts include ongoing investments in infrastructure and manufacturing across emerging economies, coupled with increasingly stringent environmental regulations that favor advanced and sustainable chemical solutions. Companies that focus on innovation in eco-friendly formulations, high-performance chemistries, and integrated water treatment solutions will be well-positioned for success. Strategic expansion into underserved markets within the ASEAN region and the development of customized solutions for specific industrial challenges will be crucial. Furthermore, embracing digital transformation and offering data-driven water management services alongside scale inhibitor products will enhance competitive advantage and customer retention. The market is expected to witness continued consolidation and strategic collaborations to leverage synergies and expand market reach.
APAC Scale Inhibitors Market Segmentation
-
1. Type
- 1.1. Scale & Corrosion Inhibitors
- 1.2. Coagulants & Flocculants
- 1.3. pH Boosters
- 1.4. Oxygen Scavengers
- 1.5. Others
-
2. Chemistry
- 2.1. Basic Chemicals
- 2.2. Blended/Specialty Chemicals
-
3. End-user Industry
- 3.1. Power Generation
- 3.2. Steel & Metal Industry
- 3.3. Oil Refinery
- 3.4. Chemical & Petrochemical
- 3.5. Textile & Dye Industry
- 3.6. Sugar Mill
- 3.7. Paper Mill
- 3.8. Food & Beverage
- 3.9. Institutional
- 3.10. Pharmaceutical
- 3.11. Others
-
4. Geography
- 4.1. China
- 4.2. India
- 4.3. Japan
- 4.4. South Korea
- 4.5. ASEAN Countries
- 4.6. Rest of Asia-Pacific
APAC Scale Inhibitors Market Segmentation By Geography
- 1. China
- 2. India
- 3. Japan
- 4. South Korea
- 5. ASEAN Countries
- 6. Rest of Asia Pacific
APAC Scale Inhibitors Market Regional Market Share
Geographic Coverage of APAC Scale Inhibitors Market
APAC Scale Inhibitors Market REPORT HIGHLIGHTS
| Aspects | Details |
|---|---|
| Study Period | 2020-2034 |
| Base Year | 2025 |
| Estimated Year | 2026 |
| Forecast Period | 2026-2034 |
| Historical Period | 2020-2025 |
| Growth Rate | CAGR of 5.1% from 2020-2034 |
| Segmentation |
|
Table of Contents
- 1. Introduction
- 1.1. Research Scope
- 1.2. Market Segmentation
- 1.3. Research Objective
- 1.4. Definitions and Assumptions
- 2. Executive Summary
- 2.1. Market Snapshot
- 3. Market Dynamics
- 3.1. Market Drivers
- 3.2. Market Restrains
- 3.3. Market Trends
- 3.4. Market Opportunities
- 4. Market Factor Analysis
- 4.1. Porters Five Forces
- 4.1.1. Bargaining Power of Suppliers
- 4.1.2. Bargaining Power of Buyers
- 4.1.3. Threat of New Entrants
- 4.1.4. Threat of Substitutes
- 4.1.5. Competitive Rivalry
- 4.2. PESTEL analysis
- 4.3. BCG Analysis
- 4.3.1. Stars (High Growth, High Market Share)
- 4.3.2. Cash Cows (Low Growth, High Market Share)
- 4.3.3. Question Mark (High Growth, Low Market Share)
- 4.3.4. Dogs (Low Growth, Low Market Share)
- 4.4. Ansoff Matrix Analysis
- 4.5. Supply Chain Analysis
- 4.6. Regulatory Landscape
- 4.7. Current Market Potential and Opportunity Assessment (TAM–SAM–SOM Framework)
- 4.8. RAX Analyst Note
- 4.1. Porters Five Forces
- 5. Market Analysis, Insights and Forecast 2021-2033
- 5.1. Market Analysis, Insights and Forecast - by Type
- 5.1.1. Scale & Corrosion Inhibitors
- 5.1.2. Coagulants & Flocculants
- 5.1.3. pH Boosters
- 5.1.4. Oxygen Scavengers
- 5.1.5. Others
- 5.2. Market Analysis, Insights and Forecast - by Chemistry
- 5.2.1. Basic Chemicals
- 5.2.2. Blended/Specialty Chemicals
- 5.3. Market Analysis, Insights and Forecast - by End-user Industry
- 5.3.1. Power Generation
- 5.3.2. Steel & Metal Industry
- 5.3.3. Oil Refinery
- 5.3.4. Chemical & Petrochemical
- 5.3.5. Textile & Dye Industry
- 5.3.6. Sugar Mill
- 5.3.7. Paper Mill
- 5.3.8. Food & Beverage
- 5.3.9. Institutional
- 5.3.10. Pharmaceutical
- 5.3.11. Others
- 5.4. Market Analysis, Insights and Forecast - by Geography
- 5.4.1. China
- 5.4.2. India
- 5.4.3. Japan
- 5.4.4. South Korea
- 5.4.5. ASEAN Countries
- 5.4.6. Rest of Asia-Pacific
- 5.5. Market Analysis, Insights and Forecast - by Region
- 5.5.1. China
- 5.5.2. India
- 5.5.3. Japan
- 5.5.4. South Korea
- 5.5.5. ASEAN Countries
- 5.5.6. Rest of Asia Pacific
- 5.1. Market Analysis, Insights and Forecast - by Type
- 6. Global APAC Scale Inhibitors Market Analysis, Insights and Forecast, 2021-2033
- 6.1. Market Analysis, Insights and Forecast - by Type
- 6.1.1. Scale & Corrosion Inhibitors
- 6.1.2. Coagulants & Flocculants
- 6.1.3. pH Boosters
- 6.1.4. Oxygen Scavengers
- 6.1.5. Others
- 6.2. Market Analysis, Insights and Forecast - by Chemistry
- 6.2.1. Basic Chemicals
- 6.2.2. Blended/Specialty Chemicals
- 6.3. Market Analysis, Insights and Forecast - by End-user Industry
- 6.3.1. Power Generation
- 6.3.2. Steel & Metal Industry
- 6.3.3. Oil Refinery
- 6.3.4. Chemical & Petrochemical
- 6.3.5. Textile & Dye Industry
- 6.3.6. Sugar Mill
- 6.3.7. Paper Mill
- 6.3.8. Food & Beverage
- 6.3.9. Institutional
- 6.3.10. Pharmaceutical
- 6.3.11. Others
- 6.4. Market Analysis, Insights and Forecast - by Geography
- 6.4.1. China
- 6.4.2. India
- 6.4.3. Japan
- 6.4.4. South Korea
- 6.4.5. ASEAN Countries
- 6.4.6. Rest of Asia-Pacific
- 6.1. Market Analysis, Insights and Forecast - by Type
- 7. China APAC Scale Inhibitors Market Analysis, Insights and Forecast, 2020-2032
- 7.1. Market Analysis, Insights and Forecast - by Type
- 7.1.1. Scale & Corrosion Inhibitors
- 7.1.2. Coagulants & Flocculants
- 7.1.3. pH Boosters
- 7.1.4. Oxygen Scavengers
- 7.1.5. Others
- 7.2. Market Analysis, Insights and Forecast - by Chemistry
- 7.2.1. Basic Chemicals
- 7.2.2. Blended/Specialty Chemicals
- 7.3. Market Analysis, Insights and Forecast - by End-user Industry
- 7.3.1. Power Generation
- 7.3.2. Steel & Metal Industry
- 7.3.3. Oil Refinery
- 7.3.4. Chemical & Petrochemical
- 7.3.5. Textile & Dye Industry
- 7.3.6. Sugar Mill
- 7.3.7. Paper Mill
- 7.3.8. Food & Beverage
- 7.3.9. Institutional
- 7.3.10. Pharmaceutical
- 7.3.11. Others
- 7.4. Market Analysis, Insights and Forecast - by Geography
- 7.4.1. China
- 7.4.2. India
- 7.4.3. Japan
- 7.4.4. South Korea
- 7.4.5. ASEAN Countries
- 7.4.6. Rest of Asia-Pacific
- 7.1. Market Analysis, Insights and Forecast - by Type
- 8. India APAC Scale Inhibitors Market Analysis, Insights and Forecast, 2020-2032
- 8.1. Market Analysis, Insights and Forecast - by Type
- 8.1.1. Scale & Corrosion Inhibitors
- 8.1.2. Coagulants & Flocculants
- 8.1.3. pH Boosters
- 8.1.4. Oxygen Scavengers
- 8.1.5. Others
- 8.2. Market Analysis, Insights and Forecast - by Chemistry
- 8.2.1. Basic Chemicals
- 8.2.2. Blended/Specialty Chemicals
- 8.3. Market Analysis, Insights and Forecast - by End-user Industry
- 8.3.1. Power Generation
- 8.3.2. Steel & Metal Industry
- 8.3.3. Oil Refinery
- 8.3.4. Chemical & Petrochemical
- 8.3.5. Textile & Dye Industry
- 8.3.6. Sugar Mill
- 8.3.7. Paper Mill
- 8.3.8. Food & Beverage
- 8.3.9. Institutional
- 8.3.10. Pharmaceutical
- 8.3.11. Others
- 8.4. Market Analysis, Insights and Forecast - by Geography
- 8.4.1. China
- 8.4.2. India
- 8.4.3. Japan
- 8.4.4. South Korea
- 8.4.5. ASEAN Countries
- 8.4.6. Rest of Asia-Pacific
- 8.1. Market Analysis, Insights and Forecast - by Type
- 9. Japan APAC Scale Inhibitors Market Analysis, Insights and Forecast, 2020-2032
- 9.1. Market Analysis, Insights and Forecast - by Type
- 9.1.1. Scale & Corrosion Inhibitors
- 9.1.2. Coagulants & Flocculants
- 9.1.3. pH Boosters
- 9.1.4. Oxygen Scavengers
- 9.1.5. Others
- 9.2. Market Analysis, Insights and Forecast - by Chemistry
- 9.2.1. Basic Chemicals
- 9.2.2. Blended/Specialty Chemicals
- 9.3. Market Analysis, Insights and Forecast - by End-user Industry
- 9.3.1. Power Generation
- 9.3.2. Steel & Metal Industry
- 9.3.3. Oil Refinery
- 9.3.4. Chemical & Petrochemical
- 9.3.5. Textile & Dye Industry
- 9.3.6. Sugar Mill
- 9.3.7. Paper Mill
- 9.3.8. Food & Beverage
- 9.3.9. Institutional
- 9.3.10. Pharmaceutical
- 9.3.11. Others
- 9.4. Market Analysis, Insights and Forecast - by Geography
- 9.4.1. China
- 9.4.2. India
- 9.4.3. Japan
- 9.4.4. South Korea
- 9.4.5. ASEAN Countries
- 9.4.6. Rest of Asia-Pacific
- 9.1. Market Analysis, Insights and Forecast - by Type
- 10. South Korea APAC Scale Inhibitors Market Analysis, Insights and Forecast, 2020-2032
- 10.1. Market Analysis, Insights and Forecast - by Type
- 10.1.1. Scale & Corrosion Inhibitors
- 10.1.2. Coagulants & Flocculants
- 10.1.3. pH Boosters
- 10.1.4. Oxygen Scavengers
- 10.1.5. Others
- 10.2. Market Analysis, Insights and Forecast - by Chemistry
- 10.2.1. Basic Chemicals
- 10.2.2. Blended/Specialty Chemicals
- 10.3. Market Analysis, Insights and Forecast - by End-user Industry
- 10.3.1. Power Generation
- 10.3.2. Steel & Metal Industry
- 10.3.3. Oil Refinery
- 10.3.4. Chemical & Petrochemical
- 10.3.5. Textile & Dye Industry
- 10.3.6. Sugar Mill
- 10.3.7. Paper Mill
- 10.3.8. Food & Beverage
- 10.3.9. Institutional
- 10.3.10. Pharmaceutical
- 10.3.11. Others
- 10.4. Market Analysis, Insights and Forecast - by Geography
- 10.4.1. China
- 10.4.2. India
- 10.4.3. Japan
- 10.4.4. South Korea
- 10.4.5. ASEAN Countries
- 10.4.6. Rest of Asia-Pacific
- 10.1. Market Analysis, Insights and Forecast - by Type
- 11. ASEAN Countries APAC Scale Inhibitors Market Analysis, Insights and Forecast, 2020-2032
- 11.1. Market Analysis, Insights and Forecast - by Type
- 11.1.1. Scale & Corrosion Inhibitors
- 11.1.2. Coagulants & Flocculants
- 11.1.3. pH Boosters
- 11.1.4. Oxygen Scavengers
- 11.1.5. Others
- 11.2. Market Analysis, Insights and Forecast - by Chemistry
- 11.2.1. Basic Chemicals
- 11.2.2. Blended/Specialty Chemicals
- 11.3. Market Analysis, Insights and Forecast - by End-user Industry
- 11.3.1. Power Generation
- 11.3.2. Steel & Metal Industry
- 11.3.3. Oil Refinery
- 11.3.4. Chemical & Petrochemical
- 11.3.5. Textile & Dye Industry
- 11.3.6. Sugar Mill
- 11.3.7. Paper Mill
- 11.3.8. Food & Beverage
- 11.3.9. Institutional
- 11.3.10. Pharmaceutical
- 11.3.11. Others
- 11.4. Market Analysis, Insights and Forecast - by Geography
- 11.4.1. China
- 11.4.2. India
- 11.4.3. Japan
- 11.4.4. South Korea
- 11.4.5. ASEAN Countries
- 11.4.6. Rest of Asia-Pacific
- 11.1. Market Analysis, Insights and Forecast - by Type
- 12. Rest of Asia Pacific APAC Scale Inhibitors Market Analysis, Insights and Forecast, 2020-2032
- 12.1. Market Analysis, Insights and Forecast - by Type
- 12.1.1. Scale & Corrosion Inhibitors
- 12.1.2. Coagulants & Flocculants
- 12.1.3. pH Boosters
- 12.1.4. Oxygen Scavengers
- 12.1.5. Others
- 12.2. Market Analysis, Insights and Forecast - by Chemistry
- 12.2.1. Basic Chemicals
- 12.2.2. Blended/Specialty Chemicals
- 12.3. Market Analysis, Insights and Forecast - by End-user Industry
- 12.3.1. Power Generation
- 12.3.2. Steel & Metal Industry
- 12.3.3. Oil Refinery
- 12.3.4. Chemical & Petrochemical
- 12.3.5. Textile & Dye Industry
- 12.3.6. Sugar Mill
- 12.3.7. Paper Mill
- 12.3.8. Food & Beverage
- 12.3.9. Institutional
- 12.3.10. Pharmaceutical
- 12.3.11. Others
- 12.4. Market Analysis, Insights and Forecast - by Geography
- 12.4.1. China
- 12.4.2. India
- 12.4.3. Japan
- 12.4.4. South Korea
- 12.4.5. ASEAN Countries
- 12.4.6. Rest of Asia-Pacific
- 12.1. Market Analysis, Insights and Forecast - by Type
- 13. Competitive Analysis
- 13.1. Company Profiles
- 13.1.1 BWA Water Additives
- 13.1.1.1. Company Overview
- 13.1.1.2. Products
- 13.1.1.3. Company Financials
- 13.1.1.4. SWOT Analysis
- 13.1.2 Chemtex Speciality Limited
- 13.1.2.1. Company Overview
- 13.1.2.2. Products
- 13.1.2.3. Company Financials
- 13.1.2.4. SWOT Analysis
- 13.1.3 Dow
- 13.1.3.1. Company Overview
- 13.1.3.2. Products
- 13.1.3.3. Company Financials
- 13.1.3.4. SWOT Analysis
- 13.1.4 Ecolab
- 13.1.4.1. Company Overview
- 13.1.4.2. Products
- 13.1.4.3. Company Financials
- 13.1.4.4. SWOT Analysis
- 13.1.5 Genesys International Ltd
- 13.1.5.1. Company Overview
- 13.1.5.2. Products
- 13.1.5.3. Company Financials
- 13.1.5.4. SWOT Analysis
- 13.1.6 Ion Exchange India Limited
- 13.1.6.1. Company Overview
- 13.1.6.2. Products
- 13.1.6.3. Company Financials
- 13.1.6.4. SWOT Analysis
- 13.1.7 Italmatch Chemicals S P A
- 13.1.7.1. Company Overview
- 13.1.7.2. Products
- 13.1.7.3. Company Financials
- 13.1.7.4. SWOT Analysis
- 13.1.8 Kemira
- 13.1.8.1. Company Overview
- 13.1.8.2. Products
- 13.1.8.3. Company Financials
- 13.1.8.4. SWOT Analysis
- 13.1.9 King Lee Technologies
- 13.1.9.1. Company Overview
- 13.1.9.2. Products
- 13.1.9.3. Company Financials
- 13.1.9.4. SWOT Analysis
- 13.1.10 Kurita Water Industries Ltd
- 13.1.10.1. Company Overview
- 13.1.10.2. Products
- 13.1.10.3. Company Financials
- 13.1.10.4. SWOT Analysis
- 13.1.11 Solenis
- 13.1.11.1. Company Overview
- 13.1.11.2. Products
- 13.1.11.3. Company Financials
- 13.1.11.4. SWOT Analysis
- 13.1.12 Suez
- 13.1.12.1. Company Overview
- 13.1.12.2. Products
- 13.1.12.3. Company Financials
- 13.1.12.4. SWOT Analysis
- 13.1.13 Thermax Ltd*List Not Exhaustive
- 13.1.13.1. Company Overview
- 13.1.13.2. Products
- 13.1.13.3. Company Financials
- 13.1.13.4. SWOT Analysis
- 13.1.1 BWA Water Additives
- 13.2. Market Entropy
- 13.2.1 Company's Key Areas Served
- 13.2.2 Recent Developments
- 13.3. Company Market Share Analysis 2025
- 13.3.1 Top 5 Companies Market Share Analysis
- 13.3.2 Top 3 Companies Market Share Analysis
- 13.4. List of Potential Customers
- 14. Research Methodology
List of Figures
- Figure 1: Global APAC Scale Inhibitors Market Revenue Breakdown (billion, %) by Region 2025 & 2033
- Figure 2: China APAC Scale Inhibitors Market Revenue (billion), by Type 2025 & 2033
- Figure 3: China APAC Scale Inhibitors Market Revenue Share (%), by Type 2025 & 2033
- Figure 4: China APAC Scale Inhibitors Market Revenue (billion), by Chemistry 2025 & 2033
- Figure 5: China APAC Scale Inhibitors Market Revenue Share (%), by Chemistry 2025 & 2033
- Figure 6: China APAC Scale Inhibitors Market Revenue (billion), by End-user Industry 2025 & 2033
- Figure 7: China APAC Scale Inhibitors Market Revenue Share (%), by End-user Industry 2025 & 2033
- Figure 8: China APAC Scale Inhibitors Market Revenue (billion), by Geography 2025 & 2033
- Figure 9: China APAC Scale Inhibitors Market Revenue Share (%), by Geography 2025 & 2033
- Figure 10: China APAC Scale Inhibitors Market Revenue (billion), by Country 2025 & 2033
- Figure 11: China APAC Scale Inhibitors Market Revenue Share (%), by Country 2025 & 2033
- Figure 12: India APAC Scale Inhibitors Market Revenue (billion), by Type 2025 & 2033
- Figure 13: India APAC Scale Inhibitors Market Revenue Share (%), by Type 2025 & 2033
- Figure 14: India APAC Scale Inhibitors Market Revenue (billion), by Chemistry 2025 & 2033
- Figure 15: India APAC Scale Inhibitors Market Revenue Share (%), by Chemistry 2025 & 2033
- Figure 16: India APAC Scale Inhibitors Market Revenue (billion), by End-user Industry 2025 & 2033
- Figure 17: India APAC Scale Inhibitors Market Revenue Share (%), by End-user Industry 2025 & 2033
- Figure 18: India APAC Scale Inhibitors Market Revenue (billion), by Geography 2025 & 2033
- Figure 19: India APAC Scale Inhibitors Market Revenue Share (%), by Geography 2025 & 2033
- Figure 20: India APAC Scale Inhibitors Market Revenue (billion), by Country 2025 & 2033
- Figure 21: India APAC Scale Inhibitors Market Revenue Share (%), by Country 2025 & 2033
- Figure 22: Japan APAC Scale Inhibitors Market Revenue (billion), by Type 2025 & 2033
- Figure 23: Japan APAC Scale Inhibitors Market Revenue Share (%), by Type 2025 & 2033
- Figure 24: Japan APAC Scale Inhibitors Market Revenue (billion), by Chemistry 2025 & 2033
- Figure 25: Japan APAC Scale Inhibitors Market Revenue Share (%), by Chemistry 2025 & 2033
- Figure 26: Japan APAC Scale Inhibitors Market Revenue (billion), by End-user Industry 2025 & 2033
- Figure 27: Japan APAC Scale Inhibitors Market Revenue Share (%), by End-user Industry 2025 & 2033
- Figure 28: Japan APAC Scale Inhibitors Market Revenue (billion), by Geography 2025 & 2033
- Figure 29: Japan APAC Scale Inhibitors Market Revenue Share (%), by Geography 2025 & 2033
- Figure 30: Japan APAC Scale Inhibitors Market Revenue (billion), by Country 2025 & 2033
- Figure 31: Japan APAC Scale Inhibitors Market Revenue Share (%), by Country 2025 & 2033
- Figure 32: South Korea APAC Scale Inhibitors Market Revenue (billion), by Type 2025 & 2033
- Figure 33: South Korea APAC Scale Inhibitors Market Revenue Share (%), by Type 2025 & 2033
- Figure 34: South Korea APAC Scale Inhibitors Market Revenue (billion), by Chemistry 2025 & 2033
- Figure 35: South Korea APAC Scale Inhibitors Market Revenue Share (%), by Chemistry 2025 & 2033
- Figure 36: South Korea APAC Scale Inhibitors Market Revenue (billion), by End-user Industry 2025 & 2033
- Figure 37: South Korea APAC Scale Inhibitors Market Revenue Share (%), by End-user Industry 2025 & 2033
- Figure 38: South Korea APAC Scale Inhibitors Market Revenue (billion), by Geography 2025 & 2033
- Figure 39: South Korea APAC Scale Inhibitors Market Revenue Share (%), by Geography 2025 & 2033
- Figure 40: South Korea APAC Scale Inhibitors Market Revenue (billion), by Country 2025 & 2033
- Figure 41: South Korea APAC Scale Inhibitors Market Revenue Share (%), by Country 2025 & 2033
- Figure 42: ASEAN Countries APAC Scale Inhibitors Market Revenue (billion), by Type 2025 & 2033
- Figure 43: ASEAN Countries APAC Scale Inhibitors Market Revenue Share (%), by Type 2025 & 2033
- Figure 44: ASEAN Countries APAC Scale Inhibitors Market Revenue (billion), by Chemistry 2025 & 2033
- Figure 45: ASEAN Countries APAC Scale Inhibitors Market Revenue Share (%), by Chemistry 2025 & 2033
- Figure 46: ASEAN Countries APAC Scale Inhibitors Market Revenue (billion), by End-user Industry 2025 & 2033
- Figure 47: ASEAN Countries APAC Scale Inhibitors Market Revenue Share (%), by End-user Industry 2025 & 2033
- Figure 48: ASEAN Countries APAC Scale Inhibitors Market Revenue (billion), by Geography 2025 & 2033
- Figure 49: ASEAN Countries APAC Scale Inhibitors Market Revenue Share (%), by Geography 2025 & 2033
- Figure 50: ASEAN Countries APAC Scale Inhibitors Market Revenue (billion), by Country 2025 & 2033
- Figure 51: ASEAN Countries APAC Scale Inhibitors Market Revenue Share (%), by Country 2025 & 2033
- Figure 52: Rest of Asia Pacific APAC Scale Inhibitors Market Revenue (billion), by Type 2025 & 2033
- Figure 53: Rest of Asia Pacific APAC Scale Inhibitors Market Revenue Share (%), by Type 2025 & 2033
- Figure 54: Rest of Asia Pacific APAC Scale Inhibitors Market Revenue (billion), by Chemistry 2025 & 2033
- Figure 55: Rest of Asia Pacific APAC Scale Inhibitors Market Revenue Share (%), by Chemistry 2025 & 2033
- Figure 56: Rest of Asia Pacific APAC Scale Inhibitors Market Revenue (billion), by End-user Industry 2025 & 2033
- Figure 57: Rest of Asia Pacific APAC Scale Inhibitors Market Revenue Share (%), by End-user Industry 2025 & 2033
- Figure 58: Rest of Asia Pacific APAC Scale Inhibitors Market Revenue (billion), by Geography 2025 & 2033
- Figure 59: Rest of Asia Pacific APAC Scale Inhibitors Market Revenue Share (%), by Geography 2025 & 2033
- Figure 60: Rest of Asia Pacific APAC Scale Inhibitors Market Revenue (billion), by Country 2025 & 2033
- Figure 61: Rest of Asia Pacific APAC Scale Inhibitors Market Revenue Share (%), by Country 2025 & 2033
List of Tables
- Table 1: Global APAC Scale Inhibitors Market Revenue billion Forecast, by Type 2020 & 2033
- Table 2: Global APAC Scale Inhibitors Market Revenue billion Forecast, by Chemistry 2020 & 2033
- Table 3: Global APAC Scale Inhibitors Market Revenue billion Forecast, by End-user Industry 2020 & 2033
- Table 4: Global APAC Scale Inhibitors Market Revenue billion Forecast, by Geography 2020 & 2033
- Table 5: Global APAC Scale Inhibitors Market Revenue billion Forecast, by Region 2020 & 2033
- Table 6: Global APAC Scale Inhibitors Market Revenue billion Forecast, by Type 2020 & 2033
- Table 7: Global APAC Scale Inhibitors Market Revenue billion Forecast, by Chemistry 2020 & 2033
- Table 8: Global APAC Scale Inhibitors Market Revenue billion Forecast, by End-user Industry 2020 & 2033
- Table 9: Global APAC Scale Inhibitors Market Revenue billion Forecast, by Geography 2020 & 2033
- Table 10: Global APAC Scale Inhibitors Market Revenue billion Forecast, by Country 2020 & 2033
- Table 11: Global APAC Scale Inhibitors Market Revenue billion Forecast, by Type 2020 & 2033
- Table 12: Global APAC Scale Inhibitors Market Revenue billion Forecast, by Chemistry 2020 & 2033
- Table 13: Global APAC Scale Inhibitors Market Revenue billion Forecast, by End-user Industry 2020 & 2033
- Table 14: Global APAC Scale Inhibitors Market Revenue billion Forecast, by Geography 2020 & 2033
- Table 15: Global APAC Scale Inhibitors Market Revenue billion Forecast, by Country 2020 & 2033
- Table 16: Global APAC Scale Inhibitors Market Revenue billion Forecast, by Type 2020 & 2033
- Table 17: Global APAC Scale Inhibitors Market Revenue billion Forecast, by Chemistry 2020 & 2033
- Table 18: Global APAC Scale Inhibitors Market Revenue billion Forecast, by End-user Industry 2020 & 2033
- Table 19: Global APAC Scale Inhibitors Market Revenue billion Forecast, by Geography 2020 & 2033
- Table 20: Global APAC Scale Inhibitors Market Revenue billion Forecast, by Country 2020 & 2033
- Table 21: Global APAC Scale Inhibitors Market Revenue billion Forecast, by Type 2020 & 2033
- Table 22: Global APAC Scale Inhibitors Market Revenue billion Forecast, by Chemistry 2020 & 2033
- Table 23: Global APAC Scale Inhibitors Market Revenue billion Forecast, by End-user Industry 2020 & 2033
- Table 24: Global APAC Scale Inhibitors Market Revenue billion Forecast, by Geography 2020 & 2033
- Table 25: Global APAC Scale Inhibitors Market Revenue billion Forecast, by Country 2020 & 2033
- Table 26: Global APAC Scale Inhibitors Market Revenue billion Forecast, by Type 2020 & 2033
- Table 27: Global APAC Scale Inhibitors Market Revenue billion Forecast, by Chemistry 2020 & 2033
- Table 28: Global APAC Scale Inhibitors Market Revenue billion Forecast, by End-user Industry 2020 & 2033
- Table 29: Global APAC Scale Inhibitors Market Revenue billion Forecast, by Geography 2020 & 2033
- Table 30: Global APAC Scale Inhibitors Market Revenue billion Forecast, by Country 2020 & 2033
- Table 31: Global APAC Scale Inhibitors Market Revenue billion Forecast, by Type 2020 & 2033
- Table 32: Global APAC Scale Inhibitors Market Revenue billion Forecast, by Chemistry 2020 & 2033
- Table 33: Global APAC Scale Inhibitors Market Revenue billion Forecast, by End-user Industry 2020 & 2033
- Table 34: Global APAC Scale Inhibitors Market Revenue billion Forecast, by Geography 2020 & 2033
- Table 35: Global APAC Scale Inhibitors Market Revenue billion Forecast, by Country 2020 & 2033
Frequently Asked Questions
1. What is the projected Compound Annual Growth Rate (CAGR) of the APAC Scale Inhibitors Market?
The projected CAGR is approximately 5.1%.
2. Which companies are prominent players in the APAC Scale Inhibitors Market?
Key companies in the market include BWA Water Additives, Chemtex Speciality Limited, Dow, Ecolab, Genesys International Ltd, Ion Exchange India Limited, Italmatch Chemicals S P A, Kemira, King Lee Technologies, Kurita Water Industries Ltd, Solenis, Suez, Thermax Ltd*List Not Exhaustive.
3. What are the main segments of the APAC Scale Inhibitors Market?
The market segments include Type, Chemistry, End-user Industry, Geography.
4. Can you provide details about the market size?
The market size is estimated to be USD 3.98 billion as of 2022.
5. What are some drivers contributing to market growth?
; Accelerating usage in Power Industry; Growing Popularity of Zero Liquid Blowdown.
6. What are the notable trends driving market growth?
Scale & Corrosion Inhibitors to Dominate the Market.
7. Are there any restraints impacting market growth?
; Accelerating usage in Power Industry; Growing Popularity of Zero Liquid Blowdown.
8. Can you provide examples of recent developments in the market?
N/A
9. What pricing options are available for accessing the report?
Pricing options include single-user, multi-user, and enterprise licenses priced at USD 4750, USD 5250, and USD 8750 respectively.
10. Is the market size provided in terms of value or volume?
The market size is provided in terms of value, measured in billion.
11. Are there any specific market keywords associated with the report?
Yes, the market keyword associated with the report is "APAC Scale Inhibitors Market," which aids in identifying and referencing the specific market segment covered.
12. How do I determine which pricing option suits my needs best?
The pricing options vary based on user requirements and access needs. Individual users may opt for single-user licenses, while businesses requiring broader access may choose multi-user or enterprise licenses for cost-effective access to the report.
13. Are there any additional resources or data provided in the APAC Scale Inhibitors Market report?
While the report offers comprehensive insights, it's advisable to review the specific contents or supplementary materials provided to ascertain if additional resources or data are available.
14. How can I stay updated on further developments or reports in the APAC Scale Inhibitors Market?
To stay informed about further developments, trends, and reports in the APAC Scale Inhibitors Market, consider subscribing to industry newsletters, following relevant companies and organizations, or regularly checking reputable industry news sources and publications.
Methodology
Step 1 - Identification of Relevant Samples Size from Population Database


Step 2 - Approaches for Defining Global Market Size (Value, Volume* & Price*)

Note*: In applicable scenarios
Step 3 - Data Sources
Primary Research
- Web Analytics
- Survey Reports
- Research Institute
- Latest Research Reports
- Opinion Leaders
Secondary Research
- Annual Reports
- White Paper
- Latest Press Release
- Industry Association
- Paid Database
- Investor Presentations

Step 4 - Data Triangulation
Involves using different sources of information in order to increase the validity of a study
These sources are likely to be stakeholders in a program - participants, other researchers, program staff, other community members, and so on.
Then we put all data in single framework & apply various statistical tools to find out the dynamic on the market.
During the analysis stage, feedback from the stakeholder groups would be compared to determine areas of agreement as well as areas of divergence

