

Key Insights
The Asia-Pacific (APAC) small cell tower market is experiencing significant expansion, driven by escalating demand for high-speed mobile broadband, the widespread adoption of 5G networks, and the increasing integration of IoT devices. Rapid population growth, accelerating urbanization, and high smartphone penetration within the region underscore the critical need for enhanced network capacity and coverage. This is especially pronounced in dense urban environments and underserved remote areas where traditional macrocell towers fall short. The market is segmented by component into hardware (e.g., antennas, radio units) and software (e.g., network management systems, optimization tools). Hardware currently commands the largest market share. Leading global technology providers like Ericsson, Nokia, Huawei, and Samsung are making substantial investments in research and development, fueling innovation in small cell technology and broadening their market influence. The projected 3.2% CAGR indicates sustained growth, anticipated to continue through 2033. Despite potential challenges related to regulatory frameworks and initial deployment expenditures, the substantial long-term advantages of superior network performance and coverage are driving continuous market advancement.
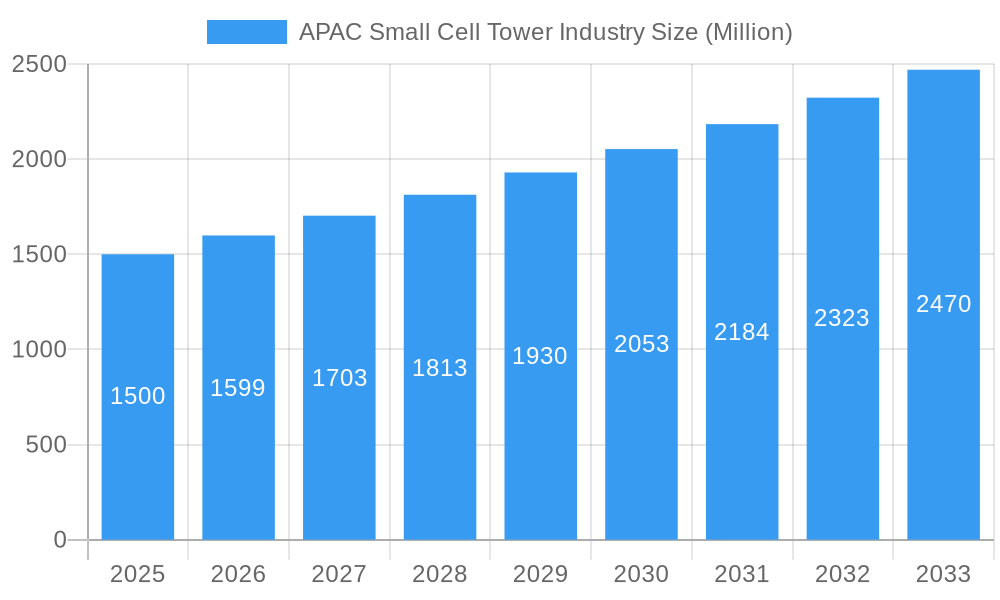
APAC Small Cell Tower Industry Market Size (In Billion)
The competitive arena features a blend of established international corporations and specialized regional vendors. This diversity in market participants fosters a wide array of products and services, promoting robust competition and potentially leading to cost efficiencies. However, the market also faces hurdles such as the considerable capital investment required for infrastructure modernization and the technical complexities of integrating small cell solutions into existing network architectures. Notwithstanding these obstacles, the APAC region's unique confluence of a large, digitally adept population, expanding 5G infrastructure, and significant investment in next-generation technologies positions it for substantial growth in the small cell tower market over the coming decade. This presents considerable opportunities for both established industry leaders and emerging companies aiming to leverage this dynamic market.
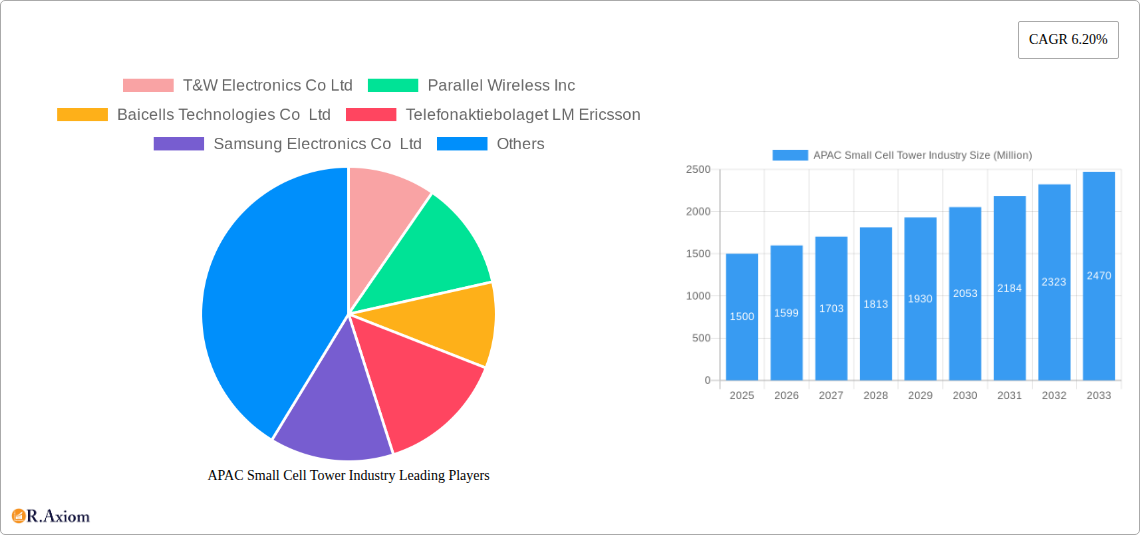
APAC Small Cell Tower Industry Company Market Share
This comprehensive analysis offers in-depth insights into the APAC small cell tower industry, providing valuable intelligence for stakeholders, investors, and industry professionals. The report covers the period 2019-2033, with a specific focus on the estimated market size of $30 billion in the base year of 2025 and a forecast period from 2025-2033. Key segments examined include Hardware and Software components. Prominent players profiled include T&W Electronics Co Ltd, Parallel Wireless Inc, Baicells Technologies Co Ltd, Telefonaktiebolaget LM Ericsson, Samsung Electronics Co Ltd, Nokia Corporation, NEC Corporation, Huawei Technologies Co Ltd, ZTE Corporation, and Airspan Networks Inc, among others. All market value data is presented in billions.
APAC Small Cell Tower Industry Market Concentration & Innovation
This section analyzes the competitive landscape of the APAC small cell tower market, assessing market concentration, innovation drivers, regulatory frameworks, product substitutes, end-user trends, and merger and acquisition (M&A) activities. The market is characterized by a moderate level of concentration, with a few dominant players and several smaller, niche players. Market share data for key players will be presented, showing a xx% share for the top three players in 2025, with projections for 2033 indicating a possible consolidation with the top three holding xx%.
Innovation is driven primarily by the demand for higher network capacity and coverage, particularly with the rollout of 5G networks. Stringent regulatory frameworks in several APAC countries are shaping the industry's development, influencing deployment strategies and technology adoption. Fiber optics and other wireless technologies represent key substitutes, creating competitive pressures. The increasing adoption of small cells in diverse end-user sectors like transportation, healthcare and smart cities is a strong growth driver. M&A activity has been moderate in recent years, with deal values totaling approximately xx Million in the period 2019-2024. Future M&A activity is projected to increase, driven by the need for scale and technological integration, with an estimated xx Million in deal value anticipated between 2025 and 2033.
APAC Small Cell Tower Industry Industry Trends & Insights
This section delves into the key trends and insights shaping the APAC small cell tower market. The market is experiencing robust growth, driven by the expanding adoption of 5G technology, increasing urbanization, and the growing demand for high-speed mobile broadband access. The compound annual growth rate (CAGR) for the period 2025-2033 is estimated to be xx%, fueled by government initiatives promoting digital infrastructure development across the region. Market penetration is expected to increase from xx% in 2025 to xx% by 2033. Technological disruptions, particularly the adoption of virtualization and software-defined networking (SDN), are transforming the industry, leading to increased efficiency and flexibility. Consumer preferences for seamless connectivity and higher data speeds are further driving market growth. Competitive dynamics are shaped by technological innovation, pricing strategies, and partnerships. The increasing deployment of private LTE and 5G networks in various industry verticals also significantly contributes to overall market expansion.
Dominant Markets & Segments in APAP Small Cell Tower Industry
This section identifies the leading regions, countries, and segments within the APAC small cell tower market. The analysis points towards China and India as the dominant markets, driven by their large populations, rapidly expanding mobile subscriber base, and supportive government policies. Other countries such as Japan, South Korea, and Australia are also showing strong growth.
By Component:
- Hardware: The hardware segment is the largest, driven by the need for physical infrastructure such as antennas, radio units, and baseband units. Key drivers include the substantial investment in 5G network infrastructure, the expanding network coverage requirements, and the high demand for small cell deployments in dense urban areas.
- Software: The software segment is experiencing a faster growth rate, driven by increasing demand for advanced network management and optimization tools, particularly with the rise of virtualized RAN (vRAN) and open RAN technologies. Key drivers here are the need for improved network efficiency, reduced operational costs, and the ability to support diverse network services.
Detailed dominance analysis, including factors like economic policies favoring technological advancement and supportive government infrastructure investment plans, will be provided for each segment and key regions.
APAC Small Cell Tower Industry Product Developments
Recent product innovations are largely focused on improving the efficiency, flexibility, and scalability of small cell solutions. This includes the development of virtualized RAN (vRAN) and open RAN architectures, enabling greater network flexibility and interoperability. The integration of advanced software features, such as AI-powered network optimization tools, further enhances the capabilities of small cell deployments. These innovations address the market need for efficient network management and cost optimization while supporting the evolving demands of 5G technologies and a wide range of applications.
Report Scope & Segmentation Analysis
This report provides a comprehensive segmentation analysis of the APAC small cell tower market, broken down by component: hardware and software.
Hardware: This segment encompasses the physical infrastructure of small cells, including antennas, radio units, and baseband units. Market size is estimated at xx Million in 2025, with a projected growth to xx Million by 2033. Competitive dynamics are characterized by intense rivalry among established vendors and emerging players, with pricing pressures and technological innovation being key factors.
Software: This segment includes software components such as network management systems, optimization tools, and virtualized RAN (vRAN) solutions. The market size is estimated at xx Million in 2025, with a projected growth to xx Million by 2033 driven by the ongoing digital transformation and increasing adoption of vRAN technologies. The competitive landscape is marked by the emergence of innovative software solutions offering enhanced network performance and operational efficiency.
Key Drivers of APAC Small Cell Tower Industry Growth
Several factors are driving the growth of the APAC small cell tower industry. These include:
- 5G Network Rollout: The widespread deployment of 5G networks is a significant driver, demanding widespread small cell deployment to support increased capacity and coverage.
- Increasing Smartphone Penetration: Rising smartphone adoption across the region fuels the demand for high-speed mobile data access, necessitating robust network infrastructure, including small cells.
- Government Initiatives: Various government initiatives promoting digital infrastructure development and smart city projects are accelerating small cell deployments.
- Growth of IoT Applications: The burgeoning Internet of Things (IoT) ecosystem requires dense network deployments, creating significant demand for small cells.
Challenges in the APAC Small Cell Tower Industry Sector
Several challenges hinder the growth of the APAC small cell tower industry.
- High Deployment Costs: The significant capital investment required for small cell deployment can be a barrier to entry for some operators and potential investors.
- Regulatory Hurdles: Complex regulatory environments and lengthy permitting processes in some countries can slow down deployment efforts.
- Site Acquisition Challenges: Securing suitable locations for small cell deployments can be challenging, particularly in dense urban areas.
- Competition: Intense competition among vendors leads to pricing pressure and limits margins.
Emerging Opportunities in APAP Small Cell Tower Industry
The APAC small cell tower industry presents several opportunities.
- Private LTE/5G Networks: Increasing adoption of private networks across various industries presents significant opportunities for small cell deployments.
- Smart City Initiatives: The growth of smart city projects creates a strong demand for advanced network infrastructure, including small cells.
- Open RAN Adoption: The increasing adoption of open RAN architectures is opening new opportunities for vendors and operators.
- Edge Computing: The rise of edge computing creates further opportunities for the deployment of small cells closer to end-users, improving network performance and responsiveness.
Leading Players in the APAC Small Cell Tower Industry Market
Key Developments in APAC Small Cell Tower Industry Industry
- November 2022: Airspan Networks Inc announced the commercial availability of new 5G indoor and outdoor products based on a flexible All-In-One (AIO) software platform, upgradeable to a disaggregated vRAN and Open RAN architecture. This expands their 5G portfolio and supports future network growth.
- January 2023: Telefonaktiebolaget LM Ericsson announced an expansion of its Private Network portfolio with NetCloud Private Networks, a software-defined solution targeting businesses in logistics, manufacturing, government, retail, healthcare, and hospitality. This signifies a move towards subscription-based services and expands their market reach.
Strategic Outlook for APAC Small Cell Tower Industry Market
The APAC small cell tower market is poised for significant growth over the forecast period. Driven by 5G deployment, increasing data consumption, and the rise of IoT, the market will continue to expand. Opportunities lie in the adoption of innovative technologies like vRAN and open RAN, the growth of private networks, and the development of smart city infrastructure. The focus on enhancing network efficiency, reducing operational costs, and providing superior connectivity will be crucial for success in this dynamic market.
APAC Small Cell Tower Industry Segmentation
- 1. Production Analysis
- 2. Consumption Analysis
- 3. Import Market Analysis (Value & Volume)
- 4. Export Market Analysis (Value & Volume)
- 5. Price Trend Analysis
APAC Small Cell Tower Industry Segmentation By Geography
-
1. North America
- 1.1. United States
- 1.2. Canada
- 1.3. Mexico
-
2. South America
- 2.1. Brazil
- 2.2. Argentina
- 2.3. Rest of South America
-
3. Europe
- 3.1. United Kingdom
- 3.2. Germany
- 3.3. France
- 3.4. Italy
- 3.5. Spain
- 3.6. Russia
- 3.7. Benelux
- 3.8. Nordics
- 3.9. Rest of Europe
-
4. Middle East & Africa
- 4.1. Turkey
- 4.2. Israel
- 4.3. GCC
- 4.4. North Africa
- 4.5. South Africa
- 4.6. Rest of Middle East & Africa
-
5. Asia Pacific
- 5.1. China
- 5.2. India
- 5.3. Japan
- 5.4. South Korea
- 5.5. ASEAN
- 5.6. Oceania
- 5.7. Rest of Asia Pacific
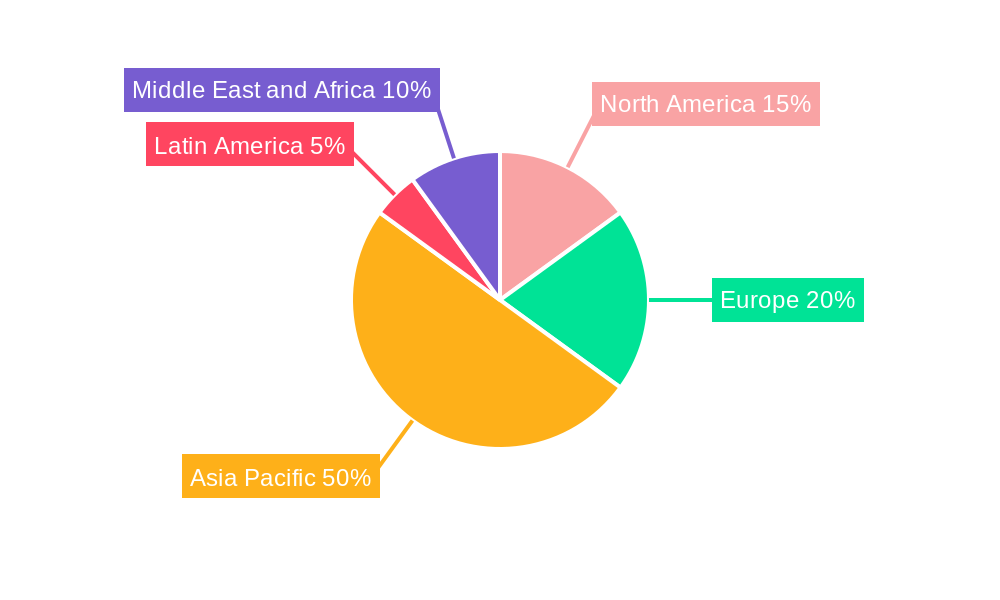
APAC Small Cell Tower Industry Regional Market Share
Geographic Coverage of APAC Small Cell Tower Industry
APAC Small Cell Tower Industry REPORT HIGHLIGHTS
| Aspects | Details |
|---|---|
| Study Period | 2020-2034 |
| Base Year | 2025 |
| Estimated Year | 2026 |
| Forecast Period | 2026-2034 |
| Historical Period | 2020-2025 |
| Growth Rate | CAGR of 3.2% from 2020-2034 |
| Segmentation |
|
Table of Contents
- 1. Introduction
- 1.1. Research Scope
- 1.2. Market Segmentation
- 1.3. Research Objective
- 1.4. Definitions and Assumptions
- 2. Executive Summary
- 2.1. Market Snapshot
- 3. Market Dynamics
- 3.1. Market Drivers
- 3.2. Market Restrains
- 3.3. Market Trends
- 3.4. Market Opportunities
- 4. Market Factor Analysis
- 4.1. Porters Five Forces
- 4.1.1. Bargaining Power of Suppliers
- 4.1.2. Bargaining Power of Buyers
- 4.1.3. Threat of New Entrants
- 4.1.4. Threat of Substitutes
- 4.1.5. Competitive Rivalry
- 4.2. PESTEL analysis
- 4.3. BCG Analysis
- 4.3.1. Stars (High Growth, High Market Share)
- 4.3.2. Cash Cows (Low Growth, High Market Share)
- 4.3.3. Question Mark (High Growth, Low Market Share)
- 4.3.4. Dogs (Low Growth, Low Market Share)
- 4.4. Ansoff Matrix Analysis
- 4.5. Supply Chain Analysis
- 4.6. Regulatory Landscape
- 4.7. Current Market Potential and Opportunity Assessment (TAM–SAM–SOM Framework)
- 4.8. RAX Analyst Note
- 4.1. Porters Five Forces
- 5. Market Analysis, Insights and Forecast 2021-2033
- 5.1. Market Analysis, Insights and Forecast - by Production Analysis
- 5.2. Market Analysis, Insights and Forecast - by Consumption Analysis
- 5.3. Market Analysis, Insights and Forecast - by Import Market Analysis (Value & Volume)
- 5.4. Market Analysis, Insights and Forecast - by Export Market Analysis (Value & Volume)
- 5.5. Market Analysis, Insights and Forecast - by Price Trend Analysis
- 5.6. Market Analysis, Insights and Forecast - by Region
- 5.6.1. North America
- 5.6.2. South America
- 5.6.3. Europe
- 5.6.4. Middle East & Africa
- 5.6.5. Asia Pacific
- 6. Global APAC Small Cell Tower Industry Analysis, Insights and Forecast, 2021-2033
- 6.1. Market Analysis, Insights and Forecast - by Production Analysis
- 6.2. Market Analysis, Insights and Forecast - by Consumption Analysis
- 6.3. Market Analysis, Insights and Forecast - by Import Market Analysis (Value & Volume)
- 6.4. Market Analysis, Insights and Forecast - by Export Market Analysis (Value & Volume)
- 6.5. Market Analysis, Insights and Forecast - by Price Trend Analysis
- 7. North America APAC Small Cell Tower Industry Analysis, Insights and Forecast, 2020-2032
- 7.1. Market Analysis, Insights and Forecast - by Production Analysis
- 7.2. Market Analysis, Insights and Forecast - by Consumption Analysis
- 7.3. Market Analysis, Insights and Forecast - by Import Market Analysis (Value & Volume)
- 7.4. Market Analysis, Insights and Forecast - by Export Market Analysis (Value & Volume)
- 7.5. Market Analysis, Insights and Forecast - by Price Trend Analysis
- 8. South America APAC Small Cell Tower Industry Analysis, Insights and Forecast, 2020-2032
- 8.1. Market Analysis, Insights and Forecast - by Production Analysis
- 8.2. Market Analysis, Insights and Forecast - by Consumption Analysis
- 8.3. Market Analysis, Insights and Forecast - by Import Market Analysis (Value & Volume)
- 8.4. Market Analysis, Insights and Forecast - by Export Market Analysis (Value & Volume)
- 8.5. Market Analysis, Insights and Forecast - by Price Trend Analysis
- 9. Europe APAC Small Cell Tower Industry Analysis, Insights and Forecast, 2020-2032
- 9.1. Market Analysis, Insights and Forecast - by Production Analysis
- 9.2. Market Analysis, Insights and Forecast - by Consumption Analysis
- 9.3. Market Analysis, Insights and Forecast - by Import Market Analysis (Value & Volume)
- 9.4. Market Analysis, Insights and Forecast - by Export Market Analysis (Value & Volume)
- 9.5. Market Analysis, Insights and Forecast - by Price Trend Analysis
- 10. Middle East & Africa APAC Small Cell Tower Industry Analysis, Insights and Forecast, 2020-2032
- 10.1. Market Analysis, Insights and Forecast - by Production Analysis
- 10.2. Market Analysis, Insights and Forecast - by Consumption Analysis
- 10.3. Market Analysis, Insights and Forecast - by Import Market Analysis (Value & Volume)
- 10.4. Market Analysis, Insights and Forecast - by Export Market Analysis (Value & Volume)
- 10.5. Market Analysis, Insights and Forecast - by Price Trend Analysis
- 11. Asia Pacific APAC Small Cell Tower Industry Analysis, Insights and Forecast, 2020-2032
- 11.1. Market Analysis, Insights and Forecast - by Production Analysis
- 11.2. Market Analysis, Insights and Forecast - by Consumption Analysis
- 11.3. Market Analysis, Insights and Forecast - by Import Market Analysis (Value & Volume)
- 11.4. Market Analysis, Insights and Forecast - by Export Market Analysis (Value & Volume)
- 11.5. Market Analysis, Insights and Forecast - by Price Trend Analysis
- 12. Competitive Analysis
- 12.1. Company Profiles
- 12.1.1 T&W Electronics Co Ltd
- 12.1.1.1. Company Overview
- 12.1.1.2. Products
- 12.1.1.3. Company Financials
- 12.1.1.4. SWOT Analysis
- 12.1.2 Parallel Wireless Inc
- 12.1.2.1. Company Overview
- 12.1.2.2. Products
- 12.1.2.3. Company Financials
- 12.1.2.4. SWOT Analysis
- 12.1.3 Baicells Technologies Co Ltd
- 12.1.3.1. Company Overview
- 12.1.3.2. Products
- 12.1.3.3. Company Financials
- 12.1.3.4. SWOT Analysis
- 12.1.4 Telefonaktiebolaget LM Ericsson
- 12.1.4.1. Company Overview
- 12.1.4.2. Products
- 12.1.4.3. Company Financials
- 12.1.4.4. SWOT Analysis
- 12.1.5 Samsung Electronics Co Ltd
- 12.1.5.1. Company Overview
- 12.1.5.2. Products
- 12.1.5.3. Company Financials
- 12.1.5.4. SWOT Analysis
- 12.1.6 Nokia Corporation*List Not Exhaustive
- 12.1.6.1. Company Overview
- 12.1.6.2. Products
- 12.1.6.3. Company Financials
- 12.1.6.4. SWOT Analysis
- 12.1.7 NEC Corporation
- 12.1.7.1. Company Overview
- 12.1.7.2. Products
- 12.1.7.3. Company Financials
- 12.1.7.4. SWOT Analysis
- 12.1.8 Huawei Technologies Co Ltd
- 12.1.8.1. Company Overview
- 12.1.8.2. Products
- 12.1.8.3. Company Financials
- 12.1.8.4. SWOT Analysis
- 12.1.9 ZTE Corporation
- 12.1.9.1. Company Overview
- 12.1.9.2. Products
- 12.1.9.3. Company Financials
- 12.1.9.4. SWOT Analysis
- 12.1.10 Airspan Networks Inc
- 12.1.10.1. Company Overview
- 12.1.10.2. Products
- 12.1.10.3. Company Financials
- 12.1.10.4. SWOT Analysis
- 12.1.1 T&W Electronics Co Ltd
- 12.2. Market Entropy
- 12.2.1 Company's Key Areas Served
- 12.2.2 Recent Developments
- 12.3. Company Market Share Analysis 2025
- 12.3.1 Top 5 Companies Market Share Analysis
- 12.3.2 Top 3 Companies Market Share Analysis
- 12.4. List of Potential Customers
- 13. Research Methodology
List of Figures
- Figure 1: Global APAC Small Cell Tower Industry Revenue Breakdown (billion, %) by Region 2025 & 2033
- Figure 2: Global APAC Small Cell Tower Industry Volume Breakdown (Million, %) by Region 2025 & 2033
- Figure 3: North America APAC Small Cell Tower Industry Revenue (billion), by Production Analysis 2025 & 2033
- Figure 4: North America APAC Small Cell Tower Industry Volume (Million), by Production Analysis 2025 & 2033
- Figure 5: North America APAC Small Cell Tower Industry Revenue Share (%), by Production Analysis 2025 & 2033
- Figure 6: North America APAC Small Cell Tower Industry Volume Share (%), by Production Analysis 2025 & 2033
- Figure 7: North America APAC Small Cell Tower Industry Revenue (billion), by Consumption Analysis 2025 & 2033
- Figure 8: North America APAC Small Cell Tower Industry Volume (Million), by Consumption Analysis 2025 & 2033
- Figure 9: North America APAC Small Cell Tower Industry Revenue Share (%), by Consumption Analysis 2025 & 2033
- Figure 10: North America APAC Small Cell Tower Industry Volume Share (%), by Consumption Analysis 2025 & 2033
- Figure 11: North America APAC Small Cell Tower Industry Revenue (billion), by Import Market Analysis (Value & Volume) 2025 & 2033
- Figure 12: North America APAC Small Cell Tower Industry Volume (Million), by Import Market Analysis (Value & Volume) 2025 & 2033
- Figure 13: North America APAC Small Cell Tower Industry Revenue Share (%), by Import Market Analysis (Value & Volume) 2025 & 2033
- Figure 14: North America APAC Small Cell Tower Industry Volume Share (%), by Import Market Analysis (Value & Volume) 2025 & 2033
- Figure 15: North America APAC Small Cell Tower Industry Revenue (billion), by Export Market Analysis (Value & Volume) 2025 & 2033
- Figure 16: North America APAC Small Cell Tower Industry Volume (Million), by Export Market Analysis (Value & Volume) 2025 & 2033
- Figure 17: North America APAC Small Cell Tower Industry Revenue Share (%), by Export Market Analysis (Value & Volume) 2025 & 2033
- Figure 18: North America APAC Small Cell Tower Industry Volume Share (%), by Export Market Analysis (Value & Volume) 2025 & 2033
- Figure 19: North America APAC Small Cell Tower Industry Revenue (billion), by Price Trend Analysis 2025 & 2033
- Figure 20: North America APAC Small Cell Tower Industry Volume (Million), by Price Trend Analysis 2025 & 2033
- Figure 21: North America APAC Small Cell Tower Industry Revenue Share (%), by Price Trend Analysis 2025 & 2033
- Figure 22: North America APAC Small Cell Tower Industry Volume Share (%), by Price Trend Analysis 2025 & 2033
- Figure 23: North America APAC Small Cell Tower Industry Revenue (billion), by Country 2025 & 2033
- Figure 24: North America APAC Small Cell Tower Industry Volume (Million), by Country 2025 & 2033
- Figure 25: North America APAC Small Cell Tower Industry Revenue Share (%), by Country 2025 & 2033
- Figure 26: North America APAC Small Cell Tower Industry Volume Share (%), by Country 2025 & 2033
- Figure 27: South America APAC Small Cell Tower Industry Revenue (billion), by Production Analysis 2025 & 2033
- Figure 28: South America APAC Small Cell Tower Industry Volume (Million), by Production Analysis 2025 & 2033
- Figure 29: South America APAC Small Cell Tower Industry Revenue Share (%), by Production Analysis 2025 & 2033
- Figure 30: South America APAC Small Cell Tower Industry Volume Share (%), by Production Analysis 2025 & 2033
- Figure 31: South America APAC Small Cell Tower Industry Revenue (billion), by Consumption Analysis 2025 & 2033
- Figure 32: South America APAC Small Cell Tower Industry Volume (Million), by Consumption Analysis 2025 & 2033
- Figure 33: South America APAC Small Cell Tower Industry Revenue Share (%), by Consumption Analysis 2025 & 2033
- Figure 34: South America APAC Small Cell Tower Industry Volume Share (%), by Consumption Analysis 2025 & 2033
- Figure 35: South America APAC Small Cell Tower Industry Revenue (billion), by Import Market Analysis (Value & Volume) 2025 & 2033
- Figure 36: South America APAC Small Cell Tower Industry Volume (Million), by Import Market Analysis (Value & Volume) 2025 & 2033
- Figure 37: South America APAC Small Cell Tower Industry Revenue Share (%), by Import Market Analysis (Value & Volume) 2025 & 2033
- Figure 38: South America APAC Small Cell Tower Industry Volume Share (%), by Import Market Analysis (Value & Volume) 2025 & 2033
- Figure 39: South America APAC Small Cell Tower Industry Revenue (billion), by Export Market Analysis (Value & Volume) 2025 & 2033
- Figure 40: South America APAC Small Cell Tower Industry Volume (Million), by Export Market Analysis (Value & Volume) 2025 & 2033
- Figure 41: South America APAC Small Cell Tower Industry Revenue Share (%), by Export Market Analysis (Value & Volume) 2025 & 2033
- Figure 42: South America APAC Small Cell Tower Industry Volume Share (%), by Export Market Analysis (Value & Volume) 2025 & 2033
- Figure 43: South America APAC Small Cell Tower Industry Revenue (billion), by Price Trend Analysis 2025 & 2033
- Figure 44: South America APAC Small Cell Tower Industry Volume (Million), by Price Trend Analysis 2025 & 2033
- Figure 45: South America APAC Small Cell Tower Industry Revenue Share (%), by Price Trend Analysis 2025 & 2033
- Figure 46: South America APAC Small Cell Tower Industry Volume Share (%), by Price Trend Analysis 2025 & 2033
- Figure 47: South America APAC Small Cell Tower Industry Revenue (billion), by Country 2025 & 2033
- Figure 48: South America APAC Small Cell Tower Industry Volume (Million), by Country 2025 & 2033
- Figure 49: South America APAC Small Cell Tower Industry Revenue Share (%), by Country 2025 & 2033
- Figure 50: South America APAC Small Cell Tower Industry Volume Share (%), by Country 2025 & 2033
- Figure 51: Europe APAC Small Cell Tower Industry Revenue (billion), by Production Analysis 2025 & 2033
- Figure 52: Europe APAC Small Cell Tower Industry Volume (Million), by Production Analysis 2025 & 2033
- Figure 53: Europe APAC Small Cell Tower Industry Revenue Share (%), by Production Analysis 2025 & 2033
- Figure 54: Europe APAC Small Cell Tower Industry Volume Share (%), by Production Analysis 2025 & 2033
- Figure 55: Europe APAC Small Cell Tower Industry Revenue (billion), by Consumption Analysis 2025 & 2033
- Figure 56: Europe APAC Small Cell Tower Industry Volume (Million), by Consumption Analysis 2025 & 2033
- Figure 57: Europe APAC Small Cell Tower Industry Revenue Share (%), by Consumption Analysis 2025 & 2033
- Figure 58: Europe APAC Small Cell Tower Industry Volume Share (%), by Consumption Analysis 2025 & 2033
- Figure 59: Europe APAC Small Cell Tower Industry Revenue (billion), by Import Market Analysis (Value & Volume) 2025 & 2033
- Figure 60: Europe APAC Small Cell Tower Industry Volume (Million), by Import Market Analysis (Value & Volume) 2025 & 2033
- Figure 61: Europe APAC Small Cell Tower Industry Revenue Share (%), by Import Market Analysis (Value & Volume) 2025 & 2033
- Figure 62: Europe APAC Small Cell Tower Industry Volume Share (%), by Import Market Analysis (Value & Volume) 2025 & 2033
- Figure 63: Europe APAC Small Cell Tower Industry Revenue (billion), by Export Market Analysis (Value & Volume) 2025 & 2033
- Figure 64: Europe APAC Small Cell Tower Industry Volume (Million), by Export Market Analysis (Value & Volume) 2025 & 2033
- Figure 65: Europe APAC Small Cell Tower Industry Revenue Share (%), by Export Market Analysis (Value & Volume) 2025 & 2033
- Figure 66: Europe APAC Small Cell Tower Industry Volume Share (%), by Export Market Analysis (Value & Volume) 2025 & 2033
- Figure 67: Europe APAC Small Cell Tower Industry Revenue (billion), by Price Trend Analysis 2025 & 2033
- Figure 68: Europe APAC Small Cell Tower Industry Volume (Million), by Price Trend Analysis 2025 & 2033
- Figure 69: Europe APAC Small Cell Tower Industry Revenue Share (%), by Price Trend Analysis 2025 & 2033
- Figure 70: Europe APAC Small Cell Tower Industry Volume Share (%), by Price Trend Analysis 2025 & 2033
- Figure 71: Europe APAC Small Cell Tower Industry Revenue (billion), by Country 2025 & 2033
- Figure 72: Europe APAC Small Cell Tower Industry Volume (Million), by Country 2025 & 2033
- Figure 73: Europe APAC Small Cell Tower Industry Revenue Share (%), by Country 2025 & 2033
- Figure 74: Europe APAC Small Cell Tower Industry Volume Share (%), by Country 2025 & 2033
- Figure 75: Middle East & Africa APAC Small Cell Tower Industry Revenue (billion), by Production Analysis 2025 & 2033
- Figure 76: Middle East & Africa APAC Small Cell Tower Industry Volume (Million), by Production Analysis 2025 & 2033
- Figure 77: Middle East & Africa APAC Small Cell Tower Industry Revenue Share (%), by Production Analysis 2025 & 2033
- Figure 78: Middle East & Africa APAC Small Cell Tower Industry Volume Share (%), by Production Analysis 2025 & 2033
- Figure 79: Middle East & Africa APAC Small Cell Tower Industry Revenue (billion), by Consumption Analysis 2025 & 2033
- Figure 80: Middle East & Africa APAC Small Cell Tower Industry Volume (Million), by Consumption Analysis 2025 & 2033
- Figure 81: Middle East & Africa APAC Small Cell Tower Industry Revenue Share (%), by Consumption Analysis 2025 & 2033
- Figure 82: Middle East & Africa APAC Small Cell Tower Industry Volume Share (%), by Consumption Analysis 2025 & 2033
- Figure 83: Middle East & Africa APAC Small Cell Tower Industry Revenue (billion), by Import Market Analysis (Value & Volume) 2025 & 2033
- Figure 84: Middle East & Africa APAC Small Cell Tower Industry Volume (Million), by Import Market Analysis (Value & Volume) 2025 & 2033
- Figure 85: Middle East & Africa APAC Small Cell Tower Industry Revenue Share (%), by Import Market Analysis (Value & Volume) 2025 & 2033
- Figure 86: Middle East & Africa APAC Small Cell Tower Industry Volume Share (%), by Import Market Analysis (Value & Volume) 2025 & 2033
- Figure 87: Middle East & Africa APAC Small Cell Tower Industry Revenue (billion), by Export Market Analysis (Value & Volume) 2025 & 2033
- Figure 88: Middle East & Africa APAC Small Cell Tower Industry Volume (Million), by Export Market Analysis (Value & Volume) 2025 & 2033
- Figure 89: Middle East & Africa APAC Small Cell Tower Industry Revenue Share (%), by Export Market Analysis (Value & Volume) 2025 & 2033
- Figure 90: Middle East & Africa APAC Small Cell Tower Industry Volume Share (%), by Export Market Analysis (Value & Volume) 2025 & 2033
- Figure 91: Middle East & Africa APAC Small Cell Tower Industry Revenue (billion), by Price Trend Analysis 2025 & 2033
- Figure 92: Middle East & Africa APAC Small Cell Tower Industry Volume (Million), by Price Trend Analysis 2025 & 2033
- Figure 93: Middle East & Africa APAC Small Cell Tower Industry Revenue Share (%), by Price Trend Analysis 2025 & 2033
- Figure 94: Middle East & Africa APAC Small Cell Tower Industry Volume Share (%), by Price Trend Analysis 2025 & 2033
- Figure 95: Middle East & Africa APAC Small Cell Tower Industry Revenue (billion), by Country 2025 & 2033
- Figure 96: Middle East & Africa APAC Small Cell Tower Industry Volume (Million), by Country 2025 & 2033
- Figure 97: Middle East & Africa APAC Small Cell Tower Industry Revenue Share (%), by Country 2025 & 2033
- Figure 98: Middle East & Africa APAC Small Cell Tower Industry Volume Share (%), by Country 2025 & 2033
- Figure 99: Asia Pacific APAC Small Cell Tower Industry Revenue (billion), by Production Analysis 2025 & 2033
- Figure 100: Asia Pacific APAC Small Cell Tower Industry Volume (Million), by Production Analysis 2025 & 2033
- Figure 101: Asia Pacific APAC Small Cell Tower Industry Revenue Share (%), by Production Analysis 2025 & 2033
- Figure 102: Asia Pacific APAC Small Cell Tower Industry Volume Share (%), by Production Analysis 2025 & 2033
- Figure 103: Asia Pacific APAC Small Cell Tower Industry Revenue (billion), by Consumption Analysis 2025 & 2033
- Figure 104: Asia Pacific APAC Small Cell Tower Industry Volume (Million), by Consumption Analysis 2025 & 2033
- Figure 105: Asia Pacific APAC Small Cell Tower Industry Revenue Share (%), by Consumption Analysis 2025 & 2033
- Figure 106: Asia Pacific APAC Small Cell Tower Industry Volume Share (%), by Consumption Analysis 2025 & 2033
- Figure 107: Asia Pacific APAC Small Cell Tower Industry Revenue (billion), by Import Market Analysis (Value & Volume) 2025 & 2033
- Figure 108: Asia Pacific APAC Small Cell Tower Industry Volume (Million), by Import Market Analysis (Value & Volume) 2025 & 2033
- Figure 109: Asia Pacific APAC Small Cell Tower Industry Revenue Share (%), by Import Market Analysis (Value & Volume) 2025 & 2033
- Figure 110: Asia Pacific APAC Small Cell Tower Industry Volume Share (%), by Import Market Analysis (Value & Volume) 2025 & 2033
- Figure 111: Asia Pacific APAC Small Cell Tower Industry Revenue (billion), by Export Market Analysis (Value & Volume) 2025 & 2033
- Figure 112: Asia Pacific APAC Small Cell Tower Industry Volume (Million), by Export Market Analysis (Value & Volume) 2025 & 2033
- Figure 113: Asia Pacific APAC Small Cell Tower Industry Revenue Share (%), by Export Market Analysis (Value & Volume) 2025 & 2033
- Figure 114: Asia Pacific APAC Small Cell Tower Industry Volume Share (%), by Export Market Analysis (Value & Volume) 2025 & 2033
- Figure 115: Asia Pacific APAC Small Cell Tower Industry Revenue (billion), by Price Trend Analysis 2025 & 2033
- Figure 116: Asia Pacific APAC Small Cell Tower Industry Volume (Million), by Price Trend Analysis 2025 & 2033
- Figure 117: Asia Pacific APAC Small Cell Tower Industry Revenue Share (%), by Price Trend Analysis 2025 & 2033
- Figure 118: Asia Pacific APAC Small Cell Tower Industry Volume Share (%), by Price Trend Analysis 2025 & 2033
- Figure 119: Asia Pacific APAC Small Cell Tower Industry Revenue (billion), by Country 2025 & 2033
- Figure 120: Asia Pacific APAC Small Cell Tower Industry Volume (Million), by Country 2025 & 2033
- Figure 121: Asia Pacific APAC Small Cell Tower Industry Revenue Share (%), by Country 2025 & 2033
- Figure 122: Asia Pacific APAC Small Cell Tower Industry Volume Share (%), by Country 2025 & 2033
List of Tables
- Table 1: Global APAC Small Cell Tower Industry Revenue billion Forecast, by Production Analysis 2020 & 2033
- Table 2: Global APAC Small Cell Tower Industry Volume Million Forecast, by Production Analysis 2020 & 2033
- Table 3: Global APAC Small Cell Tower Industry Revenue billion Forecast, by Consumption Analysis 2020 & 2033
- Table 4: Global APAC Small Cell Tower Industry Volume Million Forecast, by Consumption Analysis 2020 & 2033
- Table 5: Global APAC Small Cell Tower Industry Revenue billion Forecast, by Import Market Analysis (Value & Volume) 2020 & 2033
- Table 6: Global APAC Small Cell Tower Industry Volume Million Forecast, by Import Market Analysis (Value & Volume) 2020 & 2033
- Table 7: Global APAC Small Cell Tower Industry Revenue billion Forecast, by Export Market Analysis (Value & Volume) 2020 & 2033
- Table 8: Global APAC Small Cell Tower Industry Volume Million Forecast, by Export Market Analysis (Value & Volume) 2020 & 2033
- Table 9: Global APAC Small Cell Tower Industry Revenue billion Forecast, by Price Trend Analysis 2020 & 2033
- Table 10: Global APAC Small Cell Tower Industry Volume Million Forecast, by Price Trend Analysis 2020 & 2033
- Table 11: Global APAC Small Cell Tower Industry Revenue billion Forecast, by Region 2020 & 2033
- Table 12: Global APAC Small Cell Tower Industry Volume Million Forecast, by Region 2020 & 2033
- Table 13: Global APAC Small Cell Tower Industry Revenue billion Forecast, by Production Analysis 2020 & 2033
- Table 14: Global APAC Small Cell Tower Industry Volume Million Forecast, by Production Analysis 2020 & 2033
- Table 15: Global APAC Small Cell Tower Industry Revenue billion Forecast, by Consumption Analysis 2020 & 2033
- Table 16: Global APAC Small Cell Tower Industry Volume Million Forecast, by Consumption Analysis 2020 & 2033
- Table 17: Global APAC Small Cell Tower Industry Revenue billion Forecast, by Import Market Analysis (Value & Volume) 2020 & 2033
- Table 18: Global APAC Small Cell Tower Industry Volume Million Forecast, by Import Market Analysis (Value & Volume) 2020 & 2033
- Table 19: Global APAC Small Cell Tower Industry Revenue billion Forecast, by Export Market Analysis (Value & Volume) 2020 & 2033
- Table 20: Global APAC Small Cell Tower Industry Volume Million Forecast, by Export Market Analysis (Value & Volume) 2020 & 2033
- Table 21: Global APAC Small Cell Tower Industry Revenue billion Forecast, by Price Trend Analysis 2020 & 2033
- Table 22: Global APAC Small Cell Tower Industry Volume Million Forecast, by Price Trend Analysis 2020 & 2033
- Table 23: Global APAC Small Cell Tower Industry Revenue billion Forecast, by Country 2020 & 2033
- Table 24: Global APAC Small Cell Tower Industry Volume Million Forecast, by Country 2020 & 2033
- Table 25: United States APAC Small Cell Tower Industry Revenue (billion) Forecast, by Application 2020 & 2033
- Table 26: United States APAC Small Cell Tower Industry Volume (Million) Forecast, by Application 2020 & 2033
- Table 27: Canada APAC Small Cell Tower Industry Revenue (billion) Forecast, by Application 2020 & 2033
- Table 28: Canada APAC Small Cell Tower Industry Volume (Million) Forecast, by Application 2020 & 2033
- Table 29: Mexico APAC Small Cell Tower Industry Revenue (billion) Forecast, by Application 2020 & 2033
- Table 30: Mexico APAC Small Cell Tower Industry Volume (Million) Forecast, by Application 2020 & 2033
- Table 31: Global APAC Small Cell Tower Industry Revenue billion Forecast, by Production Analysis 2020 & 2033
- Table 32: Global APAC Small Cell Tower Industry Volume Million Forecast, by Production Analysis 2020 & 2033
- Table 33: Global APAC Small Cell Tower Industry Revenue billion Forecast, by Consumption Analysis 2020 & 2033
- Table 34: Global APAC Small Cell Tower Industry Volume Million Forecast, by Consumption Analysis 2020 & 2033
- Table 35: Global APAC Small Cell Tower Industry Revenue billion Forecast, by Import Market Analysis (Value & Volume) 2020 & 2033
- Table 36: Global APAC Small Cell Tower Industry Volume Million Forecast, by Import Market Analysis (Value & Volume) 2020 & 2033
- Table 37: Global APAC Small Cell Tower Industry Revenue billion Forecast, by Export Market Analysis (Value & Volume) 2020 & 2033
- Table 38: Global APAC Small Cell Tower Industry Volume Million Forecast, by Export Market Analysis (Value & Volume) 2020 & 2033
- Table 39: Global APAC Small Cell Tower Industry Revenue billion Forecast, by Price Trend Analysis 2020 & 2033
- Table 40: Global APAC Small Cell Tower Industry Volume Million Forecast, by Price Trend Analysis 2020 & 2033
- Table 41: Global APAC Small Cell Tower Industry Revenue billion Forecast, by Country 2020 & 2033
- Table 42: Global APAC Small Cell Tower Industry Volume Million Forecast, by Country 2020 & 2033
- Table 43: Brazil APAC Small Cell Tower Industry Revenue (billion) Forecast, by Application 2020 & 2033
- Table 44: Brazil APAC Small Cell Tower Industry Volume (Million) Forecast, by Application 2020 & 2033
- Table 45: Argentina APAC Small Cell Tower Industry Revenue (billion) Forecast, by Application 2020 & 2033
- Table 46: Argentina APAC Small Cell Tower Industry Volume (Million) Forecast, by Application 2020 & 2033
- Table 47: Rest of South America APAC Small Cell Tower Industry Revenue (billion) Forecast, by Application 2020 & 2033
- Table 48: Rest of South America APAC Small Cell Tower Industry Volume (Million) Forecast, by Application 2020 & 2033
- Table 49: Global APAC Small Cell Tower Industry Revenue billion Forecast, by Production Analysis 2020 & 2033
- Table 50: Global APAC Small Cell Tower Industry Volume Million Forecast, by Production Analysis 2020 & 2033
- Table 51: Global APAC Small Cell Tower Industry Revenue billion Forecast, by Consumption Analysis 2020 & 2033
- Table 52: Global APAC Small Cell Tower Industry Volume Million Forecast, by Consumption Analysis 2020 & 2033
- Table 53: Global APAC Small Cell Tower Industry Revenue billion Forecast, by Import Market Analysis (Value & Volume) 2020 & 2033
- Table 54: Global APAC Small Cell Tower Industry Volume Million Forecast, by Import Market Analysis (Value & Volume) 2020 & 2033
- Table 55: Global APAC Small Cell Tower Industry Revenue billion Forecast, by Export Market Analysis (Value & Volume) 2020 & 2033
- Table 56: Global APAC Small Cell Tower Industry Volume Million Forecast, by Export Market Analysis (Value & Volume) 2020 & 2033
- Table 57: Global APAC Small Cell Tower Industry Revenue billion Forecast, by Price Trend Analysis 2020 & 2033
- Table 58: Global APAC Small Cell Tower Industry Volume Million Forecast, by Price Trend Analysis 2020 & 2033
- Table 59: Global APAC Small Cell Tower Industry Revenue billion Forecast, by Country 2020 & 2033
- Table 60: Global APAC Small Cell Tower Industry Volume Million Forecast, by Country 2020 & 2033
- Table 61: United Kingdom APAC Small Cell Tower Industry Revenue (billion) Forecast, by Application 2020 & 2033
- Table 62: United Kingdom APAC Small Cell Tower Industry Volume (Million) Forecast, by Application 2020 & 2033
- Table 63: Germany APAC Small Cell Tower Industry Revenue (billion) Forecast, by Application 2020 & 2033
- Table 64: Germany APAC Small Cell Tower Industry Volume (Million) Forecast, by Application 2020 & 2033
- Table 65: France APAC Small Cell Tower Industry Revenue (billion) Forecast, by Application 2020 & 2033
- Table 66: France APAC Small Cell Tower Industry Volume (Million) Forecast, by Application 2020 & 2033
- Table 67: Italy APAC Small Cell Tower Industry Revenue (billion) Forecast, by Application 2020 & 2033
- Table 68: Italy APAC Small Cell Tower Industry Volume (Million) Forecast, by Application 2020 & 2033
- Table 69: Spain APAC Small Cell Tower Industry Revenue (billion) Forecast, by Application 2020 & 2033
- Table 70: Spain APAC Small Cell Tower Industry Volume (Million) Forecast, by Application 2020 & 2033
- Table 71: Russia APAC Small Cell Tower Industry Revenue (billion) Forecast, by Application 2020 & 2033
- Table 72: Russia APAC Small Cell Tower Industry Volume (Million) Forecast, by Application 2020 & 2033
- Table 73: Benelux APAC Small Cell Tower Industry Revenue (billion) Forecast, by Application 2020 & 2033
- Table 74: Benelux APAC Small Cell Tower Industry Volume (Million) Forecast, by Application 2020 & 2033
- Table 75: Nordics APAC Small Cell Tower Industry Revenue (billion) Forecast, by Application 2020 & 2033
- Table 76: Nordics APAC Small Cell Tower Industry Volume (Million) Forecast, by Application 2020 & 2033
- Table 77: Rest of Europe APAC Small Cell Tower Industry Revenue (billion) Forecast, by Application 2020 & 2033
- Table 78: Rest of Europe APAC Small Cell Tower Industry Volume (Million) Forecast, by Application 2020 & 2033
- Table 79: Global APAC Small Cell Tower Industry Revenue billion Forecast, by Production Analysis 2020 & 2033
- Table 80: Global APAC Small Cell Tower Industry Volume Million Forecast, by Production Analysis 2020 & 2033
- Table 81: Global APAC Small Cell Tower Industry Revenue billion Forecast, by Consumption Analysis 2020 & 2033
- Table 82: Global APAC Small Cell Tower Industry Volume Million Forecast, by Consumption Analysis 2020 & 2033
- Table 83: Global APAC Small Cell Tower Industry Revenue billion Forecast, by Import Market Analysis (Value & Volume) 2020 & 2033
- Table 84: Global APAC Small Cell Tower Industry Volume Million Forecast, by Import Market Analysis (Value & Volume) 2020 & 2033
- Table 85: Global APAC Small Cell Tower Industry Revenue billion Forecast, by Export Market Analysis (Value & Volume) 2020 & 2033
- Table 86: Global APAC Small Cell Tower Industry Volume Million Forecast, by Export Market Analysis (Value & Volume) 2020 & 2033
- Table 87: Global APAC Small Cell Tower Industry Revenue billion Forecast, by Price Trend Analysis 2020 & 2033
- Table 88: Global APAC Small Cell Tower Industry Volume Million Forecast, by Price Trend Analysis 2020 & 2033
- Table 89: Global APAC Small Cell Tower Industry Revenue billion Forecast, by Country 2020 & 2033
- Table 90: Global APAC Small Cell Tower Industry Volume Million Forecast, by Country 2020 & 2033
- Table 91: Turkey APAC Small Cell Tower Industry Revenue (billion) Forecast, by Application 2020 & 2033
- Table 92: Turkey APAC Small Cell Tower Industry Volume (Million) Forecast, by Application 2020 & 2033
- Table 93: Israel APAC Small Cell Tower Industry Revenue (billion) Forecast, by Application 2020 & 2033
- Table 94: Israel APAC Small Cell Tower Industry Volume (Million) Forecast, by Application 2020 & 2033
- Table 95: GCC APAC Small Cell Tower Industry Revenue (billion) Forecast, by Application 2020 & 2033
- Table 96: GCC APAC Small Cell Tower Industry Volume (Million) Forecast, by Application 2020 & 2033
- Table 97: North Africa APAC Small Cell Tower Industry Revenue (billion) Forecast, by Application 2020 & 2033
- Table 98: North Africa APAC Small Cell Tower Industry Volume (Million) Forecast, by Application 2020 & 2033
- Table 99: South Africa APAC Small Cell Tower Industry Revenue (billion) Forecast, by Application 2020 & 2033
- Table 100: South Africa APAC Small Cell Tower Industry Volume (Million) Forecast, by Application 2020 & 2033
- Table 101: Rest of Middle East & Africa APAC Small Cell Tower Industry Revenue (billion) Forecast, by Application 2020 & 2033
- Table 102: Rest of Middle East & Africa APAC Small Cell Tower Industry Volume (Million) Forecast, by Application 2020 & 2033
- Table 103: Global APAC Small Cell Tower Industry Revenue billion Forecast, by Production Analysis 2020 & 2033
- Table 104: Global APAC Small Cell Tower Industry Volume Million Forecast, by Production Analysis 2020 & 2033
- Table 105: Global APAC Small Cell Tower Industry Revenue billion Forecast, by Consumption Analysis 2020 & 2033
- Table 106: Global APAC Small Cell Tower Industry Volume Million Forecast, by Consumption Analysis 2020 & 2033
- Table 107: Global APAC Small Cell Tower Industry Revenue billion Forecast, by Import Market Analysis (Value & Volume) 2020 & 2033
- Table 108: Global APAC Small Cell Tower Industry Volume Million Forecast, by Import Market Analysis (Value & Volume) 2020 & 2033
- Table 109: Global APAC Small Cell Tower Industry Revenue billion Forecast, by Export Market Analysis (Value & Volume) 2020 & 2033
- Table 110: Global APAC Small Cell Tower Industry Volume Million Forecast, by Export Market Analysis (Value & Volume) 2020 & 2033
- Table 111: Global APAC Small Cell Tower Industry Revenue billion Forecast, by Price Trend Analysis 2020 & 2033
- Table 112: Global APAC Small Cell Tower Industry Volume Million Forecast, by Price Trend Analysis 2020 & 2033
- Table 113: Global APAC Small Cell Tower Industry Revenue billion Forecast, by Country 2020 & 2033
- Table 114: Global APAC Small Cell Tower Industry Volume Million Forecast, by Country 2020 & 2033
- Table 115: China APAC Small Cell Tower Industry Revenue (billion) Forecast, by Application 2020 & 2033
- Table 116: China APAC Small Cell Tower Industry Volume (Million) Forecast, by Application 2020 & 2033
- Table 117: India APAC Small Cell Tower Industry Revenue (billion) Forecast, by Application 2020 & 2033
- Table 118: India APAC Small Cell Tower Industry Volume (Million) Forecast, by Application 2020 & 2033
- Table 119: Japan APAC Small Cell Tower Industry Revenue (billion) Forecast, by Application 2020 & 2033
- Table 120: Japan APAC Small Cell Tower Industry Volume (Million) Forecast, by Application 2020 & 2033
- Table 121: South Korea APAC Small Cell Tower Industry Revenue (billion) Forecast, by Application 2020 & 2033
- Table 122: South Korea APAC Small Cell Tower Industry Volume (Million) Forecast, by Application 2020 & 2033
- Table 123: ASEAN APAC Small Cell Tower Industry Revenue (billion) Forecast, by Application 2020 & 2033
- Table 124: ASEAN APAC Small Cell Tower Industry Volume (Million) Forecast, by Application 2020 & 2033
- Table 125: Oceania APAC Small Cell Tower Industry Revenue (billion) Forecast, by Application 2020 & 2033
- Table 126: Oceania APAC Small Cell Tower Industry Volume (Million) Forecast, by Application 2020 & 2033
- Table 127: Rest of Asia Pacific APAC Small Cell Tower Industry Revenue (billion) Forecast, by Application 2020 & 2033
- Table 128: Rest of Asia Pacific APAC Small Cell Tower Industry Volume (Million) Forecast, by Application 2020 & 2033
Frequently Asked Questions
1. What is the projected Compound Annual Growth Rate (CAGR) of the APAC Small Cell Tower Industry?
The projected CAGR is approximately 3.2%.
2. Which companies are prominent players in the APAC Small Cell Tower Industry?
Key companies in the market include T&W Electronics Co Ltd, Parallel Wireless Inc, Baicells Technologies Co Ltd, Telefonaktiebolaget LM Ericsson, Samsung Electronics Co Ltd, Nokia Corporation*List Not Exhaustive, NEC Corporation, Huawei Technologies Co Ltd, ZTE Corporation, Airspan Networks Inc.
3. What are the main segments of the APAC Small Cell Tower Industry?
The market segments include Production Analysis, Consumption Analysis, Import Market Analysis (Value & Volume), Export Market Analysis (Value & Volume), Price Trend Analysis.
4. Can you provide details about the market size?
The market size is estimated to be USD 30 billion as of 2022.
5. What are some drivers contributing to market growth?
Rapid Increase in Mobile Data Traffic in the Region; Growing Emphasis on Operational Efficiency and Reduction of Capital Expenditure through Replacement of Older Networks with Small Cell Towers; Steady Growth in Installations by Market Incumbents in Mature Markets such as China and South Korea.
6. What are the notable trends driving market growth?
Indoor applications are Expected to Have a Major Market Share..
7. Are there any restraints impacting market growth?
Various Regulations and Policies Coupled with Storage Issues.
8. Can you provide examples of recent developments in the market?
January 2023 - Telefonaktiebolaget LM Ericsson has announced an expansion Private Network portfolio Called NetCloud Private A full subscription-based product, Networks is a software-defined solution that is first targeted at traditionally lean IT-oriented businesses, such as those in the logistics, light manufacturing, government, major retail, healthcare, and hospitality industries.
9. What pricing options are available for accessing the report?
Pricing options include single-user, multi-user, and enterprise licenses priced at USD 4750, USD 4950, and USD 6800 respectively.
10. Is the market size provided in terms of value or volume?
The market size is provided in terms of value, measured in billion and volume, measured in Million.
11. Are there any specific market keywords associated with the report?
Yes, the market keyword associated with the report is "APAC Small Cell Tower Industry," which aids in identifying and referencing the specific market segment covered.
12. How do I determine which pricing option suits my needs best?
The pricing options vary based on user requirements and access needs. Individual users may opt for single-user licenses, while businesses requiring broader access may choose multi-user or enterprise licenses for cost-effective access to the report.
13. Are there any additional resources or data provided in the APAC Small Cell Tower Industry report?
While the report offers comprehensive insights, it's advisable to review the specific contents or supplementary materials provided to ascertain if additional resources or data are available.
14. How can I stay updated on further developments or reports in the APAC Small Cell Tower Industry?
To stay informed about further developments, trends, and reports in the APAC Small Cell Tower Industry, consider subscribing to industry newsletters, following relevant companies and organizations, or regularly checking reputable industry news sources and publications.
Methodology
Step 1 - Identification of Relevant Samples Size from Population Database


Step 2 - Approaches for Defining Global Market Size (Value, Volume* & Price*)

Note*: In applicable scenarios
Step 3 - Data Sources
Primary Research
- Web Analytics
- Survey Reports
- Research Institute
- Latest Research Reports
- Opinion Leaders
Secondary Research
- Annual Reports
- White Paper
- Latest Press Release
- Industry Association
- Paid Database
- Investor Presentations

Step 4 - Data Triangulation
Involves using different sources of information in order to increase the validity of a study
These sources are likely to be stakeholders in a program - participants, other researchers, program staff, other community members, and so on.
Then we put all data in single framework & apply various statistical tools to find out the dynamic on the market.
During the analysis stage, feedback from the stakeholder groups would be compared to determine areas of agreement as well as areas of divergence