
Key Insights
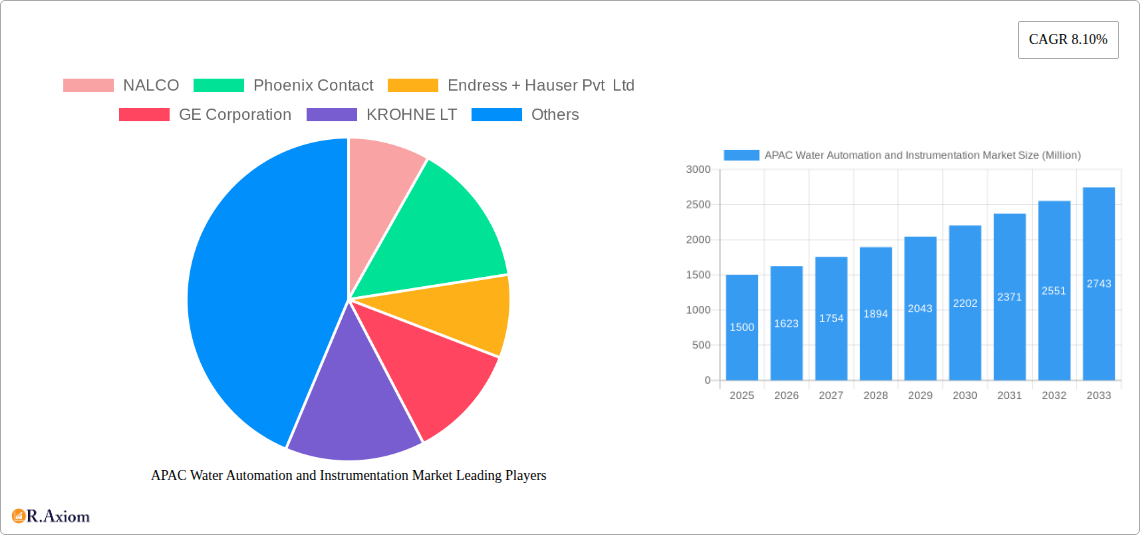
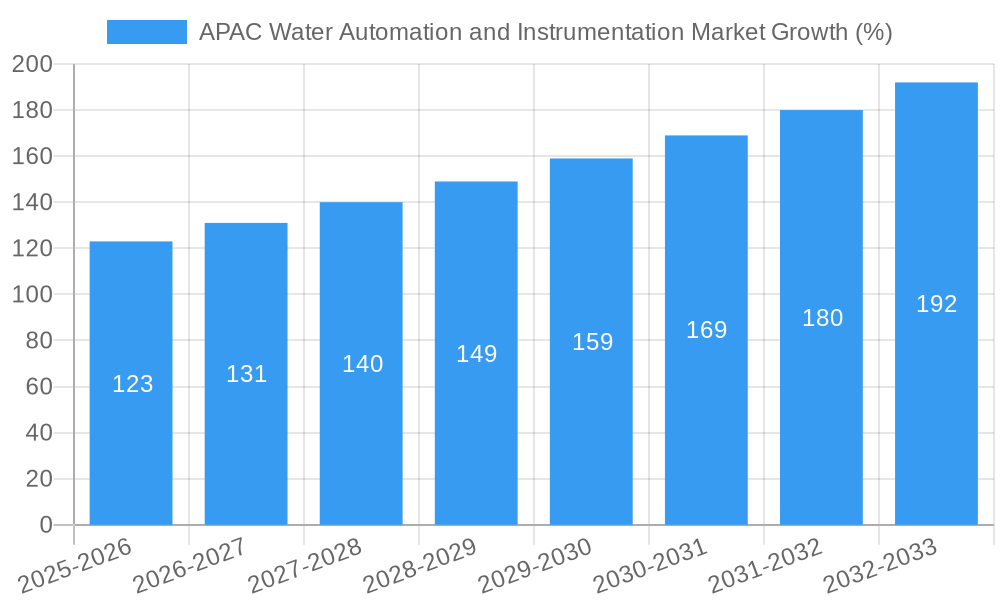
The Asia-Pacific (APAC) water automation and instrumentation market is experiencing robust growth, driven by increasing urbanization, industrialization, and the rising demand for efficient water management solutions. The region's expanding population and economic development are placing significant pressure on water resources, necessitating advanced technologies for water treatment, distribution, and monitoring. This is fueling the adoption of sophisticated automation systems like Distributed Control Systems (DCS), Supervisory Control and Data Acquisition (SCADA), Programmable Logic Controllers (PLCs), and Human-Machine Interfaces (HMIs) to optimize water usage, minimize wastage, and enhance operational efficiency across diverse end-user industries including chemical processing, manufacturing, and food and beverage production. Furthermore, the growing emphasis on water quality monitoring and leakage detection is bolstering the demand for advanced water instrumentation solutions like pressure, level, temperature, and flow sensors and transmitters, along with liquid and gas analyzers. Key players in the market are focusing on developing innovative, cost-effective solutions to cater to the specific needs of various regions and industries. Government initiatives promoting sustainable water management practices and investments in infrastructure upgrades are also contributing to market expansion.
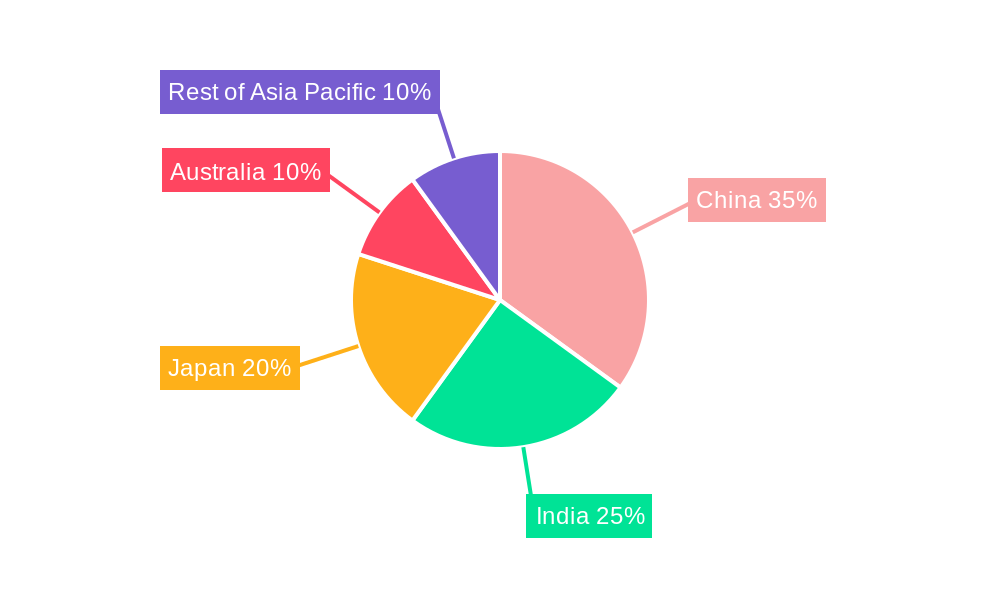
China, India, and Japan are major contributors to the APAC market's growth, owing to their substantial investments in water infrastructure projects and the increasing adoption of automation and instrumentation technologies across their water utilities and industrial sectors. However, the market also faces challenges such as high initial investment costs for advanced technologies, particularly in smaller municipalities and developing regions. Nevertheless, the long-term benefits of improved water management and reduced operational costs are driving the market forward, with a projected Compound Annual Growth Rate (CAGR) of 8.10% from 2025-2033. This growth will be further accelerated by technological advancements, favorable government policies, and a growing awareness of the importance of water conservation and efficient water resource management. The market's segmentation, encompassing various automation and instrumentation solutions across diverse industries, presents substantial opportunities for specialized providers catering to niche applications.
APAC Water Automation and Instrumentation Market Report: 2019-2033
This comprehensive report provides an in-depth analysis of the Asia-Pacific (APAC) water automation and instrumentation market, covering the period from 2019 to 2033. It offers valuable insights into market dynamics, key players, growth drivers, and future opportunities, empowering stakeholders to make informed strategic decisions. The report segments the market by solution type (Water Automation Solutions and Water Instrumentation Solutions), end-user industry, and country, providing a granular view of the regional landscape. The base year for this analysis is 2025, with the forecast period extending to 2033. The report uses Million (M) as the unit for all monetary values.
APAC Water Automation and Instrumentation Market Concentration & Innovation
The APAC water automation and instrumentation market exhibits a moderately concentrated landscape, with key players such as Siemens AG, Schneider Electric SE, Emerson Electric, ABB Group, and Rockwell Automation Inc. holding significant market share. Precise market share figures for 2025 are estimated at xx%, xx%, xx%, xx%, and xx% respectively. However, the market also features several regional and niche players, leading to competitive dynamics. Innovation is driven by the increasing demand for efficient water management, stringent environmental regulations, and technological advancements in areas like IoT and AI. The market has witnessed several mergers and acquisitions (M&A) in recent years, with deal values reaching approximately xx Million in 2024. These activities reflect the strategic importance of the sector and the consolidation efforts by major players. Regulatory frameworks, particularly those concerning water conservation and pollution control, heavily influence market growth. Product substitutes, such as traditional manual control systems, are gradually being replaced by automated solutions due to their enhanced efficiency and cost-effectiveness. End-user trends indicate a preference for integrated solutions offering better data analytics and remote monitoring capabilities. Overall, the market displays a dynamic interplay of consolidation, innovation, and regulatory influences.
APAC Water Automation and Instrumentation Market Industry Trends & Insights
The APAC water automation and instrumentation market is experiencing robust growth, driven by factors such as increasing urbanization, rising industrialization, and growing awareness of water scarcity. The market’s Compound Annual Growth Rate (CAGR) is projected to be xx% during the forecast period (2025-2033). This growth is further fueled by technological disruptions, particularly the integration of advanced technologies like Artificial Intelligence (AI), Internet of Things (IoT), and cloud computing, offering enhanced monitoring, control, and data analytics capabilities. Consumer preferences are shifting towards sustainable and intelligent water management solutions, driving demand for energy-efficient and eco-friendly technologies. Market penetration of advanced automation solutions is gradually increasing, with a projected xx% penetration by 2033 across major APAC countries. The competitive landscape is marked by both intense competition among established players and the emergence of innovative startups offering specialized solutions. The market is further shaped by government initiatives promoting water conservation and smart infrastructure development.
Dominant Markets & Segments in APAC Water Automation and Instrumentation Market
Leading Region: China dominates the APAC water automation and instrumentation market due to its extensive water infrastructure development, rapid industrialization, and strong government support for technological advancements in water management. India follows as a significant market, driven by similar factors, albeit at a slightly slower pace. Japan shows a steady growth driven by technological sophistication and stringent environmental regulations.
Leading Country: China's dominance stems from its large market size, substantial investments in water infrastructure, and the presence of key players. Its robust industrial sector and government policies promoting water efficiency contribute significantly to the market's growth. India exhibits a significant and growing market, although still behind China in terms of overall market size.
Leading Water Automation Solution Segment: SCADA systems are currently the dominant segment due to their versatility in monitoring and controlling large-scale water distribution networks. PLC (Programmable Logic Controllers) holds the second most significant share. The HMI (Human Machine Interface) segment is also experiencing robust growth due to the increased need for user-friendly interfaces for operators.
Leading Water Instrumentation Solution Segment: Pressure transmitters are currently the largest segment, given their importance in water distribution networks and industrial processes. Flow sensors/transmitters and level transmitters follow closely, reflecting the high demand for real-time monitoring.
Leading End-User Industry: The chemical and manufacturing sectors significantly contribute to the market due to their high water consumption and demand for precise process control and monitoring. The food and beverage industry also constitutes a substantial segment driven by stringent hygiene standards.
APAC Water Automation and Instrumentation Market Product Developments
Recent product innovations include the development of advanced sensors with improved accuracy and reliability, along with the integration of cloud-based data analytics platforms for enhanced decision-making. New applications are emerging in areas such as leak detection and water quality monitoring, facilitated by advancements in IoT and AI technologies. Competitive advantages are increasingly driven by the development of integrated and customizable solutions that cater to the specific needs of different end-users. The focus is shifting towards energy-efficient, cost-effective, and sustainable technologies, aligning with global environmental concerns.
Report Scope & Segmentation Analysis
This report segments the APAC water automation and instrumentation market by:
Water Automation Solutions: DCS, SCADA, PLC, HMI, Other Water Automation Solutions. Each segment exhibits varied growth projections, with SCADA and PLC showing high growth driven by adoption in large-scale water management projects. Competitive dynamics are intense in each segment, particularly in DCS and SCADA.
Water Instrumentation Solutions: Pressure Transmitter, Level Transmitter, Temperature Transmitter, Liquid Analyzers, Gas Analyzers, Leakage Detection Systems, Flow Sensors/Transmitters, Other Water Instrumentation Solutions. Growth projections vary; pressure, level, and flow sensors/transmitters dominate, with higher growth anticipated in gas analyzers and leakage detection systems.
End-User Industry: Chemical, Manufacturing, Food and Beverages. The chemical and manufacturing industries dominate, with food and beverages showing considerable growth potential.
Country: Australia, China, Japan, India, Rest of Asia Pacific. China and India represent the largest markets, with Australia and Japan demonstrating strong technological advancements.
Key Drivers of APAC Water Automation and Instrumentation Market Growth
The APAC water automation and instrumentation market is propelled by several key drivers: the increasing scarcity of freshwater resources, stringent environmental regulations, the need for efficient water management, and rapid urbanization and industrialization across the region. Technological advancements, particularly the integration of IoT and AI, are enabling the development of smarter and more efficient water management solutions. Government initiatives promoting water conservation and smart city development further stimulate market growth.
Challenges in the APAP Water Automation and Instrumentation Market Sector
Challenges include the high initial investment costs associated with implementing advanced automation systems, the complexity of integrating different technologies, and the lack of skilled workforce to operate and maintain these systems. Supply chain disruptions, especially those caused by geopolitical events, can impact the availability and pricing of components. Furthermore, intense competition and pricing pressure from regional players can limit profit margins. These factors could potentially impede market growth to some degree.
Emerging Opportunities in APAC Water Automation and Instrumentation Market
Emerging opportunities include the growing demand for smart water management solutions, the increasing adoption of cloud-based platforms for data analytics, and the expansion of the market into rural and underserved areas. The rising focus on water conservation and sustainability will drive the demand for energy-efficient and eco-friendly technologies. The integration of AI and machine learning for predictive maintenance and optimized water distribution will open new avenues for growth.
Leading Players in the APAC Water Automation and Instrumentation Market Market
- NALCO
- Phoenix Contact
- Endress + Hauser Pvt Ltd
- GE Corporation
- KROHNE LT
- MJK Automation
- Siemens AG
- Schneider Electric SE
- Emerson Electric
- ABB Group
- Rockwell Automation Inc
- Yokogawa Electric Corporation
- Mitsubishi Motors Corporation
- Eurotek India
Key Developments in APAC Water Automation and Instrumentation Market Industry
August 2020: Wellin Tech introduced a SCADA system solution for a large water conservancy pumping station, showcasing advancements in real-time monitoring and control capabilities.
March 2021: Hokkaido University, Robotic Biology Institute Inc., iLAC Co., Ltd, and Shionogi & Co., Ltd. collaborated on an automated system for analyzing novel coronavirus in wastewater, highlighting the application of automation in public health.
Strategic Outlook for APAC Water Automation and Instrumentation Market Market
The APAC water automation and instrumentation market holds significant growth potential driven by continuous urbanization, industrial expansion, and increasing awareness of water resource management. The adoption of advanced technologies, coupled with supportive government policies, will further accelerate market expansion. Focusing on sustainable, intelligent, and integrated solutions will be crucial for success in this evolving market. The market presents compelling opportunities for both established players and new entrants, making strategic investments and technological innovations critical for capturing market share.
APAC Water Automation and Instrumentation Market Segmentation
-
1. Water Automation Solution
- 1.1. DCS
- 1.2. SCADA
- 1.3. PLC
- 1.4. HMI
- 1.5. Other Water Automation Solutions
-
2. Water Instrumentation Solution
- 2.1. Pressure Transmitter
- 2.2. Level Transmitter
- 2.3. Temperature Transmitter
- 2.4. Liquid Analyzers
- 2.5. Gas Analyzers
- 2.6. Leakage Detection Systems
- 2.7. Flow Sensors/Transmitters
- 2.8. Other Water Instrumentation Solutions
-
3. End-User Industry (Qualitative Analysis)
- 3.1. Chemical
- 3.2. Manufacturing
- 3.3. Food and Beverages
APAC Water Automation and Instrumentation Market Segmentation By Geography
-
1. North America
- 1.1. United States
- 1.2. Canada
- 1.3. Mexico
-
2. South America
- 2.1. Brazil
- 2.2. Argentina
- 2.3. Rest of South America
-
3. Europe
- 3.1. United Kingdom
- 3.2. Germany
- 3.3. France
- 3.4. Italy
- 3.5. Spain
- 3.6. Russia
- 3.7. Benelux
- 3.8. Nordics
- 3.9. Rest of Europe
-
4. Middle East & Africa
- 4.1. Turkey
- 4.2. Israel
- 4.3. GCC
- 4.4. North Africa
- 4.5. South Africa
- 4.6. Rest of Middle East & Africa
-
5. Asia Pacific
- 5.1. China
- 5.2. India
- 5.3. Japan
- 5.4. South Korea
- 5.5. ASEAN
- 5.6. Oceania
- 5.7. Rest of Asia Pacific
APAC Water Automation and Instrumentation Market REPORT HIGHLIGHTS
| Aspects | Details |
|---|---|
| Study Period | 2019-2033 |
| Base Year | 2024 |
| Estimated Year | 2025 |
| Forecast Period | 2025-2033 |
| Historical Period | 2019-2024 |
| Growth Rate | CAGR of 8.10% from 2019-2033 |
| Segmentation |
|
Table of Contents
- 1. Introduction
- 1.1. Research Scope
- 1.2. Market Segmentation
- 1.3. Research Methodology
- 1.4. Definitions and Assumptions
- 2. Executive Summary
- 2.1. Introduction
- 3. Market Dynamics
- 3.1. Introduction
- 3.2. Market Drivers
- 3.2.1. Government Regulation to Save Water Resources and Energy; Increase in Adoption of Smart Water Technologies
- 3.3. Market Restrains
- 3.3.1. Data Privacy; The Complex Structure of Cloud Storage
- 3.4. Market Trends
- 3.4.1. Demand from Food and Beverage Industry to Witness a Significant Growth Rate
- 4. Market Factor Analysis
- 4.1. Porters Five Forces
- 4.2. Supply/Value Chain
- 4.3. PESTEL analysis
- 4.4. Market Entropy
- 4.5. Patent/Trademark Analysis
- 5. Global APAC Water Automation and Instrumentation Market Analysis, Insights and Forecast, 2019-2031
- 5.1. Market Analysis, Insights and Forecast - by Water Automation Solution
- 5.1.1. DCS
- 5.1.2. SCADA
- 5.1.3. PLC
- 5.1.4. HMI
- 5.1.5. Other Water Automation Solutions
- 5.2. Market Analysis, Insights and Forecast - by Water Instrumentation Solution
- 5.2.1. Pressure Transmitter
- 5.2.2. Level Transmitter
- 5.2.3. Temperature Transmitter
- 5.2.4. Liquid Analyzers
- 5.2.5. Gas Analyzers
- 5.2.6. Leakage Detection Systems
- 5.2.7. Flow Sensors/Transmitters
- 5.2.8. Other Water Instrumentation Solutions
- 5.3. Market Analysis, Insights and Forecast - by End-User Industry (Qualitative Analysis)
- 5.3.1. Chemical
- 5.3.2. Manufacturing
- 5.3.3. Food and Beverages
- 5.4. Market Analysis, Insights and Forecast - by Region
- 5.4.1. North America
- 5.4.2. South America
- 5.4.3. Europe
- 5.4.4. Middle East & Africa
- 5.4.5. Asia Pacific
- 5.1. Market Analysis, Insights and Forecast - by Water Automation Solution
- 6. North America APAC Water Automation and Instrumentation Market Analysis, Insights and Forecast, 2019-2031
- 6.1. Market Analysis, Insights and Forecast - by Water Automation Solution
- 6.1.1. DCS
- 6.1.2. SCADA
- 6.1.3. PLC
- 6.1.4. HMI
- 6.1.5. Other Water Automation Solutions
- 6.2. Market Analysis, Insights and Forecast - by Water Instrumentation Solution
- 6.2.1. Pressure Transmitter
- 6.2.2. Level Transmitter
- 6.2.3. Temperature Transmitter
- 6.2.4. Liquid Analyzers
- 6.2.5. Gas Analyzers
- 6.2.6. Leakage Detection Systems
- 6.2.7. Flow Sensors/Transmitters
- 6.2.8. Other Water Instrumentation Solutions
- 6.3. Market Analysis, Insights and Forecast - by End-User Industry (Qualitative Analysis)
- 6.3.1. Chemical
- 6.3.2. Manufacturing
- 6.3.3. Food and Beverages
- 6.1. Market Analysis, Insights and Forecast - by Water Automation Solution
- 7. South America APAC Water Automation and Instrumentation Market Analysis, Insights and Forecast, 2019-2031
- 7.1. Market Analysis, Insights and Forecast - by Water Automation Solution
- 7.1.1. DCS
- 7.1.2. SCADA
- 7.1.3. PLC
- 7.1.4. HMI
- 7.1.5. Other Water Automation Solutions
- 7.2. Market Analysis, Insights and Forecast - by Water Instrumentation Solution
- 7.2.1. Pressure Transmitter
- 7.2.2. Level Transmitter
- 7.2.3. Temperature Transmitter
- 7.2.4. Liquid Analyzers
- 7.2.5. Gas Analyzers
- 7.2.6. Leakage Detection Systems
- 7.2.7. Flow Sensors/Transmitters
- 7.2.8. Other Water Instrumentation Solutions
- 7.3. Market Analysis, Insights and Forecast - by End-User Industry (Qualitative Analysis)
- 7.3.1. Chemical
- 7.3.2. Manufacturing
- 7.3.3. Food and Beverages
- 7.1. Market Analysis, Insights and Forecast - by Water Automation Solution
- 8. Europe APAC Water Automation and Instrumentation Market Analysis, Insights and Forecast, 2019-2031
- 8.1. Market Analysis, Insights and Forecast - by Water Automation Solution
- 8.1.1. DCS
- 8.1.2. SCADA
- 8.1.3. PLC
- 8.1.4. HMI
- 8.1.5. Other Water Automation Solutions
- 8.2. Market Analysis, Insights and Forecast - by Water Instrumentation Solution
- 8.2.1. Pressure Transmitter
- 8.2.2. Level Transmitter
- 8.2.3. Temperature Transmitter
- 8.2.4. Liquid Analyzers
- 8.2.5. Gas Analyzers
- 8.2.6. Leakage Detection Systems
- 8.2.7. Flow Sensors/Transmitters
- 8.2.8. Other Water Instrumentation Solutions
- 8.3. Market Analysis, Insights and Forecast - by End-User Industry (Qualitative Analysis)
- 8.3.1. Chemical
- 8.3.2. Manufacturing
- 8.3.3. Food and Beverages
- 8.1. Market Analysis, Insights and Forecast - by Water Automation Solution
- 9. Middle East & Africa APAC Water Automation and Instrumentation Market Analysis, Insights and Forecast, 2019-2031
- 9.1. Market Analysis, Insights and Forecast - by Water Automation Solution
- 9.1.1. DCS
- 9.1.2. SCADA
- 9.1.3. PLC
- 9.1.4. HMI
- 9.1.5. Other Water Automation Solutions
- 9.2. Market Analysis, Insights and Forecast - by Water Instrumentation Solution
- 9.2.1. Pressure Transmitter
- 9.2.2. Level Transmitter
- 9.2.3. Temperature Transmitter
- 9.2.4. Liquid Analyzers
- 9.2.5. Gas Analyzers
- 9.2.6. Leakage Detection Systems
- 9.2.7. Flow Sensors/Transmitters
- 9.2.8. Other Water Instrumentation Solutions
- 9.3. Market Analysis, Insights and Forecast - by End-User Industry (Qualitative Analysis)
- 9.3.1. Chemical
- 9.3.2. Manufacturing
- 9.3.3. Food and Beverages
- 9.1. Market Analysis, Insights and Forecast - by Water Automation Solution
- 10. Asia Pacific APAC Water Automation and Instrumentation Market Analysis, Insights and Forecast, 2019-2031
- 10.1. Market Analysis, Insights and Forecast - by Water Automation Solution
- 10.1.1. DCS
- 10.1.2. SCADA
- 10.1.3. PLC
- 10.1.4. HMI
- 10.1.5. Other Water Automation Solutions
- 10.2. Market Analysis, Insights and Forecast - by Water Instrumentation Solution
- 10.2.1. Pressure Transmitter
- 10.2.2. Level Transmitter
- 10.2.3. Temperature Transmitter
- 10.2.4. Liquid Analyzers
- 10.2.5. Gas Analyzers
- 10.2.6. Leakage Detection Systems
- 10.2.7. Flow Sensors/Transmitters
- 10.2.8. Other Water Instrumentation Solutions
- 10.3. Market Analysis, Insights and Forecast - by End-User Industry (Qualitative Analysis)
- 10.3.1. Chemical
- 10.3.2. Manufacturing
- 10.3.3. Food and Beverages
- 10.1. Market Analysis, Insights and Forecast - by Water Automation Solution
- 11. China APAC Water Automation and Instrumentation Market Analysis, Insights and Forecast, 2019-2031
- 12. India APAC Water Automation and Instrumentation Market Analysis, Insights and Forecast, 2019-2031
- 13. Japan APAC Water Automation and Instrumentation Market Analysis, Insights and Forecast, 2019-2031
- 14. Australia New Zealand APAC Water Automation and Instrumentation Market Analysis, Insights and Forecast, 2019-2031
- 15. Rest of Asia Pacific APAC Water Automation and Instrumentation Market Analysis, Insights and Forecast, 2019-2031
- 16. Competitive Analysis
- 16.1. Global Market Share Analysis 2024
- 16.2. Company Profiles
- 16.2.1 NALCO
- 16.2.1.1. Overview
- 16.2.1.2. Products
- 16.2.1.3. SWOT Analysis
- 16.2.1.4. Recent Developments
- 16.2.1.5. Financials (Based on Availability)
- 16.2.2 Phoenix Contact
- 16.2.2.1. Overview
- 16.2.2.2. Products
- 16.2.2.3. SWOT Analysis
- 16.2.2.4. Recent Developments
- 16.2.2.5. Financials (Based on Availability)
- 16.2.3 Endress + Hauser Pvt Ltd
- 16.2.3.1. Overview
- 16.2.3.2. Products
- 16.2.3.3. SWOT Analysis
- 16.2.3.4. Recent Developments
- 16.2.3.5. Financials (Based on Availability)
- 16.2.4 GE Corporation
- 16.2.4.1. Overview
- 16.2.4.2. Products
- 16.2.4.3. SWOT Analysis
- 16.2.4.4. Recent Developments
- 16.2.4.5. Financials (Based on Availability)
- 16.2.5 KROHNE LT
- 16.2.5.1. Overview
- 16.2.5.2. Products
- 16.2.5.3. SWOT Analysis
- 16.2.5.4. Recent Developments
- 16.2.5.5. Financials (Based on Availability)
- 16.2.6 MJK Automation
- 16.2.6.1. Overview
- 16.2.6.2. Products
- 16.2.6.3. SWOT Analysis
- 16.2.6.4. Recent Developments
- 16.2.6.5. Financials (Based on Availability)
- 16.2.7 Siemens AG
- 16.2.7.1. Overview
- 16.2.7.2. Products
- 16.2.7.3. SWOT Analysis
- 16.2.7.4. Recent Developments
- 16.2.7.5. Financials (Based on Availability)
- 16.2.8 Schneider Electric SE
- 16.2.8.1. Overview
- 16.2.8.2. Products
- 16.2.8.3. SWOT Analysis
- 16.2.8.4. Recent Developments
- 16.2.8.5. Financials (Based on Availability)
- 16.2.9 Emerson Electric
- 16.2.9.1. Overview
- 16.2.9.2. Products
- 16.2.9.3. SWOT Analysis
- 16.2.9.4. Recent Developments
- 16.2.9.5. Financials (Based on Availability)
- 16.2.10 ABB Group
- 16.2.10.1. Overview
- 16.2.10.2. Products
- 16.2.10.3. SWOT Analysis
- 16.2.10.4. Recent Developments
- 16.2.10.5. Financials (Based on Availability)
- 16.2.11 Rockwell Automation Inc
- 16.2.11.1. Overview
- 16.2.11.2. Products
- 16.2.11.3. SWOT Analysis
- 16.2.11.4. Recent Developments
- 16.2.11.5. Financials (Based on Availability)
- 16.2.12 Yokogawa Electric Corporation
- 16.2.12.1. Overview
- 16.2.12.2. Products
- 16.2.12.3. SWOT Analysis
- 16.2.12.4. Recent Developments
- 16.2.12.5. Financials (Based on Availability)
- 16.2.13 Mitsubishi Motors Corporation
- 16.2.13.1. Overview
- 16.2.13.2. Products
- 16.2.13.3. SWOT Analysis
- 16.2.13.4. Recent Developments
- 16.2.13.5. Financials (Based on Availability)
- 16.2.14 Eurotek India
- 16.2.14.1. Overview
- 16.2.14.2. Products
- 16.2.14.3. SWOT Analysis
- 16.2.14.4. Recent Developments
- 16.2.14.5. Financials (Based on Availability)
- 16.2.1 NALCO
List of Figures
- Figure 1: Global APAC Water Automation and Instrumentation Market Revenue Breakdown (Million, %) by Region 2024 & 2032
- Figure 2: Asia Pacific APAC Water Automation and Instrumentation Market Revenue (Million), by Country 2024 & 2032
- Figure 3: Asia Pacific APAC Water Automation and Instrumentation Market Revenue Share (%), by Country 2024 & 2032
- Figure 4: North America APAC Water Automation and Instrumentation Market Revenue (Million), by Water Automation Solution 2024 & 2032
- Figure 5: North America APAC Water Automation and Instrumentation Market Revenue Share (%), by Water Automation Solution 2024 & 2032
- Figure 6: North America APAC Water Automation and Instrumentation Market Revenue (Million), by Water Instrumentation Solution 2024 & 2032
- Figure 7: North America APAC Water Automation and Instrumentation Market Revenue Share (%), by Water Instrumentation Solution 2024 & 2032
- Figure 8: North America APAC Water Automation and Instrumentation Market Revenue (Million), by End-User Industry (Qualitative Analysis) 2024 & 2032
- Figure 9: North America APAC Water Automation and Instrumentation Market Revenue Share (%), by End-User Industry (Qualitative Analysis) 2024 & 2032
- Figure 10: North America APAC Water Automation and Instrumentation Market Revenue (Million), by Country 2024 & 2032
- Figure 11: North America APAC Water Automation and Instrumentation Market Revenue Share (%), by Country 2024 & 2032
- Figure 12: South America APAC Water Automation and Instrumentation Market Revenue (Million), by Water Automation Solution 2024 & 2032
- Figure 13: South America APAC Water Automation and Instrumentation Market Revenue Share (%), by Water Automation Solution 2024 & 2032
- Figure 14: South America APAC Water Automation and Instrumentation Market Revenue (Million), by Water Instrumentation Solution 2024 & 2032
- Figure 15: South America APAC Water Automation and Instrumentation Market Revenue Share (%), by Water Instrumentation Solution 2024 & 2032
- Figure 16: South America APAC Water Automation and Instrumentation Market Revenue (Million), by End-User Industry (Qualitative Analysis) 2024 & 2032
- Figure 17: South America APAC Water Automation and Instrumentation Market Revenue Share (%), by End-User Industry (Qualitative Analysis) 2024 & 2032
- Figure 18: South America APAC Water Automation and Instrumentation Market Revenue (Million), by Country 2024 & 2032
- Figure 19: South America APAC Water Automation and Instrumentation Market Revenue Share (%), by Country 2024 & 2032
- Figure 20: Europe APAC Water Automation and Instrumentation Market Revenue (Million), by Water Automation Solution 2024 & 2032
- Figure 21: Europe APAC Water Automation and Instrumentation Market Revenue Share (%), by Water Automation Solution 2024 & 2032
- Figure 22: Europe APAC Water Automation and Instrumentation Market Revenue (Million), by Water Instrumentation Solution 2024 & 2032
- Figure 23: Europe APAC Water Automation and Instrumentation Market Revenue Share (%), by Water Instrumentation Solution 2024 & 2032
- Figure 24: Europe APAC Water Automation and Instrumentation Market Revenue (Million), by End-User Industry (Qualitative Analysis) 2024 & 2032
- Figure 25: Europe APAC Water Automation and Instrumentation Market Revenue Share (%), by End-User Industry (Qualitative Analysis) 2024 & 2032
- Figure 26: Europe APAC Water Automation and Instrumentation Market Revenue (Million), by Country 2024 & 2032
- Figure 27: Europe APAC Water Automation and Instrumentation Market Revenue Share (%), by Country 2024 & 2032
- Figure 28: Middle East & Africa APAC Water Automation and Instrumentation Market Revenue (Million), by Water Automation Solution 2024 & 2032
- Figure 29: Middle East & Africa APAC Water Automation and Instrumentation Market Revenue Share (%), by Water Automation Solution 2024 & 2032
- Figure 30: Middle East & Africa APAC Water Automation and Instrumentation Market Revenue (Million), by Water Instrumentation Solution 2024 & 2032
- Figure 31: Middle East & Africa APAC Water Automation and Instrumentation Market Revenue Share (%), by Water Instrumentation Solution 2024 & 2032
- Figure 32: Middle East & Africa APAC Water Automation and Instrumentation Market Revenue (Million), by End-User Industry (Qualitative Analysis) 2024 & 2032
- Figure 33: Middle East & Africa APAC Water Automation and Instrumentation Market Revenue Share (%), by End-User Industry (Qualitative Analysis) 2024 & 2032
- Figure 34: Middle East & Africa APAC Water Automation and Instrumentation Market Revenue (Million), by Country 2024 & 2032
- Figure 35: Middle East & Africa APAC Water Automation and Instrumentation Market Revenue Share (%), by Country 2024 & 2032
- Figure 36: Asia Pacific APAC Water Automation and Instrumentation Market Revenue (Million), by Water Automation Solution 2024 & 2032
- Figure 37: Asia Pacific APAC Water Automation and Instrumentation Market Revenue Share (%), by Water Automation Solution 2024 & 2032
- Figure 38: Asia Pacific APAC Water Automation and Instrumentation Market Revenue (Million), by Water Instrumentation Solution 2024 & 2032
- Figure 39: Asia Pacific APAC Water Automation and Instrumentation Market Revenue Share (%), by Water Instrumentation Solution 2024 & 2032
- Figure 40: Asia Pacific APAC Water Automation and Instrumentation Market Revenue (Million), by End-User Industry (Qualitative Analysis) 2024 & 2032
- Figure 41: Asia Pacific APAC Water Automation and Instrumentation Market Revenue Share (%), by End-User Industry (Qualitative Analysis) 2024 & 2032
- Figure 42: Asia Pacific APAC Water Automation and Instrumentation Market Revenue (Million), by Country 2024 & 2032
- Figure 43: Asia Pacific APAC Water Automation and Instrumentation Market Revenue Share (%), by Country 2024 & 2032
List of Tables
- Table 1: Global APAC Water Automation and Instrumentation Market Revenue Million Forecast, by Region 2019 & 2032
- Table 2: Global APAC Water Automation and Instrumentation Market Revenue Million Forecast, by Water Automation Solution 2019 & 2032
- Table 3: Global APAC Water Automation and Instrumentation Market Revenue Million Forecast, by Water Instrumentation Solution 2019 & 2032
- Table 4: Global APAC Water Automation and Instrumentation Market Revenue Million Forecast, by End-User Industry (Qualitative Analysis) 2019 & 2032
- Table 5: Global APAC Water Automation and Instrumentation Market Revenue Million Forecast, by Region 2019 & 2032
- Table 6: Global APAC Water Automation and Instrumentation Market Revenue Million Forecast, by Country 2019 & 2032
- Table 7: China APAC Water Automation and Instrumentation Market Revenue (Million) Forecast, by Application 2019 & 2032
- Table 8: India APAC Water Automation and Instrumentation Market Revenue (Million) Forecast, by Application 2019 & 2032
- Table 9: Japan APAC Water Automation and Instrumentation Market Revenue (Million) Forecast, by Application 2019 & 2032
- Table 10: Australia New Zealand APAC Water Automation and Instrumentation Market Revenue (Million) Forecast, by Application 2019 & 2032
- Table 11: Rest of Asia Pacific APAC Water Automation and Instrumentation Market Revenue (Million) Forecast, by Application 2019 & 2032
- Table 12: Global APAC Water Automation and Instrumentation Market Revenue Million Forecast, by Water Automation Solution 2019 & 2032
- Table 13: Global APAC Water Automation and Instrumentation Market Revenue Million Forecast, by Water Instrumentation Solution 2019 & 2032
- Table 14: Global APAC Water Automation and Instrumentation Market Revenue Million Forecast, by End-User Industry (Qualitative Analysis) 2019 & 2032
- Table 15: Global APAC Water Automation and Instrumentation Market Revenue Million Forecast, by Country 2019 & 2032
- Table 16: United States APAC Water Automation and Instrumentation Market Revenue (Million) Forecast, by Application 2019 & 2032
- Table 17: Canada APAC Water Automation and Instrumentation Market Revenue (Million) Forecast, by Application 2019 & 2032
- Table 18: Mexico APAC Water Automation and Instrumentation Market Revenue (Million) Forecast, by Application 2019 & 2032
- Table 19: Global APAC Water Automation and Instrumentation Market Revenue Million Forecast, by Water Automation Solution 2019 & 2032
- Table 20: Global APAC Water Automation and Instrumentation Market Revenue Million Forecast, by Water Instrumentation Solution 2019 & 2032
- Table 21: Global APAC Water Automation and Instrumentation Market Revenue Million Forecast, by End-User Industry (Qualitative Analysis) 2019 & 2032
- Table 22: Global APAC Water Automation and Instrumentation Market Revenue Million Forecast, by Country 2019 & 2032
- Table 23: Brazil APAC Water Automation and Instrumentation Market Revenue (Million) Forecast, by Application 2019 & 2032
- Table 24: Argentina APAC Water Automation and Instrumentation Market Revenue (Million) Forecast, by Application 2019 & 2032
- Table 25: Rest of South America APAC Water Automation and Instrumentation Market Revenue (Million) Forecast, by Application 2019 & 2032
- Table 26: Global APAC Water Automation and Instrumentation Market Revenue Million Forecast, by Water Automation Solution 2019 & 2032
- Table 27: Global APAC Water Automation and Instrumentation Market Revenue Million Forecast, by Water Instrumentation Solution 2019 & 2032
- Table 28: Global APAC Water Automation and Instrumentation Market Revenue Million Forecast, by End-User Industry (Qualitative Analysis) 2019 & 2032
- Table 29: Global APAC Water Automation and Instrumentation Market Revenue Million Forecast, by Country 2019 & 2032
- Table 30: United Kingdom APAC Water Automation and Instrumentation Market Revenue (Million) Forecast, by Application 2019 & 2032
- Table 31: Germany APAC Water Automation and Instrumentation Market Revenue (Million) Forecast, by Application 2019 & 2032
- Table 32: France APAC Water Automation and Instrumentation Market Revenue (Million) Forecast, by Application 2019 & 2032
- Table 33: Italy APAC Water Automation and Instrumentation Market Revenue (Million) Forecast, by Application 2019 & 2032
- Table 34: Spain APAC Water Automation and Instrumentation Market Revenue (Million) Forecast, by Application 2019 & 2032
- Table 35: Russia APAC Water Automation and Instrumentation Market Revenue (Million) Forecast, by Application 2019 & 2032
- Table 36: Benelux APAC Water Automation and Instrumentation Market Revenue (Million) Forecast, by Application 2019 & 2032
- Table 37: Nordics APAC Water Automation and Instrumentation Market Revenue (Million) Forecast, by Application 2019 & 2032
- Table 38: Rest of Europe APAC Water Automation and Instrumentation Market Revenue (Million) Forecast, by Application 2019 & 2032
- Table 39: Global APAC Water Automation and Instrumentation Market Revenue Million Forecast, by Water Automation Solution 2019 & 2032
- Table 40: Global APAC Water Automation and Instrumentation Market Revenue Million Forecast, by Water Instrumentation Solution 2019 & 2032
- Table 41: Global APAC Water Automation and Instrumentation Market Revenue Million Forecast, by End-User Industry (Qualitative Analysis) 2019 & 2032
- Table 42: Global APAC Water Automation and Instrumentation Market Revenue Million Forecast, by Country 2019 & 2032
- Table 43: Turkey APAC Water Automation and Instrumentation Market Revenue (Million) Forecast, by Application 2019 & 2032
- Table 44: Israel APAC Water Automation and Instrumentation Market Revenue (Million) Forecast, by Application 2019 & 2032
- Table 45: GCC APAC Water Automation and Instrumentation Market Revenue (Million) Forecast, by Application 2019 & 2032
- Table 46: North Africa APAC Water Automation and Instrumentation Market Revenue (Million) Forecast, by Application 2019 & 2032
- Table 47: South Africa APAC Water Automation and Instrumentation Market Revenue (Million) Forecast, by Application 2019 & 2032
- Table 48: Rest of Middle East & Africa APAC Water Automation and Instrumentation Market Revenue (Million) Forecast, by Application 2019 & 2032
- Table 49: Global APAC Water Automation and Instrumentation Market Revenue Million Forecast, by Water Automation Solution 2019 & 2032
- Table 50: Global APAC Water Automation and Instrumentation Market Revenue Million Forecast, by Water Instrumentation Solution 2019 & 2032
- Table 51: Global APAC Water Automation and Instrumentation Market Revenue Million Forecast, by End-User Industry (Qualitative Analysis) 2019 & 2032
- Table 52: Global APAC Water Automation and Instrumentation Market Revenue Million Forecast, by Country 2019 & 2032
- Table 53: China APAC Water Automation and Instrumentation Market Revenue (Million) Forecast, by Application 2019 & 2032
- Table 54: India APAC Water Automation and Instrumentation Market Revenue (Million) Forecast, by Application 2019 & 2032
- Table 55: Japan APAC Water Automation and Instrumentation Market Revenue (Million) Forecast, by Application 2019 & 2032
- Table 56: South Korea APAC Water Automation and Instrumentation Market Revenue (Million) Forecast, by Application 2019 & 2032
- Table 57: ASEAN APAC Water Automation and Instrumentation Market Revenue (Million) Forecast, by Application 2019 & 2032
- Table 58: Oceania APAC Water Automation and Instrumentation Market Revenue (Million) Forecast, by Application 2019 & 2032
- Table 59: Rest of Asia Pacific APAC Water Automation and Instrumentation Market Revenue (Million) Forecast, by Application 2019 & 2032
Frequently Asked Questions
1. What is the projected Compound Annual Growth Rate (CAGR) of the APAC Water Automation and Instrumentation Market?
The projected CAGR is approximately 8.10%.
2. Which companies are prominent players in the APAC Water Automation and Instrumentation Market?
Key companies in the market include NALCO, Phoenix Contact, Endress + Hauser Pvt Ltd, GE Corporation, KROHNE LT, MJK Automation, Siemens AG, Schneider Electric SE, Emerson Electric, ABB Group, Rockwell Automation Inc, Yokogawa Electric Corporation, Mitsubishi Motors Corporation, Eurotek India.
3. What are the main segments of the APAC Water Automation and Instrumentation Market?
The market segments include Water Automation Solution, Water Instrumentation Solution, End-User Industry (Qualitative Analysis).
4. Can you provide details about the market size?
The market size is estimated to be USD XX Million as of 2022.
5. What are some drivers contributing to market growth?
Government Regulation to Save Water Resources and Energy; Increase in Adoption of Smart Water Technologies.
6. What are the notable trends driving market growth?
Demand from Food and Beverage Industry to Witness a Significant Growth Rate.
7. Are there any restraints impacting market growth?
Data Privacy; The Complex Structure of Cloud Storage.
8. Can you provide examples of recent developments in the market?
March 2021 - In response to the COVID-19 pandemic, Hokkaido University, Robotic Biology Institute Inc., iLAC Co., Ltd, and Shionogi & Co., Ltd entered a memorandum of understanding toward the establishment of an automated system for the analysis of the novel coronavirus in wastewater.
9. What pricing options are available for accessing the report?
Pricing options include single-user, multi-user, and enterprise licenses priced at USD 4750, USD 4950, and USD 6800 respectively.
10. Is the market size provided in terms of value or volume?
The market size is provided in terms of value, measured in Million.
11. Are there any specific market keywords associated with the report?
Yes, the market keyword associated with the report is "APAC Water Automation and Instrumentation Market," which aids in identifying and referencing the specific market segment covered.
12. How do I determine which pricing option suits my needs best?
The pricing options vary based on user requirements and access needs. Individual users may opt for single-user licenses, while businesses requiring broader access may choose multi-user or enterprise licenses for cost-effective access to the report.
13. Are there any additional resources or data provided in the APAC Water Automation and Instrumentation Market report?
While the report offers comprehensive insights, it's advisable to review the specific contents or supplementary materials provided to ascertain if additional resources or data are available.
14. How can I stay updated on further developments or reports in the APAC Water Automation and Instrumentation Market?
To stay informed about further developments, trends, and reports in the APAC Water Automation and Instrumentation Market, consider subscribing to industry newsletters, following relevant companies and organizations, or regularly checking reputable industry news sources and publications.
Methodology
Step 1 - Identification of Relevant Samples Size from Population Database


Step 2 - Approaches for Defining Global Market Size (Value, Volume* & Price*)

Note*: In applicable scenarios
Step 3 - Data Sources
Primary Research
- Web Analytics
- Survey Reports
- Research Institute
- Latest Research Reports
- Opinion Leaders
Secondary Research
- Annual Reports
- White Paper
- Latest Press Release
- Industry Association
- Paid Database
- Investor Presentations

Step 4 - Data Triangulation
Involves using different sources of information in order to increase the validity of a study
These sources are likely to be stakeholders in a program - participants, other researchers, program staff, other community members, and so on.
Then we put all data in single framework & apply various statistical tools to find out the dynamic on the market.
During the analysis stage, feedback from the stakeholder groups would be compared to determine areas of agreement as well as areas of divergence


