Key Insights
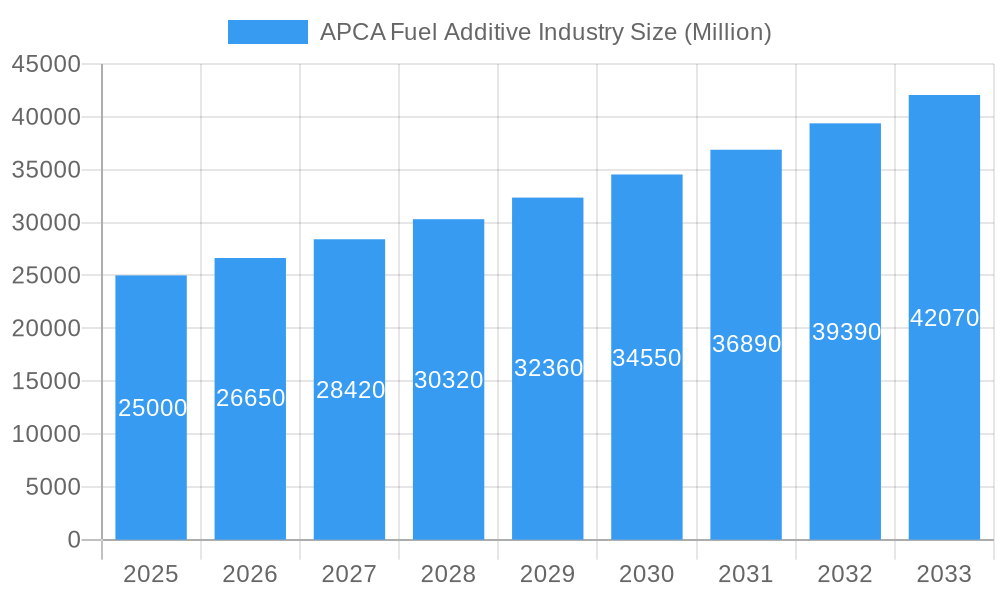
The Asia-Pacific (APAC) fuel additive market is projected for significant expansion, driven by escalating vehicle ownership, stringent environmental regulations, and a growing demand for enhanced fuel efficiency. This market is forecast to achieve a CAGR of 6.50% from 2025 to 2033, reflecting substantial growth. Key product segments such as deposit control, cetane improvers, and lubricity additives are pivotal for maintaining optimal engine performance and longevity. The increasing application across diesel and gasoline fuels, particularly in burgeoning APAC economies like China, India, and Southeast Asia, further propels market development. The adoption of advanced fuel technologies and the imperative to meet evolving emission standards are also key growth catalysts. Despite potential challenges like volatile crude oil prices and economic fluctuations, the long-term outlook remains robust, supported by ongoing infrastructure development and government support for cleaner fuel solutions.
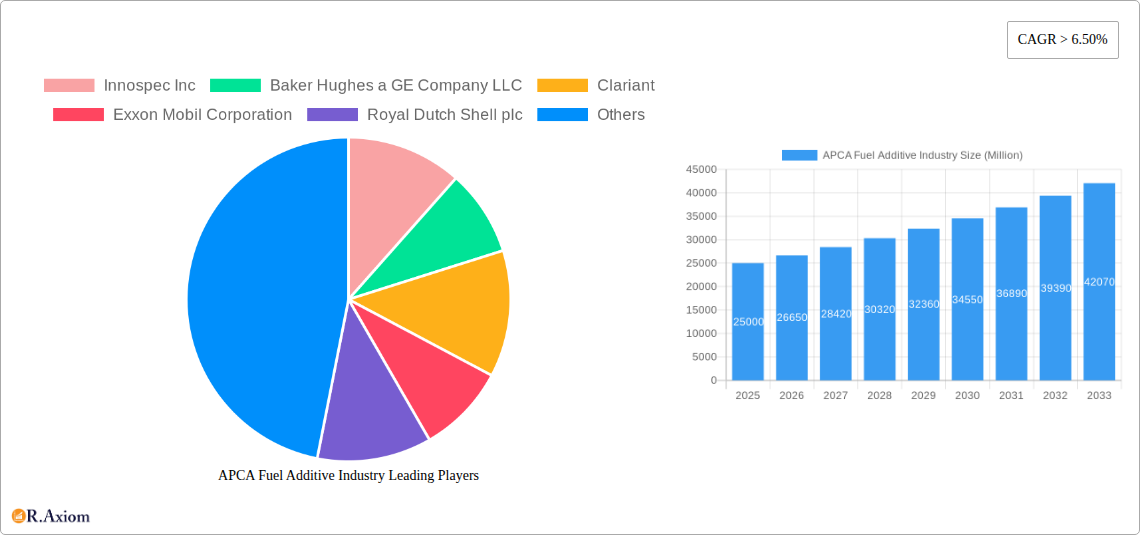
APCA Fuel Additive Industry Market Size (In Million)
Market growth varies across the APAC region. China and India, with their expansive automotive sectors and industrialization, are primary drivers of the APAC market size. However, Southeast Asian countries are also exhibiting considerable growth potential, fueled by rising disposable incomes and urbanization, which are increasing vehicle adoption and transportation needs. The market is characterized by intense competition among established global players such as ExxonMobil, BASF, and Lubrizol, alongside dynamic regional enterprises. This competitive landscape fosters innovation in developing more effective and sustainable fuel additive solutions. Companies are strategically prioritizing product diversification and geographical outreach, investing in research and development to address specific regional requirements and fuel types.
APCA Fuel Additive Industry Company Market Share
APCA Fuel Additive Industry: A Comprehensive Market Analysis (2019-2033)
This in-depth report provides a comprehensive analysis of the APCA (Anti-Pollution Control Additives) fuel additive industry, encompassing market size, segmentation, growth drivers, challenges, and future outlook. The study period covers 2019-2033, with 2025 serving as the base and estimated year. The forecast period spans 2025-2033, while the historical period analyzed is 2019-2024. The report offers actionable insights for industry stakeholders, including manufacturers, distributors, and investors. The total market value in 2025 is estimated at $xx Million.
APCA Fuel Additive Industry Market Concentration & Innovation
This section analyzes the competitive landscape of the APCA fuel additive market, assessing market concentration, innovation drivers, regulatory influences, and strategic activities. The industry exhibits moderate concentration, with several major players holding significant market share. In 2025, the top five companies—Innospec Inc, Baker Hughes a GE Company LLC, Clariant, Exxon Mobil Corporation, and Royal Dutch Shell plc—are estimated to collectively control approximately xx% of the market. However, several smaller players contribute significantly to innovation and niche applications.
- Market Share: Innospec Inc (xx%), Baker Hughes a GE Company LLC (xx%), Clariant (xx%), Exxon Mobil Corporation (xx%), Royal Dutch Shell plc (xx%). (Note: These percentages are estimates.)
- Innovation Drivers: Stringent emission regulations, demand for improved fuel efficiency, and the development of advanced engine technologies are key drivers of innovation.
- Regulatory Frameworks: Government regulations concerning fuel quality and emissions significantly impact the industry's growth trajectory and product development.
- Product Substitutes: The availability of biofuels and alternative energy sources presents some level of substitution pressure.
- M&A Activities: The industry has witnessed a moderate level of merger and acquisition activity in recent years, primarily aimed at expanding product portfolios and market reach. Total M&A deal value between 2019-2024 is estimated at $xx Million.
APCA Fuel Additive Industry Industry Trends & Insights
The global APCA fuel additive market is experiencing robust growth, driven by several key factors. The rising demand for cleaner fuels, stringent environmental regulations, and the increasing adoption of advanced engine technologies are among the primary growth drivers. The compound annual growth rate (CAGR) for the forecast period (2025-2033) is projected to be xx%. Market penetration within emerging economies is also expected to increase significantly due to rapid industrialization and urbanization. Technological advancements in additive formulation and production processes are further enhancing efficiency and performance. Competitive dynamics are characterized by both cooperation and rivalry, with major players actively engaging in research and development, strategic partnerships, and expansion initiatives.
Dominant Markets & Segments in APCA Fuel Additive Industry
The diesel fuel segment is the largest application area for APCA fuel additives, accounting for approximately xx% of the total market in 2025. This dominance is attributed to the higher volume of diesel fuel consumption globally, particularly in transportation and industrial sectors. Within product types, deposit control additives hold the largest market share, exceeding xx% in 2025. This is driven by the increasing need for maintaining engine cleanliness and optimal performance.
- Key Drivers for Diesel Fuel Segment Dominance:
- High volume consumption in transportation and industrial sectors.
- Stringent emission regulations for diesel vehicles.
- Continuous demand for enhanced engine performance and lifespan.
- Key Drivers for Deposit Control Additives Dominance:
- Growing concern for engine cleanliness and efficiency.
- Enhanced fuel economy due to reduced deposit formation.
- Stricter emission standards requiring optimized engine operation.
Geographically, the Asia-Pacific region is expected to be the fastest-growing market, driven by robust economic growth, rising vehicle ownership, and expanding industrial activity.
APCA Fuel Additive Industry Product Developments
Recent innovations focus on developing more efficient and environmentally friendly APCA fuel additives. These include formulations that improve fuel economy, reduce emissions, and enhance engine performance. The focus is also shifting toward multifunctional additives that address multiple issues simultaneously, offering cost and performance advantages. This reflects technological trends toward more sustainable and integrated solutions.
Report Scope & Segmentation Analysis
This report segments the APCA fuel additive market by product type (Deposit Control, Cetane Improvers, Lubricity Additives, Antioxidants, Anticorrosion, Cold Flow Improvers, Antiknock Agents, Other Product Types) and application (Diesel, Gasoline, Jet Fuel, Other Applications). Each segment's market size, growth projections, and competitive dynamics are comprehensively analyzed. For example, the deposit control segment is expected to maintain a strong growth trajectory due to its crucial role in maintaining engine cleanliness and efficiency. Similarly, the diesel fuel application segment is anticipated to witness significant growth driven by the increasing demand for diesel-powered vehicles and industrial machinery.
Key Drivers of APCA Fuel Additive Industry Growth
Several factors drive the growth of the APCA fuel additive industry. Stringent emission regulations worldwide mandate the use of additives to meet increasingly strict standards. The growing demand for fuel-efficient vehicles and improved engine performance also pushes for enhanced additives. Technological advancements in additive formulation and production lead to greater efficiency and performance characteristics, driving adoption.
Challenges in the APCA Fuel Additive Industry Sector
The APCA fuel additive industry faces several challenges. Fluctuations in crude oil prices impact the cost of raw materials, affecting profitability. Intense competition from established players and emerging companies puts pressure on margins. Furthermore, stringent regulatory compliance requirements necessitate continuous investment in research and development to meet evolving emission standards. Supply chain disruptions also present significant challenges to production and distribution.
Emerging Opportunities in APCA Fuel Additive Industry
The industry presents significant opportunities for growth. The increasing adoption of renewable fuels and biofuels creates a need for additives optimized for these alternative fuel sources. The development of next-generation additives with enhanced performance characteristics, such as reduced emissions and improved fuel economy, presents a significant growth area. Expanding into emerging markets with less stringent emission standards initially, but growing regulatory focus, presents opportunities for early market capture.
Leading Players in the APCA Fuel Additive Industry Market
- Innospec Inc
- Baker Hughes a GE Company LLC
- Clariant
- Exxon Mobil Corporation
- Royal Dutch Shell plc
- Evonik Industries AG
- LANXESS
- Croda International Plc
- BASF SE
- Chevron Corporation
- The Lubrizol Corporation
- Dorfketal Chemicals (I) Pvt Ltd
- Eni SpA
- Total
- Afton Chemical
Key Developments in APCA Fuel Additive Industry Industry
- January 2023: Innospec Inc. launched a new generation of deposit control additive.
- June 2022: Clariant and a partner announced a joint venture focused on bio-based fuel additives.
- October 2021: ExxonMobil Corporation acquired a smaller additive producer, expanding its product portfolio. (Note: These are example developments. The actual report will include more current and detailed information.)
Strategic Outlook for APCA Fuel Additive Industry Market
The APCA fuel additive market is poised for continued growth, driven by increasing demand from both developed and developing economies. Stringent emission regulations and the growing need for fuel efficiency will continue to fuel demand for advanced additive technologies. Companies focused on research and development, strategic partnerships, and expansion into emerging markets are expected to achieve greater success in this dynamic and evolving industry. The market is expected to reach $xx Million by 2033.
APCA Fuel Additive Industry Segmentation
-
1. Product Type
- 1.1. Deposit Control
- 1.2. Cetane Improvers
- 1.3. Lubricity Additives
- 1.4. Antioxidants
- 1.5. Anticorrosion
- 1.6. Cold Flow Improvers
- 1.7. Antiknock Agents
- 1.8. Other Product Types
-
2. Application
- 2.1. Diesel
- 2.2. Gasoline
- 2.3. Jet Fuel
- 2.4. Other Applications
-
3. Geography
- 3.1. China
- 3.2. India
- 3.3. Japan
- 3.4. South Korea
- 3.5. Rest of Asia-Pacific
APCA Fuel Additive Industry Segmentation By Geography
- 1. China
- 2. India
- 3. Japan
- 4. South Korea
- 5. Rest of Asia Pacific
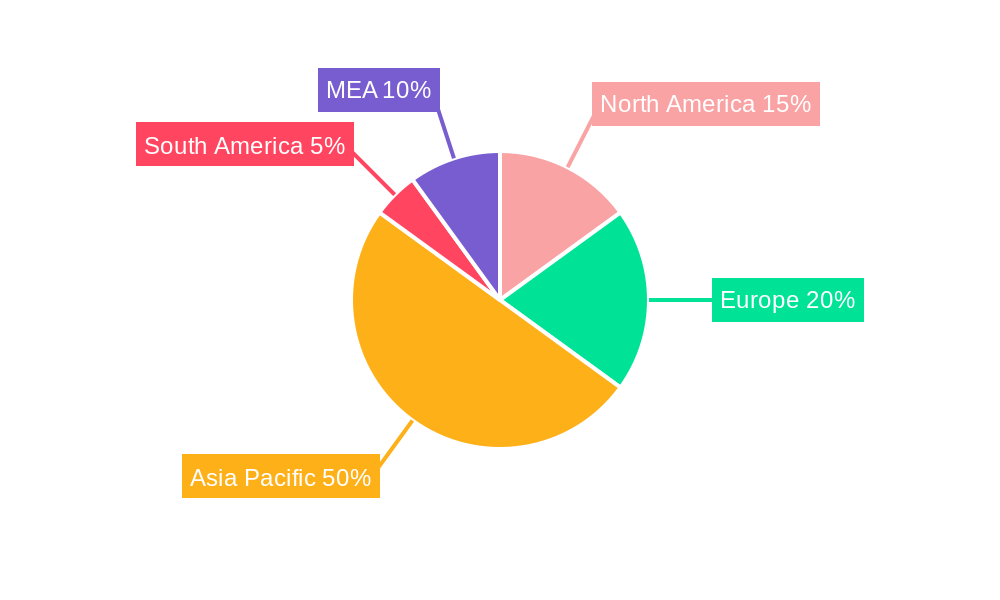
APCA Fuel Additive Industry Regional Market Share
Geographic Coverage of APCA Fuel Additive Industry
APCA Fuel Additive Industry REPORT HIGHLIGHTS
| Aspects | Details |
|---|---|
| Study Period | 2020-2034 |
| Base Year | 2025 |
| Estimated Year | 2026 |
| Forecast Period | 2026-2034 |
| Historical Period | 2020-2025 |
| Growth Rate | CAGR of 4.5% from 2020-2034 |
| Segmentation |
|
Table of Contents
- 1. Introduction
- 1.1. Research Scope
- 1.2. Market Segmentation
- 1.3. Research Objective
- 1.4. Definitions and Assumptions
- 2. Executive Summary
- 2.1. Market Snapshot
- 3. Market Dynamics
- 3.1. Market Drivers
- 3.2. Market Restrains
- 3.3. Market Trends
- 3.4. Market Opportunities
- 4. Market Factor Analysis
- 4.1. Porters Five Forces
- 4.1.1. Bargaining Power of Suppliers
- 4.1.2. Bargaining Power of Buyers
- 4.1.3. Threat of New Entrants
- 4.1.4. Threat of Substitutes
- 4.1.5. Competitive Rivalry
- 4.2. PESTEL analysis
- 4.3. BCG Analysis
- 4.3.1. Stars (High Growth, High Market Share)
- 4.3.2. Cash Cows (Low Growth, High Market Share)
- 4.3.3. Question Mark (High Growth, Low Market Share)
- 4.3.4. Dogs (Low Growth, Low Market Share)
- 4.4. Ansoff Matrix Analysis
- 4.5. Supply Chain Analysis
- 4.6. Regulatory Landscape
- 4.7. Current Market Potential and Opportunity Assessment (TAM–SAM–SOM Framework)
- 4.8. RAX Analyst Note
- 4.1. Porters Five Forces
- 5. Market Analysis, Insights and Forecast 2021-2033
- 5.1. Market Analysis, Insights and Forecast - by Product Type
- 5.1.1. Deposit Control
- 5.1.2. Cetane Improvers
- 5.1.3. Lubricity Additives
- 5.1.4. Antioxidants
- 5.1.5. Anticorrosion
- 5.1.6. Cold Flow Improvers
- 5.1.7. Antiknock Agents
- 5.1.8. Other Product Types
- 5.2. Market Analysis, Insights and Forecast - by Application
- 5.2.1. Diesel
- 5.2.2. Gasoline
- 5.2.3. Jet Fuel
- 5.2.4. Other Applications
- 5.3. Market Analysis, Insights and Forecast - by Geography
- 5.3.1. China
- 5.3.2. India
- 5.3.3. Japan
- 5.3.4. South Korea
- 5.3.5. Rest of Asia-Pacific
- 5.4. Market Analysis, Insights and Forecast - by Region
- 5.4.1. China
- 5.4.2. India
- 5.4.3. Japan
- 5.4.4. South Korea
- 5.4.5. Rest of Asia Pacific
- 5.1. Market Analysis, Insights and Forecast - by Product Type
- 6. Global APCA Fuel Additive Industry Analysis, Insights and Forecast, 2021-2033
- 6.1. Market Analysis, Insights and Forecast - by Product Type
- 6.1.1. Deposit Control
- 6.1.2. Cetane Improvers
- 6.1.3. Lubricity Additives
- 6.1.4. Antioxidants
- 6.1.5. Anticorrosion
- 6.1.6. Cold Flow Improvers
- 6.1.7. Antiknock Agents
- 6.1.8. Other Product Types
- 6.2. Market Analysis, Insights and Forecast - by Application
- 6.2.1. Diesel
- 6.2.2. Gasoline
- 6.2.3. Jet Fuel
- 6.2.4. Other Applications
- 6.3. Market Analysis, Insights and Forecast - by Geography
- 6.3.1. China
- 6.3.2. India
- 6.3.3. Japan
- 6.3.4. South Korea
- 6.3.5. Rest of Asia-Pacific
- 6.1. Market Analysis, Insights and Forecast - by Product Type
- 7. China APCA Fuel Additive Industry Analysis, Insights and Forecast, 2020-2032
- 7.1. Market Analysis, Insights and Forecast - by Product Type
- 7.1.1. Deposit Control
- 7.1.2. Cetane Improvers
- 7.1.3. Lubricity Additives
- 7.1.4. Antioxidants
- 7.1.5. Anticorrosion
- 7.1.6. Cold Flow Improvers
- 7.1.7. Antiknock Agents
- 7.1.8. Other Product Types
- 7.2. Market Analysis, Insights and Forecast - by Application
- 7.2.1. Diesel
- 7.2.2. Gasoline
- 7.2.3. Jet Fuel
- 7.2.4. Other Applications
- 7.3. Market Analysis, Insights and Forecast - by Geography
- 7.3.1. China
- 7.3.2. India
- 7.3.3. Japan
- 7.3.4. South Korea
- 7.3.5. Rest of Asia-Pacific
- 7.1. Market Analysis, Insights and Forecast - by Product Type
- 8. India APCA Fuel Additive Industry Analysis, Insights and Forecast, 2020-2032
- 8.1. Market Analysis, Insights and Forecast - by Product Type
- 8.1.1. Deposit Control
- 8.1.2. Cetane Improvers
- 8.1.3. Lubricity Additives
- 8.1.4. Antioxidants
- 8.1.5. Anticorrosion
- 8.1.6. Cold Flow Improvers
- 8.1.7. Antiknock Agents
- 8.1.8. Other Product Types
- 8.2. Market Analysis, Insights and Forecast - by Application
- 8.2.1. Diesel
- 8.2.2. Gasoline
- 8.2.3. Jet Fuel
- 8.2.4. Other Applications
- 8.3. Market Analysis, Insights and Forecast - by Geography
- 8.3.1. China
- 8.3.2. India
- 8.3.3. Japan
- 8.3.4. South Korea
- 8.3.5. Rest of Asia-Pacific
- 8.1. Market Analysis, Insights and Forecast - by Product Type
- 9. Japan APCA Fuel Additive Industry Analysis, Insights and Forecast, 2020-2032
- 9.1. Market Analysis, Insights and Forecast - by Product Type
- 9.1.1. Deposit Control
- 9.1.2. Cetane Improvers
- 9.1.3. Lubricity Additives
- 9.1.4. Antioxidants
- 9.1.5. Anticorrosion
- 9.1.6. Cold Flow Improvers
- 9.1.7. Antiknock Agents
- 9.1.8. Other Product Types
- 9.2. Market Analysis, Insights and Forecast - by Application
- 9.2.1. Diesel
- 9.2.2. Gasoline
- 9.2.3. Jet Fuel
- 9.2.4. Other Applications
- 9.3. Market Analysis, Insights and Forecast - by Geography
- 9.3.1. China
- 9.3.2. India
- 9.3.3. Japan
- 9.3.4. South Korea
- 9.3.5. Rest of Asia-Pacific
- 9.1. Market Analysis, Insights and Forecast - by Product Type
- 10. South Korea APCA Fuel Additive Industry Analysis, Insights and Forecast, 2020-2032
- 10.1. Market Analysis, Insights and Forecast - by Product Type
- 10.1.1. Deposit Control
- 10.1.2. Cetane Improvers
- 10.1.3. Lubricity Additives
- 10.1.4. Antioxidants
- 10.1.5. Anticorrosion
- 10.1.6. Cold Flow Improvers
- 10.1.7. Antiknock Agents
- 10.1.8. Other Product Types
- 10.2. Market Analysis, Insights and Forecast - by Application
- 10.2.1. Diesel
- 10.2.2. Gasoline
- 10.2.3. Jet Fuel
- 10.2.4. Other Applications
- 10.3. Market Analysis, Insights and Forecast - by Geography
- 10.3.1. China
- 10.3.2. India
- 10.3.3. Japan
- 10.3.4. South Korea
- 10.3.5. Rest of Asia-Pacific
- 10.1. Market Analysis, Insights and Forecast - by Product Type
- 11. Rest of Asia Pacific APCA Fuel Additive Industry Analysis, Insights and Forecast, 2020-2032
- 11.1. Market Analysis, Insights and Forecast - by Product Type
- 11.1.1. Deposit Control
- 11.1.2. Cetane Improvers
- 11.1.3. Lubricity Additives
- 11.1.4. Antioxidants
- 11.1.5. Anticorrosion
- 11.1.6. Cold Flow Improvers
- 11.1.7. Antiknock Agents
- 11.1.8. Other Product Types
- 11.2. Market Analysis, Insights and Forecast - by Application
- 11.2.1. Diesel
- 11.2.2. Gasoline
- 11.2.3. Jet Fuel
- 11.2.4. Other Applications
- 11.3. Market Analysis, Insights and Forecast - by Geography
- 11.3.1. China
- 11.3.2. India
- 11.3.3. Japan
- 11.3.4. South Korea
- 11.3.5. Rest of Asia-Pacific
- 11.1. Market Analysis, Insights and Forecast - by Product Type
- 12. Competitive Analysis
- 12.1. Company Profiles
- 12.1.1 Innospec Inc
- 12.1.1.1. Company Overview
- 12.1.1.2. Products
- 12.1.1.3. Company Financials
- 12.1.1.4. SWOT Analysis
- 12.1.2 Baker Hughes a GE Company LLC
- 12.1.2.1. Company Overview
- 12.1.2.2. Products
- 12.1.2.3. Company Financials
- 12.1.2.4. SWOT Analysis
- 12.1.3 Clariant
- 12.1.3.1. Company Overview
- 12.1.3.2. Products
- 12.1.3.3. Company Financials
- 12.1.3.4. SWOT Analysis
- 12.1.4 Exxon Mobil Corporation
- 12.1.4.1. Company Overview
- 12.1.4.2. Products
- 12.1.4.3. Company Financials
- 12.1.4.4. SWOT Analysis
- 12.1.5 Royal Dutch Shell plc
- 12.1.5.1. Company Overview
- 12.1.5.2. Products
- 12.1.5.3. Company Financials
- 12.1.5.4. SWOT Analysis
- 12.1.6 Evonik Industries AG
- 12.1.6.1. Company Overview
- 12.1.6.2. Products
- 12.1.6.3. Company Financials
- 12.1.6.4. SWOT Analysis
- 12.1.7 LANXESS
- 12.1.7.1. Company Overview
- 12.1.7.2. Products
- 12.1.7.3. Company Financials
- 12.1.7.4. SWOT Analysis
- 12.1.8 Croda International Plc
- 12.1.8.1. Company Overview
- 12.1.8.2. Products
- 12.1.8.3. Company Financials
- 12.1.8.4. SWOT Analysis
- 12.1.9 BASF SE
- 12.1.9.1. Company Overview
- 12.1.9.2. Products
- 12.1.9.3. Company Financials
- 12.1.9.4. SWOT Analysis
- 12.1.10 Chevron Corporation
- 12.1.10.1. Company Overview
- 12.1.10.2. Products
- 12.1.10.3. Company Financials
- 12.1.10.4. SWOT Analysis
- 12.1.11 The Lubrizol Corporation
- 12.1.11.1. Company Overview
- 12.1.11.2. Products
- 12.1.11.3. Company Financials
- 12.1.11.4. SWOT Analysis
- 12.1.12 Dorfketal Chemicals (I) Pvt Ltd
- 12.1.12.1. Company Overview
- 12.1.12.2. Products
- 12.1.12.3. Company Financials
- 12.1.12.4. SWOT Analysis
- 12.1.13 Eni SpA
- 12.1.13.1. Company Overview
- 12.1.13.2. Products
- 12.1.13.3. Company Financials
- 12.1.13.4. SWOT Analysis
- 12.1.14 Total*List Not Exhaustive
- 12.1.14.1. Company Overview
- 12.1.14.2. Products
- 12.1.14.3. Company Financials
- 12.1.14.4. SWOT Analysis
- 12.1.15 Afton Chemical
- 12.1.15.1. Company Overview
- 12.1.15.2. Products
- 12.1.15.3. Company Financials
- 12.1.15.4. SWOT Analysis
- 12.1.1 Innospec Inc
- 12.2. Market Entropy
- 12.2.1 Company's Key Areas Served
- 12.2.2 Recent Developments
- 12.3. Company Market Share Analysis 2025
- 12.3.1 Top 5 Companies Market Share Analysis
- 12.3.2 Top 3 Companies Market Share Analysis
- 12.4. List of Potential Customers
- 13. Research Methodology
List of Figures
- Figure 1: Global APCA Fuel Additive Industry Revenue Breakdown (million, %) by Region 2025 & 2033
- Figure 2: China APCA Fuel Additive Industry Revenue (million), by Product Type 2025 & 2033
- Figure 3: China APCA Fuel Additive Industry Revenue Share (%), by Product Type 2025 & 2033
- Figure 4: China APCA Fuel Additive Industry Revenue (million), by Application 2025 & 2033
- Figure 5: China APCA Fuel Additive Industry Revenue Share (%), by Application 2025 & 2033
- Figure 6: China APCA Fuel Additive Industry Revenue (million), by Geography 2025 & 2033
- Figure 7: China APCA Fuel Additive Industry Revenue Share (%), by Geography 2025 & 2033
- Figure 8: China APCA Fuel Additive Industry Revenue (million), by Country 2025 & 2033
- Figure 9: China APCA Fuel Additive Industry Revenue Share (%), by Country 2025 & 2033
- Figure 10: India APCA Fuel Additive Industry Revenue (million), by Product Type 2025 & 2033
- Figure 11: India APCA Fuel Additive Industry Revenue Share (%), by Product Type 2025 & 2033
- Figure 12: India APCA Fuel Additive Industry Revenue (million), by Application 2025 & 2033
- Figure 13: India APCA Fuel Additive Industry Revenue Share (%), by Application 2025 & 2033
- Figure 14: India APCA Fuel Additive Industry Revenue (million), by Geography 2025 & 2033
- Figure 15: India APCA Fuel Additive Industry Revenue Share (%), by Geography 2025 & 2033
- Figure 16: India APCA Fuel Additive Industry Revenue (million), by Country 2025 & 2033
- Figure 17: India APCA Fuel Additive Industry Revenue Share (%), by Country 2025 & 2033
- Figure 18: Japan APCA Fuel Additive Industry Revenue (million), by Product Type 2025 & 2033
- Figure 19: Japan APCA Fuel Additive Industry Revenue Share (%), by Product Type 2025 & 2033
- Figure 20: Japan APCA Fuel Additive Industry Revenue (million), by Application 2025 & 2033
- Figure 21: Japan APCA Fuel Additive Industry Revenue Share (%), by Application 2025 & 2033
- Figure 22: Japan APCA Fuel Additive Industry Revenue (million), by Geography 2025 & 2033
- Figure 23: Japan APCA Fuel Additive Industry Revenue Share (%), by Geography 2025 & 2033
- Figure 24: Japan APCA Fuel Additive Industry Revenue (million), by Country 2025 & 2033
- Figure 25: Japan APCA Fuel Additive Industry Revenue Share (%), by Country 2025 & 2033
- Figure 26: South Korea APCA Fuel Additive Industry Revenue (million), by Product Type 2025 & 2033
- Figure 27: South Korea APCA Fuel Additive Industry Revenue Share (%), by Product Type 2025 & 2033
- Figure 28: South Korea APCA Fuel Additive Industry Revenue (million), by Application 2025 & 2033
- Figure 29: South Korea APCA Fuel Additive Industry Revenue Share (%), by Application 2025 & 2033
- Figure 30: South Korea APCA Fuel Additive Industry Revenue (million), by Geography 2025 & 2033
- Figure 31: South Korea APCA Fuel Additive Industry Revenue Share (%), by Geography 2025 & 2033
- Figure 32: South Korea APCA Fuel Additive Industry Revenue (million), by Country 2025 & 2033
- Figure 33: South Korea APCA Fuel Additive Industry Revenue Share (%), by Country 2025 & 2033
- Figure 34: Rest of Asia Pacific APCA Fuel Additive Industry Revenue (million), by Product Type 2025 & 2033
- Figure 35: Rest of Asia Pacific APCA Fuel Additive Industry Revenue Share (%), by Product Type 2025 & 2033
- Figure 36: Rest of Asia Pacific APCA Fuel Additive Industry Revenue (million), by Application 2025 & 2033
- Figure 37: Rest of Asia Pacific APCA Fuel Additive Industry Revenue Share (%), by Application 2025 & 2033
- Figure 38: Rest of Asia Pacific APCA Fuel Additive Industry Revenue (million), by Geography 2025 & 2033
- Figure 39: Rest of Asia Pacific APCA Fuel Additive Industry Revenue Share (%), by Geography 2025 & 2033
- Figure 40: Rest of Asia Pacific APCA Fuel Additive Industry Revenue (million), by Country 2025 & 2033
- Figure 41: Rest of Asia Pacific APCA Fuel Additive Industry Revenue Share (%), by Country 2025 & 2033
List of Tables
- Table 1: Global APCA Fuel Additive Industry Revenue million Forecast, by Product Type 2020 & 2033
- Table 2: Global APCA Fuel Additive Industry Revenue million Forecast, by Application 2020 & 2033
- Table 3: Global APCA Fuel Additive Industry Revenue million Forecast, by Geography 2020 & 2033
- Table 4: Global APCA Fuel Additive Industry Revenue million Forecast, by Region 2020 & 2033
- Table 5: Global APCA Fuel Additive Industry Revenue million Forecast, by Product Type 2020 & 2033
- Table 6: Global APCA Fuel Additive Industry Revenue million Forecast, by Application 2020 & 2033
- Table 7: Global APCA Fuel Additive Industry Revenue million Forecast, by Geography 2020 & 2033
- Table 8: Global APCA Fuel Additive Industry Revenue million Forecast, by Country 2020 & 2033
- Table 9: Global APCA Fuel Additive Industry Revenue million Forecast, by Product Type 2020 & 2033
- Table 10: Global APCA Fuel Additive Industry Revenue million Forecast, by Application 2020 & 2033
- Table 11: Global APCA Fuel Additive Industry Revenue million Forecast, by Geography 2020 & 2033
- Table 12: Global APCA Fuel Additive Industry Revenue million Forecast, by Country 2020 & 2033
- Table 13: Global APCA Fuel Additive Industry Revenue million Forecast, by Product Type 2020 & 2033
- Table 14: Global APCA Fuel Additive Industry Revenue million Forecast, by Application 2020 & 2033
- Table 15: Global APCA Fuel Additive Industry Revenue million Forecast, by Geography 2020 & 2033
- Table 16: Global APCA Fuel Additive Industry Revenue million Forecast, by Country 2020 & 2033
- Table 17: Global APCA Fuel Additive Industry Revenue million Forecast, by Product Type 2020 & 2033
- Table 18: Global APCA Fuel Additive Industry Revenue million Forecast, by Application 2020 & 2033
- Table 19: Global APCA Fuel Additive Industry Revenue million Forecast, by Geography 2020 & 2033
- Table 20: Global APCA Fuel Additive Industry Revenue million Forecast, by Country 2020 & 2033
- Table 21: Global APCA Fuel Additive Industry Revenue million Forecast, by Product Type 2020 & 2033
- Table 22: Global APCA Fuel Additive Industry Revenue million Forecast, by Application 2020 & 2033
- Table 23: Global APCA Fuel Additive Industry Revenue million Forecast, by Geography 2020 & 2033
- Table 24: Global APCA Fuel Additive Industry Revenue million Forecast, by Country 2020 & 2033
Frequently Asked Questions
1. What is the projected Compound Annual Growth Rate (CAGR) of the APCA Fuel Additive Industry?
The projected CAGR is approximately 4.5%.
2. Which companies are prominent players in the APCA Fuel Additive Industry?
Key companies in the market include Innospec Inc, Baker Hughes a GE Company LLC, Clariant, Exxon Mobil Corporation, Royal Dutch Shell plc, Evonik Industries AG, LANXESS, Croda International Plc, BASF SE, Chevron Corporation, The Lubrizol Corporation, Dorfketal Chemicals (I) Pvt Ltd, Eni SpA, Total*List Not Exhaustive, Afton Chemical.
3. What are the main segments of the APCA Fuel Additive Industry?
The market segments include Product Type, Application, Geography.
4. Can you provide details about the market size?
The market size is estimated to be USD 768 million as of 2022.
5. What are some drivers contributing to market growth?
; Enactment of Stringent Environmental Regulations; Rising Passenger Traffic Contributing to the Growth of the Aviation Market.
6. What are the notable trends driving market growth?
Gasoline to Dominate the Market.
7. Are there any restraints impacting market growth?
; Increasing Demand and Penetration of Battery Electric Vehicles (BEVs); High Costs of R&D Activities.
8. Can you provide examples of recent developments in the market?
N/A
9. What pricing options are available for accessing the report?
Pricing options include single-user, multi-user, and enterprise licenses priced at USD 4750, USD 5250, and USD 8750 respectively.
10. Is the market size provided in terms of value or volume?
The market size is provided in terms of value, measured in million.
11. Are there any specific market keywords associated with the report?
Yes, the market keyword associated with the report is "APCA Fuel Additive Industry," which aids in identifying and referencing the specific market segment covered.
12. How do I determine which pricing option suits my needs best?
The pricing options vary based on user requirements and access needs. Individual users may opt for single-user licenses, while businesses requiring broader access may choose multi-user or enterprise licenses for cost-effective access to the report.
13. Are there any additional resources or data provided in the APCA Fuel Additive Industry report?
While the report offers comprehensive insights, it's advisable to review the specific contents or supplementary materials provided to ascertain if additional resources or data are available.
14. How can I stay updated on further developments or reports in the APCA Fuel Additive Industry?
To stay informed about further developments, trends, and reports in the APCA Fuel Additive Industry, consider subscribing to industry newsletters, following relevant companies and organizations, or regularly checking reputable industry news sources and publications.
Methodology
Step 1 - Identification of Relevant Samples Size from Population Database


Step 2 - Approaches for Defining Global Market Size (Value, Volume* & Price*)

Note*: In applicable scenarios
Step 3 - Data Sources
Primary Research
- Web Analytics
- Survey Reports
- Research Institute
- Latest Research Reports
- Opinion Leaders
Secondary Research
- Annual Reports
- White Paper
- Latest Press Release
- Industry Association
- Paid Database
- Investor Presentations

Step 4 - Data Triangulation
Involves using different sources of information in order to increase the validity of a study
These sources are likely to be stakeholders in a program - participants, other researchers, program staff, other community members, and so on.
Then we put all data in single framework & apply various statistical tools to find out the dynamic on the market.
During the analysis stage, feedback from the stakeholder groups would be compared to determine areas of agreement as well as areas of divergence

