

Key Insights
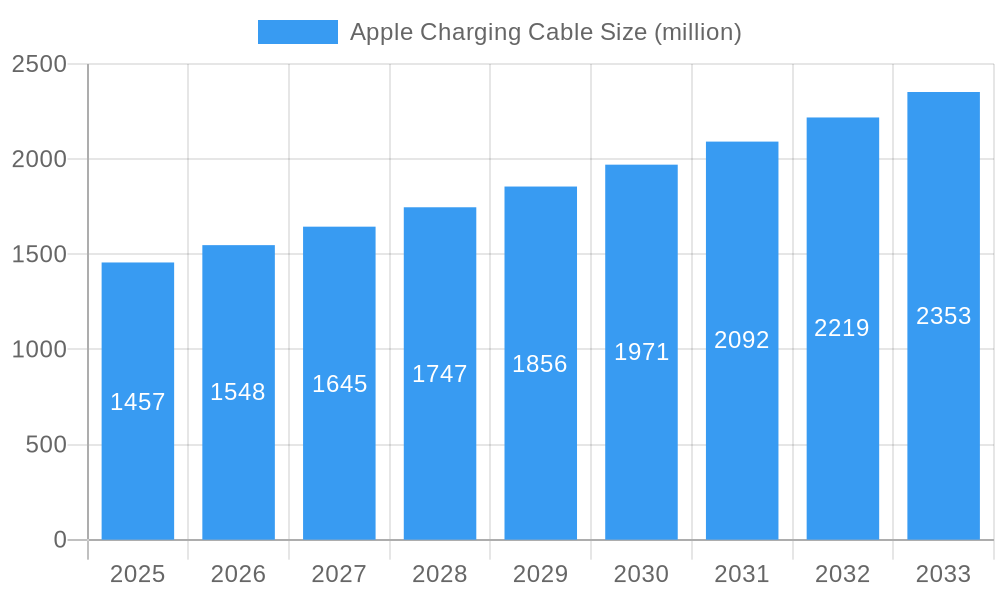
The global Apple Charging Cable market is poised for significant growth, projected to reach an estimated market size of $1,457 million by 2025. This expansion is driven by a robust Compound Annual Growth Rate (CAGR) of 6.2% anticipated over the forecast period of 2025-2033. The market's vitality is underpinned by the ever-increasing global penetration of Apple's ecosystem, including iPhones, iPads, and Macbooks, each requiring dedicated charging solutions. The continuous innovation in device charging technology, particularly the surge in demand for fast charging capabilities to minimize device downtime, and the burgeoning popularity of wireless charging solutions, are key growth catalysts. Consumers are increasingly prioritizing convenience and speed, making advanced charging accessories a necessity rather than a luxury. The presence of established brands like Anker, AmazonBasics, and Apple itself, alongside a host of emerging players like UGREEN and BASEUS, fosters a competitive landscape that spurs product development and affordability.
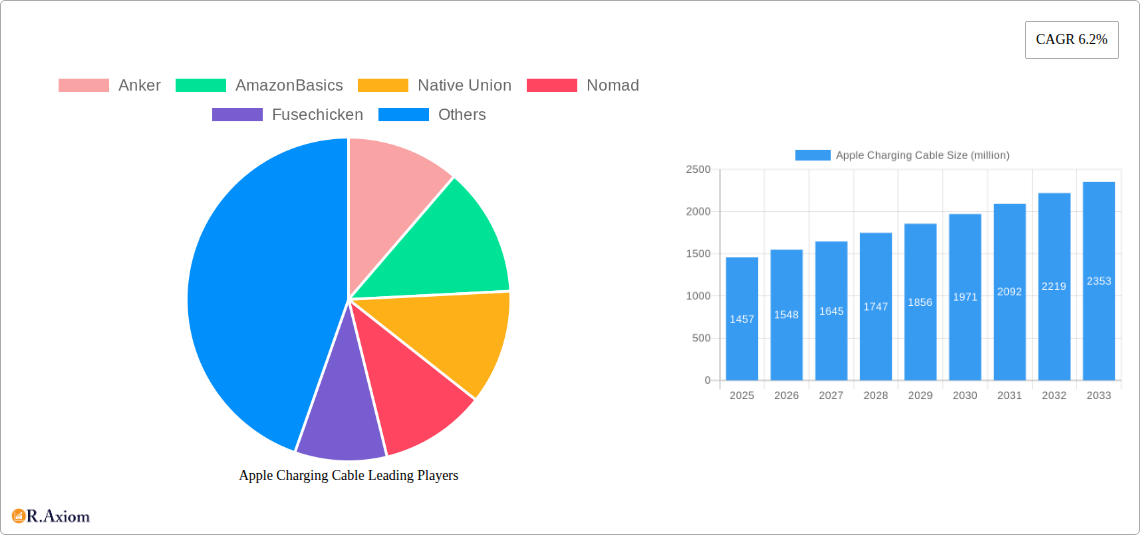
Apple Charging Cable Market Size (In Billion)
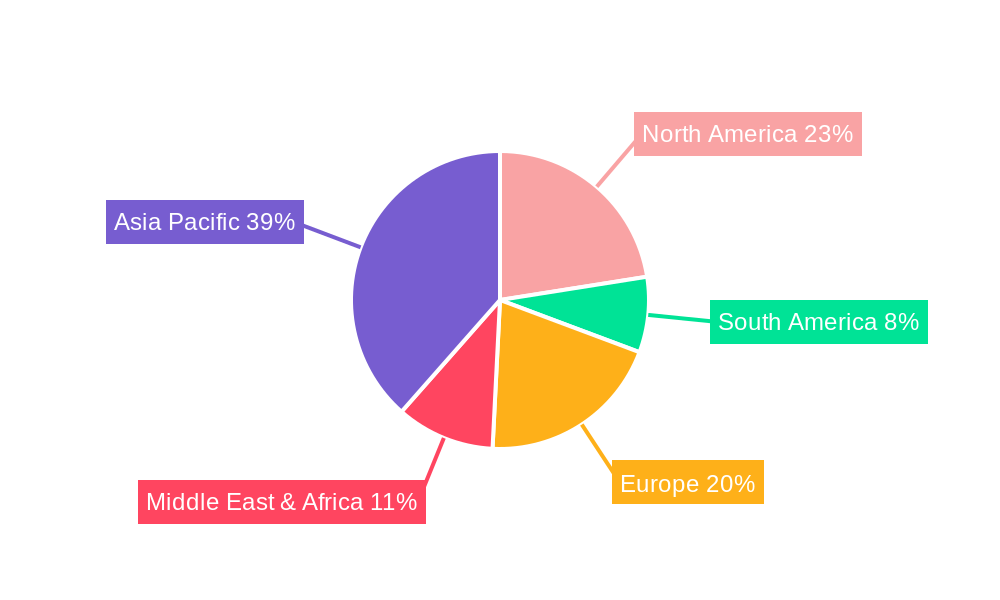
The market's trajectory is further shaped by evolving consumer behaviors and technological advancements. While the core demand for charging cables remains strong, the market is also witnessing a shift towards more durable and aesthetically pleasing cable designs, as well as smart charging solutions that optimize battery health. Geographically, Asia Pacific is expected to be a dominant region, driven by China and India's vast consumer bases and rapid adoption of consumer electronics. North America and Europe also represent mature yet consistently growing markets, fueled by high disposable incomes and a strong preference for premium Apple devices. While the market faces minor restraints such as intense price competition and the potential for longer device upgrade cycles, the persistent demand for reliable, high-performance charging accessories, coupled with the expanding Apple user base worldwide, solidifies its positive growth outlook. The integration of advanced materials and safety features in charging cables will also play a crucial role in differentiating products and capturing market share.
Apple Charging Cable Company Market Share
Apple Charging Cable Market Concentration & Innovation
The Apple charging cable market, while dominated by Apple itself, exhibits a significant degree of innovation and strategic maneuvering from third-party accessory manufacturers. Key players like Anker, AmazonBasics, Native Union, Nomad, Fusechicken, PISEN, UGREEN, ROMOSS, MI, PHILIPS, BASEUS, and Griffin are consistently pushing the boundaries of charging technology and product design. The market concentration remains high, with Apple holding a substantial market share, estimated to be in the range of 35-40 million units in the base year of 2025. However, the proliferation of M&A activities, with an estimated total deal value exceeding 500 million in the historical period of 2019-2024, indicates consolidation and strategic acquisitions aimed at capturing market share and technological IP. Innovation drivers are primarily fueled by the demand for faster charging speeds, increased durability, and enhanced user convenience. Regulatory frameworks, particularly those related to MFi certification and USB-C adoption, play a crucial role in shaping product development and market entry for third-party vendors. Product substitutes, such as universal charging solutions and power banks, continue to exert competitive pressure, necessitating continuous product improvement. End-user trends point towards a growing preference for braided cables, longer cable lengths, and multi-device charging capabilities, influencing the product development strategies of companies across the board.
Apple Charging Cable Industry Trends & Insights
The Apple charging cable industry is on a robust growth trajectory, driven by an ever-increasing installed base of Apple devices and the insatiable consumer demand for seamless and efficient power solutions. The market is projected to experience a Compound Annual Growth Rate (CAGR) of approximately 7-9% during the forecast period of 2025–2033, translating to a substantial market expansion from an estimated 120 million units in the base year to over 200 million units by 2033. Technological disruptions are at the forefront of this growth, with the widespread adoption of USB-C ports across Apple's product ecosystem, including iPhones and iPads, significantly influencing the types of cables in demand. The shift towards faster charging technologies, such as USB Power Delivery (USB PD), is a critical trend, enabling quicker device replenishment and enhancing user experience. Consumer preferences are evolving rapidly; there's a pronounced demand for cables that are not only functional but also aesthetically pleasing, durable, and eco-friendly. This is evident in the rising popularity of braided nylon cables and those made from sustainable materials. The competitive landscape is dynamic, characterized by intense price competition among third-party manufacturers and continuous product innovation to differentiate themselves. Market penetration for fast charging capabilities has reached an impressive estimated 75 million units in the base year, with wireless charging solutions also gaining traction, albeit at a slower pace, estimated at 25 million units. The increasing average selling price (ASP) of premium charging accessories, driven by advanced features and certifications, contributes to the overall market value, which is anticipated to cross the 4 billion mark by 2025. Apple's own product cycles, such as the launch of new iPhone and iPad models, directly stimulate demand for compatible charging cables, further solidifying the market's upward trend.
Dominant Markets & Segments in Apple Charging Cable
The Apple charging cable market's dominance is multifaceted, with specific regions and product segments driving significant growth. In terms of regions, North America and Europe continue to be the leading markets, owing to a high disposable income, a mature Apple device user base, and proactive adoption of new technologies. The United States, in particular, represents the largest single country market, with an estimated penetration rate of over 80 million Apple devices requiring dedicated charging solutions in the base year. Economic policies favoring consumer electronics and robust e-commerce infrastructure further bolster these regions' dominance.
Application Segments:
- iPhone: This segment consistently holds the largest market share, estimated at over 60 million units in the base year, due to the sheer volume of iPhone users worldwide. The continuous release of new iPhone models with evolving charging requirements ensures sustained demand for Lightning and increasingly USB-C cables. Key drivers include the ubiquity of iPhones and the replacement cycle of existing charging cables.
- iPad: The iPad segment represents a significant and growing market, with an estimated 25 million units in the base year. The versatility of iPads for both personal and professional use, coupled with longer replacement cycles compared to iPhones, contributes to consistent demand. The increasing integration of USB-C across the iPad lineup is a crucial factor driving growth in this segment.
- Macbook: While the adoption of USB-C has standardized Macbook charging, this segment still represents a substantial market, estimated at 15 million units annually. The demand for higher wattage USB-C cables that support fast charging for Macbooks, along with the need for durable and reliable accessories, fuels this segment. The trend towards thinner and lighter Macbooks also necessitates compact and efficient charging solutions.
- Others: This segment, encompassing Apple Watch, AirPods, and other accessories, accounts for an estimated 10 million units. The rapid growth of the wearables market, particularly AirPods and Apple Watch, is a key driver, creating a consistent demand for specialized charging solutions like wireless charging pads and USB-C to Lightning cables.
Types Segments:
- Fast Charging: This is the most dynamic and fastest-growing segment, estimated at over 75 million units in the base year. The integration of USB PD and other fast-charging protocols into Apple devices has made this a non-negotiable feature for consumers. Driven by the desire for quicker power-ups, this segment is expected to dominate the market.
- Wireless Charging: While still a smaller segment compared to wired fast charging, wireless charging is experiencing significant growth, estimated at 25 million units in the base year. The convenience and aesthetic appeal of wireless chargers, especially for the Apple Watch and AirPods, are key drivers. The ongoing development of more efficient and multi-device wireless charging solutions will further boost this segment's market penetration.
Apple Charging Cable Product Developments
Product developments in the Apple charging cable market are centered around enhancing durability, speed, and versatility. Innovations include the widespread adoption of braided nylon and Kevlar materials for increased cable lifespan, significantly reducing fraying and breakage, with an estimated 30% improvement in durability compared to standard cables. Fast charging technologies, particularly USB Power Delivery (USB PD) and GaN (Gallium Nitride) technology in power adapters, are enabling charging speeds that can deliver up to 50% battery life in under 30 minutes for compatible devices. MFi certification remains a crucial competitive advantage, ensuring optimal performance and safety for Apple devices. The market is also witnessing a rise in multi-cable solutions and docking stations that can charge multiple Apple devices simultaneously, catering to the needs of users with a diverse Apple ecosystem.
Report Scope & Segmentation Analysis
This report comprehensively analyzes the Apple charging cable market, segmenting it across key applications and types. The Application segments include iPhone, iPad, Macbook, and Others, each with distinct market dynamics and growth projections. The iPhone segment, representing the largest share, is expected to grow at a CAGR of approximately 6% due to the massive user base and replacement demand. The iPad segment, with its increasing adoption of USB-C, is projected to grow at a CAGR of 8%. The Macbook segment, driven by the need for high-wattage USB-C cables, is anticipated to see a CAGR of 5%. The Others segment, encompassing wearables and accessories, is poised for the highest growth, with an estimated CAGR of 10% due to the booming accessory market.
The Types segments include Fast Charging and Wireless Charging. The Fast Charging segment is the dominant force, expected to grow at a CAGR of 9%, driven by consumer demand for speed and efficiency. The Wireless Charging segment, while smaller, is projected to grow at a CAGR of 7%, fueled by convenience and evolving charging standards. Each segment's competitive landscape, market size, and growth drivers are meticulously detailed within the report.
Key Drivers of Apple Charging Cable Growth
The growth of the Apple charging cable market is propelled by several interconnected factors. Firstly, the sheer volume and continued expansion of Apple's device ecosystem, encompassing iPhones, iPads, Macbooks, and wearables like Apple Watches and AirPods, create a perpetual demand for charging solutions. An estimated 1.5 billion active Apple devices globally necessitate reliable and efficient charging. Secondly, the relentless pursuit of faster charging technology, with advancements in USB Power Delivery (USB PD) and GaN technology, is a significant growth catalyst. Consumers are increasingly prioritizing speed, with charging times being a critical factor in purchasing decisions. Thirdly, the growing trend of device dependency and the increasing average screen time across all Apple devices contribute to higher charging frequency, thus driving cable sales. The regulatory push towards USB-C standardization across devices, driven by government mandates in various regions, is also a crucial growth factor, influencing product design and market accessibility. Furthermore, the increasing consumer awareness regarding the benefits of MFi-certified cables, ensuring compatibility and safety, boosts sales of premium and certified accessories.
Challenges in the Apple Charging Cable Sector
Despite robust growth, the Apple charging cable sector faces several challenges that could temper its expansion. Intense price competition among third-party manufacturers, particularly in the low-end market, can erode profit margins and hinder investment in premium features. The market is saturated with numerous brands, leading to brand dilution and consumer confusion regarding product quality and reliability. Furthermore, the ongoing development of wireless charging technologies, while an opportunity, also presents a challenge to the traditional wired charging cable market as consumers increasingly opt for the convenience of no-plug solutions. Regulatory hurdles, while sometimes driving standardization, can also create barriers to entry for new players, especially concerning MFi certification processes and associated costs, estimated to impact new entrants by 10-15% in initial setup. Supply chain disruptions, as witnessed in recent global events, can lead to material shortages and increased production costs, impacting availability and pricing. Finally, the perception that Apple's proprietary cables are superior, even if not always true, can pose a psychological barrier for some consumers considering third-party alternatives.
Emerging Opportunities in Apple Charging Cable
The Apple charging cable market presents several promising emerging opportunities for innovation and market expansion. The increasing demand for eco-friendly and sustainable charging solutions, utilizing recycled materials and minimizing electronic waste, represents a significant niche with growing consumer appeal. The development of ultra-durable and damage-resistant cables, capable of withstanding extreme conditions or extensive daily use, taps into a segment seeking long-term value and reliability. The expansion of multi-device charging solutions, such as integrated charging stations for iPhones, Apple Watches, and AirPods, caters to the convenience-seeking consumer and offers higher average transaction values. Furthermore, the growing market for smart charging cables, incorporating features like charging monitoring, data transfer optimization, or even integrated security features, opens up new avenues for technological advancement and premium product offerings. The gradual adoption of universal charging standards beyond USB-C, driven by global regulatory efforts, could also present future opportunities for interoperable charging solutions.
Leading Players in the Apple Charging Cable Market
- Apple
- Anker
- AmazonBasics
- Native Union
- Nomad
- Fusechicken
- PISEN
- UGREEN
- ROMOSS
- MI
- PHILIPS
- BASEUS
- Griffin
Key Developments in Apple Charging Cable Industry
- 2023 Q4: Apple introduces new iPhone models with USB-C ports, accelerating the transition away from Lightning for a significant portion of its user base.
- 2024 Q1: Significant advancements in GaN charger technology lead to smaller, more powerful, and more efficient power adapters capable of delivering higher wattages for Macbooks and iPhones.
- 2024 Q2: Increased adoption of braided nylon and Kevlar materials in third-party charging cables results in a significant improvement in cable durability and a reduction in warranty claims.
- 2024 Q3: Rise in the popularity of magnetic wireless charging solutions, particularly for AirPods and Apple Watches, driven by user convenience and seamless integration.
- 2024 Q4: Growing consumer demand for "made with recycled materials" charging accessories, prompting manufacturers to invest in sustainable production processes.
- 2025 Q1: Potential regulatory shifts in major markets mandating standardized charging ports, further solidifying the move towards USB-C across all consumer electronics.
- 2025 Q2: Introduction of high-speed charging cables supporting up to 240W USB PD, catering to the power needs of high-performance Macbooks and future Apple devices.
Strategic Outlook for Apple Charging Cable Market
The strategic outlook for the Apple charging cable market remains exceptionally strong, driven by sustained innovation and evolving consumer demands. The ongoing transition to USB-C across Apple's product lines will continue to be a significant growth catalyst, ensuring sustained demand for compatible charging solutions. The increasing emphasis on faster charging, enhanced durability, and premium materials will drive market segmentation, with opportunities for manufacturers offering superior performance and longevity. The burgeoning market for Apple accessories, particularly wearables, presents a substantial growth area for specialized charging solutions, including advanced wireless charging technologies. Strategic partnerships and M&A activities are likely to continue as companies aim to consolidate market share and acquire technological expertise. Ultimately, the market's future hinges on its ability to adapt to evolving technological standards, meet consumer expectations for convenience and reliability, and embrace sustainable manufacturing practices.
Apple Charging Cable Segmentation
-
1. Application
- 1.1. Iphone
- 1.2. Ipad
- 1.3. Macbook
- 1.4. Others
-
2. Types
- 2.1. Fast Charging
- 2.2. Wireless
Apple Charging Cable Segmentation By Geography
-
1. North America
- 1.1. United States
- 1.2. Canada
- 1.3. Mexico
-
2. South America
- 2.1. Brazil
- 2.2. Argentina
- 2.3. Rest of South America
-
3. Europe
- 3.1. United Kingdom
- 3.2. Germany
- 3.3. France
- 3.4. Italy
- 3.5. Spain
- 3.6. Russia
- 3.7. Benelux
- 3.8. Nordics
- 3.9. Rest of Europe
-
4. Middle East & Africa
- 4.1. Turkey
- 4.2. Israel
- 4.3. GCC
- 4.4. North Africa
- 4.5. South Africa
- 4.6. Rest of Middle East & Africa
-
5. Asia Pacific
- 5.1. China
- 5.2. India
- 5.3. Japan
- 5.4. South Korea
- 5.5. ASEAN
- 5.6. Oceania
- 5.7. Rest of Asia Pacific
Apple Charging Cable Regional Market Share
Geographic Coverage of Apple Charging Cable
Apple Charging Cable REPORT HIGHLIGHTS
| Aspects | Details |
|---|---|
| Study Period | 2020-2034 |
| Base Year | 2025 |
| Estimated Year | 2026 |
| Forecast Period | 2026-2034 |
| Historical Period | 2020-2025 |
| Growth Rate | CAGR of 6.2% from 2020-2034 |
| Segmentation |
|
Table of Contents
- 1. Introduction
- 1.1. Research Scope
- 1.2. Market Segmentation
- 1.3. Research Methodology
- 1.4. Definitions and Assumptions
- 2. Executive Summary
- 2.1. Introduction
- 3. Market Dynamics
- 3.1. Introduction
- 3.2. Market Drivers
- 3.3. Market Restrains
- 3.4. Market Trends
- 4. Market Factor Analysis
- 4.1. Porters Five Forces
- 4.2. Supply/Value Chain
- 4.3. PESTEL analysis
- 4.4. Market Entropy
- 4.5. Patent/Trademark Analysis
- 5. Global Apple Charging Cable Analysis, Insights and Forecast, 2020-2032
- 5.1. Market Analysis, Insights and Forecast - by Application
- 5.1.1. Iphone
- 5.1.2. Ipad
- 5.1.3. Macbook
- 5.1.4. Others
- 5.2. Market Analysis, Insights and Forecast - by Types
- 5.2.1. Fast Charging
- 5.2.2. Wireless
- 5.3. Market Analysis, Insights and Forecast - by Region
- 5.3.1. North America
- 5.3.2. South America
- 5.3.3. Europe
- 5.3.4. Middle East & Africa
- 5.3.5. Asia Pacific
- 5.1. Market Analysis, Insights and Forecast - by Application
- 6. North America Apple Charging Cable Analysis, Insights and Forecast, 2020-2032
- 6.1. Market Analysis, Insights and Forecast - by Application
- 6.1.1. Iphone
- 6.1.2. Ipad
- 6.1.3. Macbook
- 6.1.4. Others
- 6.2. Market Analysis, Insights and Forecast - by Types
- 6.2.1. Fast Charging
- 6.2.2. Wireless
- 6.1. Market Analysis, Insights and Forecast - by Application
- 7. South America Apple Charging Cable Analysis, Insights and Forecast, 2020-2032
- 7.1. Market Analysis, Insights and Forecast - by Application
- 7.1.1. Iphone
- 7.1.2. Ipad
- 7.1.3. Macbook
- 7.1.4. Others
- 7.2. Market Analysis, Insights and Forecast - by Types
- 7.2.1. Fast Charging
- 7.2.2. Wireless
- 7.1. Market Analysis, Insights and Forecast - by Application
- 8. Europe Apple Charging Cable Analysis, Insights and Forecast, 2020-2032
- 8.1. Market Analysis, Insights and Forecast - by Application
- 8.1.1. Iphone
- 8.1.2. Ipad
- 8.1.3. Macbook
- 8.1.4. Others
- 8.2. Market Analysis, Insights and Forecast - by Types
- 8.2.1. Fast Charging
- 8.2.2. Wireless
- 8.1. Market Analysis, Insights and Forecast - by Application
- 9. Middle East & Africa Apple Charging Cable Analysis, Insights and Forecast, 2020-2032
- 9.1. Market Analysis, Insights and Forecast - by Application
- 9.1.1. Iphone
- 9.1.2. Ipad
- 9.1.3. Macbook
- 9.1.4. Others
- 9.2. Market Analysis, Insights and Forecast - by Types
- 9.2.1. Fast Charging
- 9.2.2. Wireless
- 9.1. Market Analysis, Insights and Forecast - by Application
- 10. Asia Pacific Apple Charging Cable Analysis, Insights and Forecast, 2020-2032
- 10.1. Market Analysis, Insights and Forecast - by Application
- 10.1.1. Iphone
- 10.1.2. Ipad
- 10.1.3. Macbook
- 10.1.4. Others
- 10.2. Market Analysis, Insights and Forecast - by Types
- 10.2.1. Fast Charging
- 10.2.2. Wireless
- 10.1. Market Analysis, Insights and Forecast - by Application
- 11. Competitive Analysis
- 11.1. Global Market Share Analysis 2025
- 11.2. Company Profiles
- 11.2.1 Anker
- 11.2.1.1. Overview
- 11.2.1.2. Products
- 11.2.1.3. SWOT Analysis
- 11.2.1.4. Recent Developments
- 11.2.1.5. Financials (Based on Availability)
- 11.2.2 AmazonBasics
- 11.2.2.1. Overview
- 11.2.2.2. Products
- 11.2.2.3. SWOT Analysis
- 11.2.2.4. Recent Developments
- 11.2.2.5. Financials (Based on Availability)
- 11.2.3 Native Union
- 11.2.3.1. Overview
- 11.2.3.2. Products
- 11.2.3.3. SWOT Analysis
- 11.2.3.4. Recent Developments
- 11.2.3.5. Financials (Based on Availability)
- 11.2.4 Nomad
- 11.2.4.1. Overview
- 11.2.4.2. Products
- 11.2.4.3. SWOT Analysis
- 11.2.4.4. Recent Developments
- 11.2.4.5. Financials (Based on Availability)
- 11.2.5 Fusechicken
- 11.2.5.1. Overview
- 11.2.5.2. Products
- 11.2.5.3. SWOT Analysis
- 11.2.5.4. Recent Developments
- 11.2.5.5. Financials (Based on Availability)
- 11.2.6 PISEN
- 11.2.6.1. Overview
- 11.2.6.2. Products
- 11.2.6.3. SWOT Analysis
- 11.2.6.4. Recent Developments
- 11.2.6.5. Financials (Based on Availability)
- 11.2.7 UGREEN
- 11.2.7.1. Overview
- 11.2.7.2. Products
- 11.2.7.3. SWOT Analysis
- 11.2.7.4. Recent Developments
- 11.2.7.5. Financials (Based on Availability)
- 11.2.8 ROMOSS
- 11.2.8.1. Overview
- 11.2.8.2. Products
- 11.2.8.3. SWOT Analysis
- 11.2.8.4. Recent Developments
- 11.2.8.5. Financials (Based on Availability)
- 11.2.9 MI
- 11.2.9.1. Overview
- 11.2.9.2. Products
- 11.2.9.3. SWOT Analysis
- 11.2.9.4. Recent Developments
- 11.2.9.5. Financials (Based on Availability)
- 11.2.10 PHILIPS
- 11.2.10.1. Overview
- 11.2.10.2. Products
- 11.2.10.3. SWOT Analysis
- 11.2.10.4. Recent Developments
- 11.2.10.5. Financials (Based on Availability)
- 11.2.11 APPLE
- 11.2.11.1. Overview
- 11.2.11.2. Products
- 11.2.11.3. SWOT Analysis
- 11.2.11.4. Recent Developments
- 11.2.11.5. Financials (Based on Availability)
- 11.2.12 BASEUS
- 11.2.12.1. Overview
- 11.2.12.2. Products
- 11.2.12.3. SWOT Analysis
- 11.2.12.4. Recent Developments
- 11.2.12.5. Financials (Based on Availability)
- 11.2.13 Griffin
- 11.2.13.1. Overview
- 11.2.13.2. Products
- 11.2.13.3. SWOT Analysis
- 11.2.13.4. Recent Developments
- 11.2.13.5. Financials (Based on Availability)
- 11.2.1 Anker
List of Figures
- Figure 1: Global Apple Charging Cable Revenue Breakdown (million, %) by Region 2025 & 2033
- Figure 2: Global Apple Charging Cable Volume Breakdown (K, %) by Region 2025 & 2033
- Figure 3: North America Apple Charging Cable Revenue (million), by Application 2025 & 2033
- Figure 4: North America Apple Charging Cable Volume (K), by Application 2025 & 2033
- Figure 5: North America Apple Charging Cable Revenue Share (%), by Application 2025 & 2033
- Figure 6: North America Apple Charging Cable Volume Share (%), by Application 2025 & 2033
- Figure 7: North America Apple Charging Cable Revenue (million), by Types 2025 & 2033
- Figure 8: North America Apple Charging Cable Volume (K), by Types 2025 & 2033
- Figure 9: North America Apple Charging Cable Revenue Share (%), by Types 2025 & 2033
- Figure 10: North America Apple Charging Cable Volume Share (%), by Types 2025 & 2033
- Figure 11: North America Apple Charging Cable Revenue (million), by Country 2025 & 2033
- Figure 12: North America Apple Charging Cable Volume (K), by Country 2025 & 2033
- Figure 13: North America Apple Charging Cable Revenue Share (%), by Country 2025 & 2033
- Figure 14: North America Apple Charging Cable Volume Share (%), by Country 2025 & 2033
- Figure 15: South America Apple Charging Cable Revenue (million), by Application 2025 & 2033
- Figure 16: South America Apple Charging Cable Volume (K), by Application 2025 & 2033
- Figure 17: South America Apple Charging Cable Revenue Share (%), by Application 2025 & 2033
- Figure 18: South America Apple Charging Cable Volume Share (%), by Application 2025 & 2033
- Figure 19: South America Apple Charging Cable Revenue (million), by Types 2025 & 2033
- Figure 20: South America Apple Charging Cable Volume (K), by Types 2025 & 2033
- Figure 21: South America Apple Charging Cable Revenue Share (%), by Types 2025 & 2033
- Figure 22: South America Apple Charging Cable Volume Share (%), by Types 2025 & 2033
- Figure 23: South America Apple Charging Cable Revenue (million), by Country 2025 & 2033
- Figure 24: South America Apple Charging Cable Volume (K), by Country 2025 & 2033
- Figure 25: South America Apple Charging Cable Revenue Share (%), by Country 2025 & 2033
- Figure 26: South America Apple Charging Cable Volume Share (%), by Country 2025 & 2033
- Figure 27: Europe Apple Charging Cable Revenue (million), by Application 2025 & 2033
- Figure 28: Europe Apple Charging Cable Volume (K), by Application 2025 & 2033
- Figure 29: Europe Apple Charging Cable Revenue Share (%), by Application 2025 & 2033
- Figure 30: Europe Apple Charging Cable Volume Share (%), by Application 2025 & 2033
- Figure 31: Europe Apple Charging Cable Revenue (million), by Types 2025 & 2033
- Figure 32: Europe Apple Charging Cable Volume (K), by Types 2025 & 2033
- Figure 33: Europe Apple Charging Cable Revenue Share (%), by Types 2025 & 2033
- Figure 34: Europe Apple Charging Cable Volume Share (%), by Types 2025 & 2033
- Figure 35: Europe Apple Charging Cable Revenue (million), by Country 2025 & 2033
- Figure 36: Europe Apple Charging Cable Volume (K), by Country 2025 & 2033
- Figure 37: Europe Apple Charging Cable Revenue Share (%), by Country 2025 & 2033
- Figure 38: Europe Apple Charging Cable Volume Share (%), by Country 2025 & 2033
- Figure 39: Middle East & Africa Apple Charging Cable Revenue (million), by Application 2025 & 2033
- Figure 40: Middle East & Africa Apple Charging Cable Volume (K), by Application 2025 & 2033
- Figure 41: Middle East & Africa Apple Charging Cable Revenue Share (%), by Application 2025 & 2033
- Figure 42: Middle East & Africa Apple Charging Cable Volume Share (%), by Application 2025 & 2033
- Figure 43: Middle East & Africa Apple Charging Cable Revenue (million), by Types 2025 & 2033
- Figure 44: Middle East & Africa Apple Charging Cable Volume (K), by Types 2025 & 2033
- Figure 45: Middle East & Africa Apple Charging Cable Revenue Share (%), by Types 2025 & 2033
- Figure 46: Middle East & Africa Apple Charging Cable Volume Share (%), by Types 2025 & 2033
- Figure 47: Middle East & Africa Apple Charging Cable Revenue (million), by Country 2025 & 2033
- Figure 48: Middle East & Africa Apple Charging Cable Volume (K), by Country 2025 & 2033
- Figure 49: Middle East & Africa Apple Charging Cable Revenue Share (%), by Country 2025 & 2033
- Figure 50: Middle East & Africa Apple Charging Cable Volume Share (%), by Country 2025 & 2033
- Figure 51: Asia Pacific Apple Charging Cable Revenue (million), by Application 2025 & 2033
- Figure 52: Asia Pacific Apple Charging Cable Volume (K), by Application 2025 & 2033
- Figure 53: Asia Pacific Apple Charging Cable Revenue Share (%), by Application 2025 & 2033
- Figure 54: Asia Pacific Apple Charging Cable Volume Share (%), by Application 2025 & 2033
- Figure 55: Asia Pacific Apple Charging Cable Revenue (million), by Types 2025 & 2033
- Figure 56: Asia Pacific Apple Charging Cable Volume (K), by Types 2025 & 2033
- Figure 57: Asia Pacific Apple Charging Cable Revenue Share (%), by Types 2025 & 2033
- Figure 58: Asia Pacific Apple Charging Cable Volume Share (%), by Types 2025 & 2033
- Figure 59: Asia Pacific Apple Charging Cable Revenue (million), by Country 2025 & 2033
- Figure 60: Asia Pacific Apple Charging Cable Volume (K), by Country 2025 & 2033
- Figure 61: Asia Pacific Apple Charging Cable Revenue Share (%), by Country 2025 & 2033
- Figure 62: Asia Pacific Apple Charging Cable Volume Share (%), by Country 2025 & 2033
List of Tables
- Table 1: Global Apple Charging Cable Revenue million Forecast, by Application 2020 & 2033
- Table 2: Global Apple Charging Cable Volume K Forecast, by Application 2020 & 2033
- Table 3: Global Apple Charging Cable Revenue million Forecast, by Types 2020 & 2033
- Table 4: Global Apple Charging Cable Volume K Forecast, by Types 2020 & 2033
- Table 5: Global Apple Charging Cable Revenue million Forecast, by Region 2020 & 2033
- Table 6: Global Apple Charging Cable Volume K Forecast, by Region 2020 & 2033
- Table 7: Global Apple Charging Cable Revenue million Forecast, by Application 2020 & 2033
- Table 8: Global Apple Charging Cable Volume K Forecast, by Application 2020 & 2033
- Table 9: Global Apple Charging Cable Revenue million Forecast, by Types 2020 & 2033
- Table 10: Global Apple Charging Cable Volume K Forecast, by Types 2020 & 2033
- Table 11: Global Apple Charging Cable Revenue million Forecast, by Country 2020 & 2033
- Table 12: Global Apple Charging Cable Volume K Forecast, by Country 2020 & 2033
- Table 13: United States Apple Charging Cable Revenue (million) Forecast, by Application 2020 & 2033
- Table 14: United States Apple Charging Cable Volume (K) Forecast, by Application 2020 & 2033
- Table 15: Canada Apple Charging Cable Revenue (million) Forecast, by Application 2020 & 2033
- Table 16: Canada Apple Charging Cable Volume (K) Forecast, by Application 2020 & 2033
- Table 17: Mexico Apple Charging Cable Revenue (million) Forecast, by Application 2020 & 2033
- Table 18: Mexico Apple Charging Cable Volume (K) Forecast, by Application 2020 & 2033
- Table 19: Global Apple Charging Cable Revenue million Forecast, by Application 2020 & 2033
- Table 20: Global Apple Charging Cable Volume K Forecast, by Application 2020 & 2033
- Table 21: Global Apple Charging Cable Revenue million Forecast, by Types 2020 & 2033
- Table 22: Global Apple Charging Cable Volume K Forecast, by Types 2020 & 2033
- Table 23: Global Apple Charging Cable Revenue million Forecast, by Country 2020 & 2033
- Table 24: Global Apple Charging Cable Volume K Forecast, by Country 2020 & 2033
- Table 25: Brazil Apple Charging Cable Revenue (million) Forecast, by Application 2020 & 2033
- Table 26: Brazil Apple Charging Cable Volume (K) Forecast, by Application 2020 & 2033
- Table 27: Argentina Apple Charging Cable Revenue (million) Forecast, by Application 2020 & 2033
- Table 28: Argentina Apple Charging Cable Volume (K) Forecast, by Application 2020 & 2033
- Table 29: Rest of South America Apple Charging Cable Revenue (million) Forecast, by Application 2020 & 2033
- Table 30: Rest of South America Apple Charging Cable Volume (K) Forecast, by Application 2020 & 2033
- Table 31: Global Apple Charging Cable Revenue million Forecast, by Application 2020 & 2033
- Table 32: Global Apple Charging Cable Volume K Forecast, by Application 2020 & 2033
- Table 33: Global Apple Charging Cable Revenue million Forecast, by Types 2020 & 2033
- Table 34: Global Apple Charging Cable Volume K Forecast, by Types 2020 & 2033
- Table 35: Global Apple Charging Cable Revenue million Forecast, by Country 2020 & 2033
- Table 36: Global Apple Charging Cable Volume K Forecast, by Country 2020 & 2033
- Table 37: United Kingdom Apple Charging Cable Revenue (million) Forecast, by Application 2020 & 2033
- Table 38: United Kingdom Apple Charging Cable Volume (K) Forecast, by Application 2020 & 2033
- Table 39: Germany Apple Charging Cable Revenue (million) Forecast, by Application 2020 & 2033
- Table 40: Germany Apple Charging Cable Volume (K) Forecast, by Application 2020 & 2033
- Table 41: France Apple Charging Cable Revenue (million) Forecast, by Application 2020 & 2033
- Table 42: France Apple Charging Cable Volume (K) Forecast, by Application 2020 & 2033
- Table 43: Italy Apple Charging Cable Revenue (million) Forecast, by Application 2020 & 2033
- Table 44: Italy Apple Charging Cable Volume (K) Forecast, by Application 2020 & 2033
- Table 45: Spain Apple Charging Cable Revenue (million) Forecast, by Application 2020 & 2033
- Table 46: Spain Apple Charging Cable Volume (K) Forecast, by Application 2020 & 2033
- Table 47: Russia Apple Charging Cable Revenue (million) Forecast, by Application 2020 & 2033
- Table 48: Russia Apple Charging Cable Volume (K) Forecast, by Application 2020 & 2033
- Table 49: Benelux Apple Charging Cable Revenue (million) Forecast, by Application 2020 & 2033
- Table 50: Benelux Apple Charging Cable Volume (K) Forecast, by Application 2020 & 2033
- Table 51: Nordics Apple Charging Cable Revenue (million) Forecast, by Application 2020 & 2033
- Table 52: Nordics Apple Charging Cable Volume (K) Forecast, by Application 2020 & 2033
- Table 53: Rest of Europe Apple Charging Cable Revenue (million) Forecast, by Application 2020 & 2033
- Table 54: Rest of Europe Apple Charging Cable Volume (K) Forecast, by Application 2020 & 2033
- Table 55: Global Apple Charging Cable Revenue million Forecast, by Application 2020 & 2033
- Table 56: Global Apple Charging Cable Volume K Forecast, by Application 2020 & 2033
- Table 57: Global Apple Charging Cable Revenue million Forecast, by Types 2020 & 2033
- Table 58: Global Apple Charging Cable Volume K Forecast, by Types 2020 & 2033
- Table 59: Global Apple Charging Cable Revenue million Forecast, by Country 2020 & 2033
- Table 60: Global Apple Charging Cable Volume K Forecast, by Country 2020 & 2033
- Table 61: Turkey Apple Charging Cable Revenue (million) Forecast, by Application 2020 & 2033
- Table 62: Turkey Apple Charging Cable Volume (K) Forecast, by Application 2020 & 2033
- Table 63: Israel Apple Charging Cable Revenue (million) Forecast, by Application 2020 & 2033
- Table 64: Israel Apple Charging Cable Volume (K) Forecast, by Application 2020 & 2033
- Table 65: GCC Apple Charging Cable Revenue (million) Forecast, by Application 2020 & 2033
- Table 66: GCC Apple Charging Cable Volume (K) Forecast, by Application 2020 & 2033
- Table 67: North Africa Apple Charging Cable Revenue (million) Forecast, by Application 2020 & 2033
- Table 68: North Africa Apple Charging Cable Volume (K) Forecast, by Application 2020 & 2033
- Table 69: South Africa Apple Charging Cable Revenue (million) Forecast, by Application 2020 & 2033
- Table 70: South Africa Apple Charging Cable Volume (K) Forecast, by Application 2020 & 2033
- Table 71: Rest of Middle East & Africa Apple Charging Cable Revenue (million) Forecast, by Application 2020 & 2033
- Table 72: Rest of Middle East & Africa Apple Charging Cable Volume (K) Forecast, by Application 2020 & 2033
- Table 73: Global Apple Charging Cable Revenue million Forecast, by Application 2020 & 2033
- Table 74: Global Apple Charging Cable Volume K Forecast, by Application 2020 & 2033
- Table 75: Global Apple Charging Cable Revenue million Forecast, by Types 2020 & 2033
- Table 76: Global Apple Charging Cable Volume K Forecast, by Types 2020 & 2033
- Table 77: Global Apple Charging Cable Revenue million Forecast, by Country 2020 & 2033
- Table 78: Global Apple Charging Cable Volume K Forecast, by Country 2020 & 2033
- Table 79: China Apple Charging Cable Revenue (million) Forecast, by Application 2020 & 2033
- Table 80: China Apple Charging Cable Volume (K) Forecast, by Application 2020 & 2033
- Table 81: India Apple Charging Cable Revenue (million) Forecast, by Application 2020 & 2033
- Table 82: India Apple Charging Cable Volume (K) Forecast, by Application 2020 & 2033
- Table 83: Japan Apple Charging Cable Revenue (million) Forecast, by Application 2020 & 2033
- Table 84: Japan Apple Charging Cable Volume (K) Forecast, by Application 2020 & 2033
- Table 85: South Korea Apple Charging Cable Revenue (million) Forecast, by Application 2020 & 2033
- Table 86: South Korea Apple Charging Cable Volume (K) Forecast, by Application 2020 & 2033
- Table 87: ASEAN Apple Charging Cable Revenue (million) Forecast, by Application 2020 & 2033
- Table 88: ASEAN Apple Charging Cable Volume (K) Forecast, by Application 2020 & 2033
- Table 89: Oceania Apple Charging Cable Revenue (million) Forecast, by Application 2020 & 2033
- Table 90: Oceania Apple Charging Cable Volume (K) Forecast, by Application 2020 & 2033
- Table 91: Rest of Asia Pacific Apple Charging Cable Revenue (million) Forecast, by Application 2020 & 2033
- Table 92: Rest of Asia Pacific Apple Charging Cable Volume (K) Forecast, by Application 2020 & 2033
Frequently Asked Questions
1. What is the projected Compound Annual Growth Rate (CAGR) of the Apple Charging Cable?
The projected CAGR is approximately 6.2%.
2. Which companies are prominent players in the Apple Charging Cable?
Key companies in the market include Anker, AmazonBasics, Native Union, Nomad, Fusechicken, PISEN, UGREEN, ROMOSS, MI, PHILIPS, APPLE, BASEUS, Griffin.
3. What are the main segments of the Apple Charging Cable?
The market segments include Application, Types.
4. Can you provide details about the market size?
The market size is estimated to be USD 1457 million as of 2022.
5. What are some drivers contributing to market growth?
N/A
6. What are the notable trends driving market growth?
N/A
7. Are there any restraints impacting market growth?
N/A
8. Can you provide examples of recent developments in the market?
N/A
9. What pricing options are available for accessing the report?
Pricing options include single-user, multi-user, and enterprise licenses priced at USD 3350.00, USD 5025.00, and USD 6700.00 respectively.
10. Is the market size provided in terms of value or volume?
The market size is provided in terms of value, measured in million and volume, measured in K.
11. Are there any specific market keywords associated with the report?
Yes, the market keyword associated with the report is "Apple Charging Cable," which aids in identifying and referencing the specific market segment covered.
12. How do I determine which pricing option suits my needs best?
The pricing options vary based on user requirements and access needs. Individual users may opt for single-user licenses, while businesses requiring broader access may choose multi-user or enterprise licenses for cost-effective access to the report.
13. Are there any additional resources or data provided in the Apple Charging Cable report?
While the report offers comprehensive insights, it's advisable to review the specific contents or supplementary materials provided to ascertain if additional resources or data are available.
14. How can I stay updated on further developments or reports in the Apple Charging Cable?
To stay informed about further developments, trends, and reports in the Apple Charging Cable, consider subscribing to industry newsletters, following relevant companies and organizations, or regularly checking reputable industry news sources and publications.
Methodology
Step 1 - Identification of Relevant Samples Size from Population Database


Step 2 - Approaches for Defining Global Market Size (Value, Volume* & Price*)

Note*: In applicable scenarios
Step 3 - Data Sources
Primary Research
- Web Analytics
- Survey Reports
- Research Institute
- Latest Research Reports
- Opinion Leaders
Secondary Research
- Annual Reports
- White Paper
- Latest Press Release
- Industry Association
- Paid Database
- Investor Presentations

Step 4 - Data Triangulation
Involves using different sources of information in order to increase the validity of a study
These sources are likely to be stakeholders in a program - participants, other researchers, program staff, other community members, and so on.
Then we put all data in single framework & apply various statistical tools to find out the dynamic on the market.
During the analysis stage, feedback from the stakeholder groups would be compared to determine areas of agreement as well as areas of divergence