
Key Insights
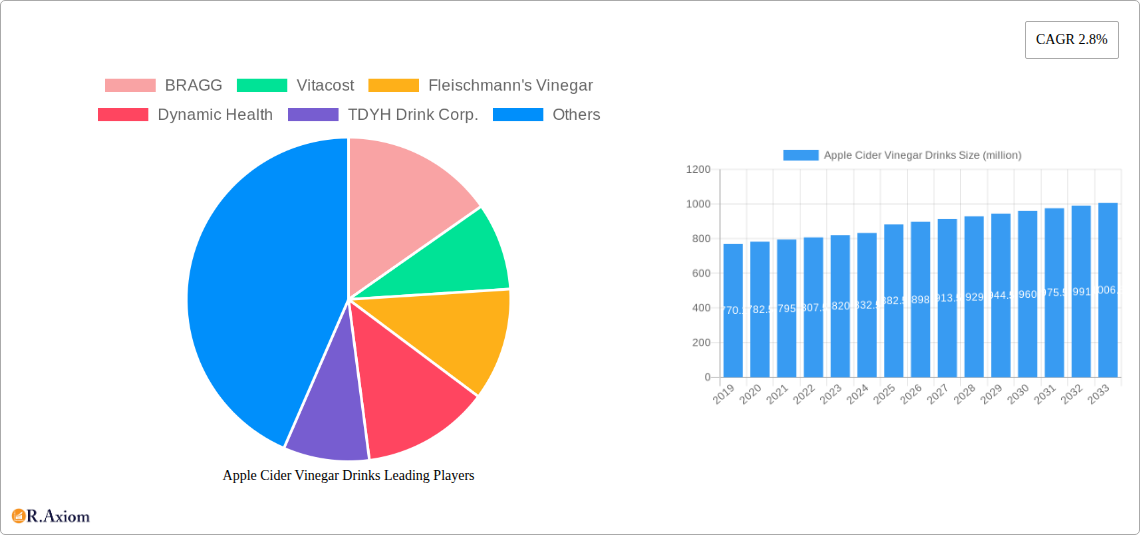
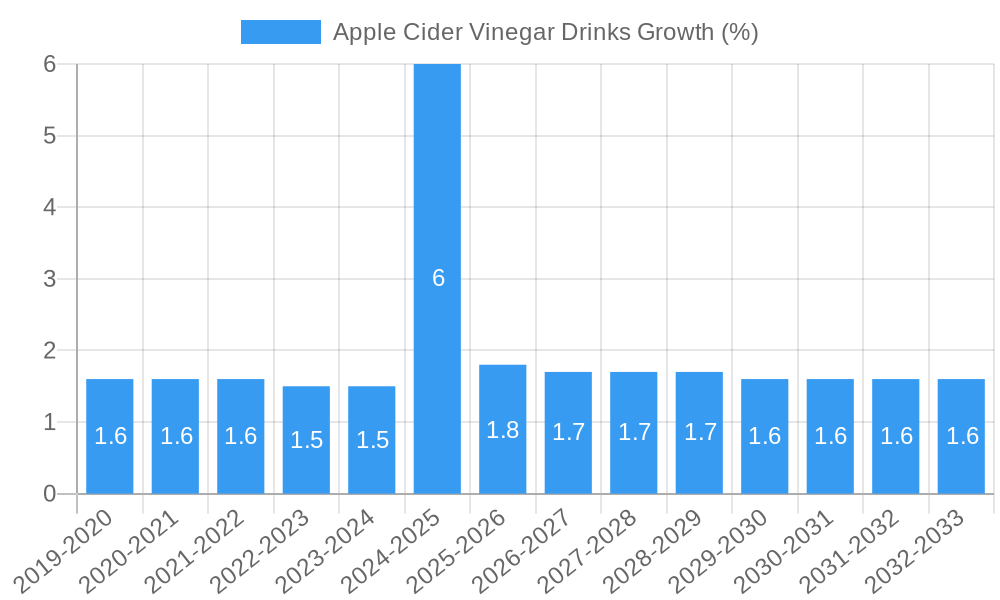
The global Apple Cider Vinegar (ACV) Drinks market is projected to reach a substantial USD 882.5 million in 2025, demonstrating robust growth driven by increasing consumer awareness of ACV's health benefits and its versatile applications. The market is expected to expand at a Compound Annual Growth Rate (CAGR) of 2.8% from 2019 to 2033, indicating sustained demand and a positive outlook. Key market drivers include the growing popularity of health and wellness trends, the demand for natural and organic beverages, and the perceived advantages of ACV in digestion, weight management, and immune support. Consumers are actively seeking functional beverages that offer more than just hydration, and ACV drinks are well-positioned to meet this demand. The market is segmented into various applications such as online retail, supermarkets, grocery stores, and other distribution channels, reflecting the diverse purchasing habits of consumers. Furthermore, the market offers different product types, including Ready-to-Drink (RTD) formats and concentrated shots, catering to varied consumer preferences for convenience and dosage.
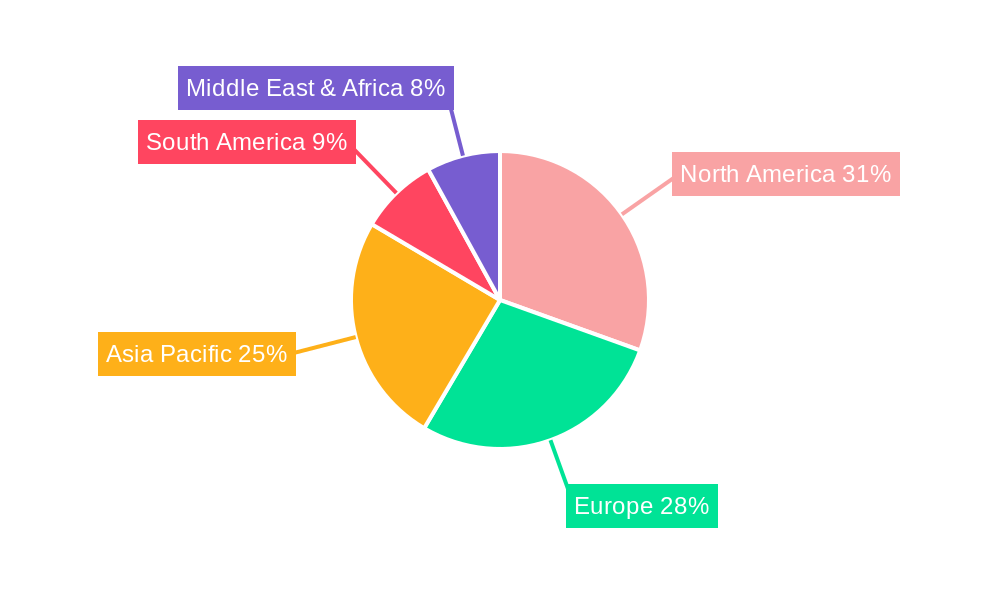
The market's expansion is further fueled by innovative product development and strategic marketing efforts by prominent companies like BRAGG, Vitacost, and Fleischmann's Vinegar. These companies are introducing new flavors, formulations, and packaging to attract a wider consumer base. The increasing availability of ACV drinks across various retail platforms, from online e-commerce giants to traditional brick-and-mortar stores, also contributes significantly to market penetration. While the market exhibits strong growth potential, certain restraints may influence its trajectory. These could include consumer perceptions regarding taste, potential digestive discomfort for some individuals if consumed in excess, and the competitive landscape presented by other functional beverages. However, the overall trend points towards a growing acceptance and integration of ACV drinks into daily health routines, particularly within health-conscious demographics across regions like North America, Europe, and Asia Pacific.
Apple Cider Vinegar Drinks Market Concentration & Innovation
The Apple Cider Vinegar (ACV) drinks market exhibits moderate to high concentration, with key players like BRAGG, Vitacost, and Fleischmann's Vinegar dominating significant market share, estimated at over 60% collectively. Innovation in this sector is primarily driven by evolving consumer demand for functional beverages and a growing awareness of ACV's health benefits. Product development focuses on enhanced flavor profiles, convenient formats (e.g., ready-to-drink shots), and the incorporation of additional health-boosting ingredients like ginger, turmeric, and probiotics. Regulatory frameworks, while generally supportive of food and beverage products, require stringent adherence to labeling and safety standards, particularly concerning health claims. Product substitutes, while present in the broader beverage category, are limited in offering the specific functional benefits associated with ACV. End-user trends show a strong preference for natural, organic, and low-sugar options. Mergers and acquisitions (M&A) activity, while not yet at a fever pitch, is expected to increase as larger beverage companies look to capitalize on the growing functional beverage trend. Notable M&A deal values are projected to reach an aggregate of $500 million over the forecast period, indicating strategic consolidation opportunities.
Apple Cider Vinegar Drinks Industry Trends & Insights
The Apple Cider Vinegar (ACV) drinks industry is experiencing robust growth, driven by a confluence of powerful market trends and evolving consumer preferences. The estimated Compound Annual Growth Rate (CAGR) for the global ACV drinks market is projected to be approximately 12.5% during the forecast period of 2025–2033. This substantial expansion is underpinned by a significant increase in market penetration, which is expected to rise from 15% in the historical period to over 40% by 2033. A primary growth driver is the escalating consumer interest in wellness and health-conscious beverages. ACV is increasingly recognized for its purported benefits, including aiding digestion, supporting weight management, and boosting the immune system, all of which are highly sought after by modern consumers. This trend is further amplified by social media influence and celebrity endorsements, which have significantly raised consumer awareness and demand for ACV-based products. Technological disruptions are also playing a crucial role. Advancements in processing and formulation techniques allow for the creation of more palatable and diverse ACV drink options, including ready-to-drink (RTD) formats and concentrated shots, catering to busy lifestyles. The development of sophisticated filtration and pasteurization methods ensures product quality and shelf-life without compromising the perceived health benefits. Furthermore, the industry is witnessing a surge in demand for organic and natural ingredients, prompting manufacturers to prioritize sourcing sustainable and high-quality apple cider vinegar. This commitment to naturalness aligns with the broader consumer shift away from artificial ingredients and processed foods. The competitive dynamics within the ACV drinks market are intensifying. While established players like BRAGG and Vitacost continue to hold significant market sway, new entrants and innovative startups are emerging, introducing novel product variations and targeting niche market segments. This heightened competition fosters innovation and pushes existing companies to refine their offerings and marketing strategies. The increasing availability of ACV drinks across various retail channels, from online platforms to brick-and-mortar supermarkets and specialty health stores, further fuels market growth and accessibility. The synergy between these trends – health consciousness, technological innovation, natural ingredient preference, and competitive market forces – paints a promising picture for the future of the Apple Cider Vinegar drinks industry.
Dominant Markets & Segments in Apple Cider Vinegar Drinks
The Apple Cider Vinegar (ACV) drinks market is witnessing robust growth across various regions and segments, with specific channels and product types demonstrating significant dominance. In terms of application, Online Retail is emerging as a particularly strong and dominant channel. This dominance is fueled by the convenience it offers consumers, enabling easy access to a wide variety of ACV drink brands and formulations from the comfort of their homes. The global online retail segment for ACV drinks is projected to account for approximately 45% of the total market revenue by 2033, with an estimated market size of over $3,500 million. Key drivers for this dominance include the increasing internet penetration worldwide, the widespread adoption of e-commerce platforms, and the ability of online retailers to offer competitive pricing and personalized shopping experiences. Furthermore, online platforms facilitate direct-to-consumer (DTC) sales, allowing brands to build stronger customer relationships and gather valuable data.
Supermarkets and Grocery Stores collectively represent another significant and dominant segment, currently holding an estimated 40% of the market share. Their dominance stems from their established presence in local communities, offering immediate accessibility and the ability for consumers to physically inspect products. The economic policies that support the growth of organized retail, coupled with efficient supply chain infrastructure, ensure consistent availability of ACV drinks in these outlets. Consumer trust in established grocery brands also contributes to their continued relevance.
In terms of product types, Ready-to-Drink (RTD) formats are poised for significant growth and are expected to capture a substantial market share, estimated to reach over 55% by 2033, with a market value exceeding $4,300 million. The dominance of RTD ACV drinks is largely attributed to their convenience and immediate consumption appeal, aligning perfectly with the fast-paced lifestyles of modern consumers. Key drivers for this dominance include the portability and grab-and-go nature of these products, making them ideal for consumption at home, at work, or on the go. The development of appealing flavor profiles and attractive packaging further enhances their market appeal.
Shots, as a specialized RTD format, are also experiencing remarkable growth and are expected to contribute significantly to the overall market, estimated to capture 25% of the market share by 2033, with a market value of approximately $2,000 million. The concentrated nature of ACV shots makes them particularly attractive to consumers seeking targeted health benefits, such as digestive support or detoxification. The ease of incorporation into daily routines, often requiring just a quick consumption, further fuels their popularity. Economic factors, such as the perceived value for money in concentrated forms, also contribute to their growing dominance.
The "Others" application segment, which includes health food stores, convenience stores, and foodservice channels, will likely account for the remaining market share, estimated at 15%, with a market value of around $1,200 million. While not as dominant as online retail or supermarkets, these channels cater to specific consumer niches and impulse purchases.
Apple Cider Vinegar Drinks Product Developments
Product innovations in the Apple Cider Vinegar (ACV) drinks market are primarily focused on enhancing consumer appeal and addressing specific wellness needs. Manufacturers are developing a wider array of flavors, moving beyond the traditional tartness to incorporate fruit juices, botanicals like ginger and turmeric, and natural sweeteners to create more palatable and enjoyable beverages. The development of ready-to-drink (RTD) formats, including cans, bottles, and convenient single-serving shots, caters to the demand for on-the-go consumption. Technological advancements are enabling the creation of sparkling and infused ACV drinks, offering a refreshing alternative to traditional beverages. Competitive advantages are being built through the emphasis on organic, non-GMO, and allergen-free formulations, appealing to health-conscious consumers. The strategic incorporation of probiotics and prebiotics is also a growing trend, positioning ACV drinks as comprehensive functional beverages.
Report Scope & Segmentation Analysis
This comprehensive report analyzes the global Apple Cider Vinegar (ACV) drinks market, segmenting it by application and product type to provide granular insights. The Application segment is broken down into Online Retail, Supermarkets, Grocery Stores, and Others. The Online Retail segment is projected to witness a CAGR of 15% from 2025 to 2033, with an estimated market size of $3,500 million by the end of the forecast period. This segment is characterized by rapid growth due to e-commerce penetration and convenience. The Supermarkets and Grocery Stores segment, currently dominant, is expected to grow at a steady CAGR of 10%, reaching approximately $3,200 million by 2033, driven by wide distribution and consumer accessibility. The Others segment, encompassing niche retail and foodservice, is anticipated to grow at a CAGR of 8%, with a market value of $1,200 million.
The Product Types segment is analyzed into Ready-to-Drink (RTD) formats and Shots. The RTD segment is projected to be the largest and fastest-growing, with an estimated CAGR of 13% and a market size of $4,300 million by 2033, driven by convenience and widespread adoption. The Shots segment, targeting concentrated health benefits, is expected to experience a CAGR of 14%, reaching a market value of $2,000 million by 2033, indicating a strong demand for convenient wellness solutions. Competitive dynamics within each segment vary, with online retail witnessing intense competition from new brands, while established players hold strong positions in traditional retail channels.
Key Drivers of Apple Cider Vinegar Drinks Growth
The growth of the Apple Cider Vinegar (ACV) drinks market is propelled by a multifaceted interplay of factors. A significant driver is the increasing consumer awareness of health and wellness, with ACV being increasingly recognized for its purported benefits in digestion, weight management, and immune support. This trend is amplified by social media and influencer marketing, which have popularized ACV as a functional beverage. Technological advancements in product formulation and packaging are creating more palatable and convenient ACV drink options, such as ready-to-drink (RTD) formats and flavored variants, thereby expanding consumer appeal. Furthermore, the growing preference for natural, organic, and plant-based products aligns perfectly with the inherent qualities of ACV, driving demand among health-conscious demographics. Favorable economic policies and the expansion of retail infrastructure, particularly in emerging markets, are also contributing to wider accessibility and market penetration.
Challenges in the Apple Cider Vinegar Drinks Sector
Despite its promising growth trajectory, the Apple Cider Vinegar (ACV) drinks market faces several challenges. A primary restraint is the strong and distinct taste of ACV, which can be unappealing to a significant portion of consumers, requiring extensive flavoring and formulation efforts to overcome. Regulatory hurdles and the ambiguity surrounding health claims can also pose challenges, as manufacturers must navigate stringent guidelines to avoid misleading consumers and face potential penalties. Supply chain disruptions, particularly for organic and high-quality apple sourcing, can impact production costs and availability, potentially leading to price volatility, estimated at a 5-10% fluctuation. Intense competition from a wide range of functional beverages and established soft drink brands requires continuous innovation and effective marketing strategies to capture market share, estimated at a 20% impact on smaller players. Consumer education regarding the actual benefits and proper consumption of ACV drinks remains an ongoing challenge, with an estimated 30% of potential consumers still uninformed.
Emerging Opportunities in Apple Cider Vinegar Drinks
The Apple Cider Vinegar (ACV) drinks market is ripe with emerging opportunities for growth and innovation. The expansion into untapped geographical markets, particularly in Asia-Pacific and Latin America, presents significant potential due to growing health consciousness and disposable incomes. The development of novel functional formulations, such as ACV drinks fortified with vitamins, minerals, or adaptogens, can cater to niche health needs and attract a broader consumer base. Collaborations with wellness influencers and health practitioners can further enhance brand credibility and reach new audiences. The growing trend of personalization and customized beverage solutions opens doors for brands to offer tailor-made ACV drink mixes or subscription services. Furthermore, the increasing demand for sustainable and eco-friendly packaging provides an opportunity for brands to differentiate themselves and appeal to environmentally conscious consumers. The exploration of strategic partnerships with fitness centers, yoga studios, and corporate wellness programs can unlock significant B2B opportunities, with potential deal values exceeding $100 million annually.
Leading Players in the Apple Cider Vinegar Drinks Market
BRAGG Vitacost Fleischmann's Vinegar Dynamic Health TDYH Drink Corp. Kanesho Foshan Haitian company Jiangsu Hengshun Vinegar Industry Co.,Ltd
Key Developments in Apple Cider Vinegar Drinks Industry
- 2023 March: BRAGG launches a new line of sparkling ACV beverages with added botanical infusions, targeting the functional beverage market.
- 2022 November: Vitacost introduces a concentrated ACV shot formulated with ginger and lemon, emphasizing digestive health benefits.
- 2022 June: Dynamic Health expands its distribution network into major European supermarkets, increasing its global market reach.
- 2021 October: Fleischmann's Vinegar announces a partnership with a leading beverage co-packer to scale up production of their ACV drink products.
- 2020 January: Jiangsu Hengshun Vinegar Industry Co., Ltd. invests $50 million in a new production facility to meet the growing demand for ACV-based beverages in China.
Strategic Outlook for Apple Cider Vinegar Drinks Market
The strategic outlook for the Apple Cider Vinegar (ACV) drinks market remains highly positive, characterized by sustained growth and evolving consumer preferences. Key growth catalysts include the continued emphasis on holistic wellness, the increasing demand for convenient and functional beverages, and the ongoing innovation in product development. Companies that prioritize natural, organic ingredients, invest in sophisticated formulation to enhance taste and efficacy, and leverage digital channels for marketing and distribution will be well-positioned for success. Strategic partnerships and potential mergers and acquisitions are anticipated as the market matures, consolidating players and fostering industry-wide advancement. The long-term potential lies in further educating consumers about the multifaceted benefits of ACV, thereby driving broader adoption and solidifying its position as a staple in the functional beverage category, with projected market expansion exceeding $7,000 million by 2033.
Apple Cider Vinegar Drinks Segmentation
-
1. Application
- 1.1. Online Retail
- 1.2. Supermakets
- 1.3. Grocery store
- 1.4. Others
-
2. Types
- 2.1. RDT
- 2.2. Shots
Apple Cider Vinegar Drinks Segmentation By Geography
-
1. North America
- 1.1. United States
- 1.2. Canada
- 1.3. Mexico
-
2. South America
- 2.1. Brazil
- 2.2. Argentina
- 2.3. Rest of South America
-
3. Europe
- 3.1. United Kingdom
- 3.2. Germany
- 3.3. France
- 3.4. Italy
- 3.5. Spain
- 3.6. Russia
- 3.7. Benelux
- 3.8. Nordics
- 3.9. Rest of Europe
-
4. Middle East & Africa
- 4.1. Turkey
- 4.2. Israel
- 4.3. GCC
- 4.4. North Africa
- 4.5. South Africa
- 4.6. Rest of Middle East & Africa
-
5. Asia Pacific
- 5.1. China
- 5.2. India
- 5.3. Japan
- 5.4. South Korea
- 5.5. ASEAN
- 5.6. Oceania
- 5.7. Rest of Asia Pacific
Apple Cider Vinegar Drinks REPORT HIGHLIGHTS
| Aspects | Details |
|---|---|
| Study Period | 2019-2033 |
| Base Year | 2024 |
| Estimated Year | 2025 |
| Forecast Period | 2025-2033 |
| Historical Period | 2019-2024 |
| Growth Rate | CAGR of 2.8% from 2019-2033 |
| Segmentation |
|
Table of Contents
- 1. Introduction
- 1.1. Research Scope
- 1.2. Market Segmentation
- 1.3. Research Methodology
- 1.4. Definitions and Assumptions
- 2. Executive Summary
- 2.1. Introduction
- 3. Market Dynamics
- 3.1. Introduction
- 3.2. Market Drivers
- 3.3. Market Restrains
- 3.4. Market Trends
- 4. Market Factor Analysis
- 4.1. Porters Five Forces
- 4.2. Supply/Value Chain
- 4.3. PESTEL analysis
- 4.4. Market Entropy
- 4.5. Patent/Trademark Analysis
- 5. Global Apple Cider Vinegar Drinks Analysis, Insights and Forecast, 2019-2031
- 5.1. Market Analysis, Insights and Forecast - by Application
- 5.1.1. Online Retail
- 5.1.2. Supermakets
- 5.1.3. Grocery store
- 5.1.4. Others
- 5.2. Market Analysis, Insights and Forecast - by Types
- 5.2.1. RDT
- 5.2.2. Shots
- 5.3. Market Analysis, Insights and Forecast - by Region
- 5.3.1. North America
- 5.3.2. South America
- 5.3.3. Europe
- 5.3.4. Middle East & Africa
- 5.3.5. Asia Pacific
- 5.1. Market Analysis, Insights and Forecast - by Application
- 6. North America Apple Cider Vinegar Drinks Analysis, Insights and Forecast, 2019-2031
- 6.1. Market Analysis, Insights and Forecast - by Application
- 6.1.1. Online Retail
- 6.1.2. Supermakets
- 6.1.3. Grocery store
- 6.1.4. Others
- 6.2. Market Analysis, Insights and Forecast - by Types
- 6.2.1. RDT
- 6.2.2. Shots
- 6.1. Market Analysis, Insights and Forecast - by Application
- 7. South America Apple Cider Vinegar Drinks Analysis, Insights and Forecast, 2019-2031
- 7.1. Market Analysis, Insights and Forecast - by Application
- 7.1.1. Online Retail
- 7.1.2. Supermakets
- 7.1.3. Grocery store
- 7.1.4. Others
- 7.2. Market Analysis, Insights and Forecast - by Types
- 7.2.1. RDT
- 7.2.2. Shots
- 7.1. Market Analysis, Insights and Forecast - by Application
- 8. Europe Apple Cider Vinegar Drinks Analysis, Insights and Forecast, 2019-2031
- 8.1. Market Analysis, Insights and Forecast - by Application
- 8.1.1. Online Retail
- 8.1.2. Supermakets
- 8.1.3. Grocery store
- 8.1.4. Others
- 8.2. Market Analysis, Insights and Forecast - by Types
- 8.2.1. RDT
- 8.2.2. Shots
- 8.1. Market Analysis, Insights and Forecast - by Application
- 9. Middle East & Africa Apple Cider Vinegar Drinks Analysis, Insights and Forecast, 2019-2031
- 9.1. Market Analysis, Insights and Forecast - by Application
- 9.1.1. Online Retail
- 9.1.2. Supermakets
- 9.1.3. Grocery store
- 9.1.4. Others
- 9.2. Market Analysis, Insights and Forecast - by Types
- 9.2.1. RDT
- 9.2.2. Shots
- 9.1. Market Analysis, Insights and Forecast - by Application
- 10. Asia Pacific Apple Cider Vinegar Drinks Analysis, Insights and Forecast, 2019-2031
- 10.1. Market Analysis, Insights and Forecast - by Application
- 10.1.1. Online Retail
- 10.1.2. Supermakets
- 10.1.3. Grocery store
- 10.1.4. Others
- 10.2. Market Analysis, Insights and Forecast - by Types
- 10.2.1. RDT
- 10.2.2. Shots
- 10.1. Market Analysis, Insights and Forecast - by Application
- 11. Competitive Analysis
- 11.1. Global Market Share Analysis 2024
- 11.2. Company Profiles
- 11.2.1 BRAGG
- 11.2.1.1. Overview
- 11.2.1.2. Products
- 11.2.1.3. SWOT Analysis
- 11.2.1.4. Recent Developments
- 11.2.1.5. Financials (Based on Availability)
- 11.2.2 Vitacost
- 11.2.2.1. Overview
- 11.2.2.2. Products
- 11.2.2.3. SWOT Analysis
- 11.2.2.4. Recent Developments
- 11.2.2.5. Financials (Based on Availability)
- 11.2.3 Fleischmann's Vinegar
- 11.2.3.1. Overview
- 11.2.3.2. Products
- 11.2.3.3. SWOT Analysis
- 11.2.3.4. Recent Developments
- 11.2.3.5. Financials (Based on Availability)
- 11.2.4 Dynamic Health
- 11.2.4.1. Overview
- 11.2.4.2. Products
- 11.2.4.3. SWOT Analysis
- 11.2.4.4. Recent Developments
- 11.2.4.5. Financials (Based on Availability)
- 11.2.5 TDYH Drink Corp.
- 11.2.5.1. Overview
- 11.2.5.2. Products
- 11.2.5.3. SWOT Analysis
- 11.2.5.4. Recent Developments
- 11.2.5.5. Financials (Based on Availability)
- 11.2.6 Kanesho
- 11.2.6.1. Overview
- 11.2.6.2. Products
- 11.2.6.3. SWOT Analysis
- 11.2.6.4. Recent Developments
- 11.2.6.5. Financials (Based on Availability)
- 11.2.7 Foshan Haitian company
- 11.2.7.1. Overview
- 11.2.7.2. Products
- 11.2.7.3. SWOT Analysis
- 11.2.7.4. Recent Developments
- 11.2.7.5. Financials (Based on Availability)
- 11.2.8 Jiangsu Hengshun Vinegar Industry Co.
- 11.2.8.1. Overview
- 11.2.8.2. Products
- 11.2.8.3. SWOT Analysis
- 11.2.8.4. Recent Developments
- 11.2.8.5. Financials (Based on Availability)
- 11.2.9 Ltd
- 11.2.9.1. Overview
- 11.2.9.2. Products
- 11.2.9.3. SWOT Analysis
- 11.2.9.4. Recent Developments
- 11.2.9.5. Financials (Based on Availability)
- 11.2.1 BRAGG
List of Figures
- Figure 1: Global Apple Cider Vinegar Drinks Revenue Breakdown (million, %) by Region 2024 & 2032
- Figure 2: Global Apple Cider Vinegar Drinks Volume Breakdown (K, %) by Region 2024 & 2032
- Figure 3: North America Apple Cider Vinegar Drinks Revenue (million), by Application 2024 & 2032
- Figure 4: North America Apple Cider Vinegar Drinks Volume (K), by Application 2024 & 2032
- Figure 5: North America Apple Cider Vinegar Drinks Revenue Share (%), by Application 2024 & 2032
- Figure 6: North America Apple Cider Vinegar Drinks Volume Share (%), by Application 2024 & 2032
- Figure 7: North America Apple Cider Vinegar Drinks Revenue (million), by Types 2024 & 2032
- Figure 8: North America Apple Cider Vinegar Drinks Volume (K), by Types 2024 & 2032
- Figure 9: North America Apple Cider Vinegar Drinks Revenue Share (%), by Types 2024 & 2032
- Figure 10: North America Apple Cider Vinegar Drinks Volume Share (%), by Types 2024 & 2032
- Figure 11: North America Apple Cider Vinegar Drinks Revenue (million), by Country 2024 & 2032
- Figure 12: North America Apple Cider Vinegar Drinks Volume (K), by Country 2024 & 2032
- Figure 13: North America Apple Cider Vinegar Drinks Revenue Share (%), by Country 2024 & 2032
- Figure 14: North America Apple Cider Vinegar Drinks Volume Share (%), by Country 2024 & 2032
- Figure 15: South America Apple Cider Vinegar Drinks Revenue (million), by Application 2024 & 2032
- Figure 16: South America Apple Cider Vinegar Drinks Volume (K), by Application 2024 & 2032
- Figure 17: South America Apple Cider Vinegar Drinks Revenue Share (%), by Application 2024 & 2032
- Figure 18: South America Apple Cider Vinegar Drinks Volume Share (%), by Application 2024 & 2032
- Figure 19: South America Apple Cider Vinegar Drinks Revenue (million), by Types 2024 & 2032
- Figure 20: South America Apple Cider Vinegar Drinks Volume (K), by Types 2024 & 2032
- Figure 21: South America Apple Cider Vinegar Drinks Revenue Share (%), by Types 2024 & 2032
- Figure 22: South America Apple Cider Vinegar Drinks Volume Share (%), by Types 2024 & 2032
- Figure 23: South America Apple Cider Vinegar Drinks Revenue (million), by Country 2024 & 2032
- Figure 24: South America Apple Cider Vinegar Drinks Volume (K), by Country 2024 & 2032
- Figure 25: South America Apple Cider Vinegar Drinks Revenue Share (%), by Country 2024 & 2032
- Figure 26: South America Apple Cider Vinegar Drinks Volume Share (%), by Country 2024 & 2032
- Figure 27: Europe Apple Cider Vinegar Drinks Revenue (million), by Application 2024 & 2032
- Figure 28: Europe Apple Cider Vinegar Drinks Volume (K), by Application 2024 & 2032
- Figure 29: Europe Apple Cider Vinegar Drinks Revenue Share (%), by Application 2024 & 2032
- Figure 30: Europe Apple Cider Vinegar Drinks Volume Share (%), by Application 2024 & 2032
- Figure 31: Europe Apple Cider Vinegar Drinks Revenue (million), by Types 2024 & 2032
- Figure 32: Europe Apple Cider Vinegar Drinks Volume (K), by Types 2024 & 2032
- Figure 33: Europe Apple Cider Vinegar Drinks Revenue Share (%), by Types 2024 & 2032
- Figure 34: Europe Apple Cider Vinegar Drinks Volume Share (%), by Types 2024 & 2032
- Figure 35: Europe Apple Cider Vinegar Drinks Revenue (million), by Country 2024 & 2032
- Figure 36: Europe Apple Cider Vinegar Drinks Volume (K), by Country 2024 & 2032
- Figure 37: Europe Apple Cider Vinegar Drinks Revenue Share (%), by Country 2024 & 2032
- Figure 38: Europe Apple Cider Vinegar Drinks Volume Share (%), by Country 2024 & 2032
- Figure 39: Middle East & Africa Apple Cider Vinegar Drinks Revenue (million), by Application 2024 & 2032
- Figure 40: Middle East & Africa Apple Cider Vinegar Drinks Volume (K), by Application 2024 & 2032
- Figure 41: Middle East & Africa Apple Cider Vinegar Drinks Revenue Share (%), by Application 2024 & 2032
- Figure 42: Middle East & Africa Apple Cider Vinegar Drinks Volume Share (%), by Application 2024 & 2032
- Figure 43: Middle East & Africa Apple Cider Vinegar Drinks Revenue (million), by Types 2024 & 2032
- Figure 44: Middle East & Africa Apple Cider Vinegar Drinks Volume (K), by Types 2024 & 2032
- Figure 45: Middle East & Africa Apple Cider Vinegar Drinks Revenue Share (%), by Types 2024 & 2032
- Figure 46: Middle East & Africa Apple Cider Vinegar Drinks Volume Share (%), by Types 2024 & 2032
- Figure 47: Middle East & Africa Apple Cider Vinegar Drinks Revenue (million), by Country 2024 & 2032
- Figure 48: Middle East & Africa Apple Cider Vinegar Drinks Volume (K), by Country 2024 & 2032
- Figure 49: Middle East & Africa Apple Cider Vinegar Drinks Revenue Share (%), by Country 2024 & 2032
- Figure 50: Middle East & Africa Apple Cider Vinegar Drinks Volume Share (%), by Country 2024 & 2032
- Figure 51: Asia Pacific Apple Cider Vinegar Drinks Revenue (million), by Application 2024 & 2032
- Figure 52: Asia Pacific Apple Cider Vinegar Drinks Volume (K), by Application 2024 & 2032
- Figure 53: Asia Pacific Apple Cider Vinegar Drinks Revenue Share (%), by Application 2024 & 2032
- Figure 54: Asia Pacific Apple Cider Vinegar Drinks Volume Share (%), by Application 2024 & 2032
- Figure 55: Asia Pacific Apple Cider Vinegar Drinks Revenue (million), by Types 2024 & 2032
- Figure 56: Asia Pacific Apple Cider Vinegar Drinks Volume (K), by Types 2024 & 2032
- Figure 57: Asia Pacific Apple Cider Vinegar Drinks Revenue Share (%), by Types 2024 & 2032
- Figure 58: Asia Pacific Apple Cider Vinegar Drinks Volume Share (%), by Types 2024 & 2032
- Figure 59: Asia Pacific Apple Cider Vinegar Drinks Revenue (million), by Country 2024 & 2032
- Figure 60: Asia Pacific Apple Cider Vinegar Drinks Volume (K), by Country 2024 & 2032
- Figure 61: Asia Pacific Apple Cider Vinegar Drinks Revenue Share (%), by Country 2024 & 2032
- Figure 62: Asia Pacific Apple Cider Vinegar Drinks Volume Share (%), by Country 2024 & 2032
List of Tables
- Table 1: Global Apple Cider Vinegar Drinks Revenue million Forecast, by Region 2019 & 2032
- Table 2: Global Apple Cider Vinegar Drinks Volume K Forecast, by Region 2019 & 2032
- Table 3: Global Apple Cider Vinegar Drinks Revenue million Forecast, by Application 2019 & 2032
- Table 4: Global Apple Cider Vinegar Drinks Volume K Forecast, by Application 2019 & 2032
- Table 5: Global Apple Cider Vinegar Drinks Revenue million Forecast, by Types 2019 & 2032
- Table 6: Global Apple Cider Vinegar Drinks Volume K Forecast, by Types 2019 & 2032
- Table 7: Global Apple Cider Vinegar Drinks Revenue million Forecast, by Region 2019 & 2032
- Table 8: Global Apple Cider Vinegar Drinks Volume K Forecast, by Region 2019 & 2032
- Table 9: Global Apple Cider Vinegar Drinks Revenue million Forecast, by Application 2019 & 2032
- Table 10: Global Apple Cider Vinegar Drinks Volume K Forecast, by Application 2019 & 2032
- Table 11: Global Apple Cider Vinegar Drinks Revenue million Forecast, by Types 2019 & 2032
- Table 12: Global Apple Cider Vinegar Drinks Volume K Forecast, by Types 2019 & 2032
- Table 13: Global Apple Cider Vinegar Drinks Revenue million Forecast, by Country 2019 & 2032
- Table 14: Global Apple Cider Vinegar Drinks Volume K Forecast, by Country 2019 & 2032
- Table 15: United States Apple Cider Vinegar Drinks Revenue (million) Forecast, by Application 2019 & 2032
- Table 16: United States Apple Cider Vinegar Drinks Volume (K) Forecast, by Application 2019 & 2032
- Table 17: Canada Apple Cider Vinegar Drinks Revenue (million) Forecast, by Application 2019 & 2032
- Table 18: Canada Apple Cider Vinegar Drinks Volume (K) Forecast, by Application 2019 & 2032
- Table 19: Mexico Apple Cider Vinegar Drinks Revenue (million) Forecast, by Application 2019 & 2032
- Table 20: Mexico Apple Cider Vinegar Drinks Volume (K) Forecast, by Application 2019 & 2032
- Table 21: Global Apple Cider Vinegar Drinks Revenue million Forecast, by Application 2019 & 2032
- Table 22: Global Apple Cider Vinegar Drinks Volume K Forecast, by Application 2019 & 2032
- Table 23: Global Apple Cider Vinegar Drinks Revenue million Forecast, by Types 2019 & 2032
- Table 24: Global Apple Cider Vinegar Drinks Volume K Forecast, by Types 2019 & 2032
- Table 25: Global Apple Cider Vinegar Drinks Revenue million Forecast, by Country 2019 & 2032
- Table 26: Global Apple Cider Vinegar Drinks Volume K Forecast, by Country 2019 & 2032
- Table 27: Brazil Apple Cider Vinegar Drinks Revenue (million) Forecast, by Application 2019 & 2032
- Table 28: Brazil Apple Cider Vinegar Drinks Volume (K) Forecast, by Application 2019 & 2032
- Table 29: Argentina Apple Cider Vinegar Drinks Revenue (million) Forecast, by Application 2019 & 2032
- Table 30: Argentina Apple Cider Vinegar Drinks Volume (K) Forecast, by Application 2019 & 2032
- Table 31: Rest of South America Apple Cider Vinegar Drinks Revenue (million) Forecast, by Application 2019 & 2032
- Table 32: Rest of South America Apple Cider Vinegar Drinks Volume (K) Forecast, by Application 2019 & 2032
- Table 33: Global Apple Cider Vinegar Drinks Revenue million Forecast, by Application 2019 & 2032
- Table 34: Global Apple Cider Vinegar Drinks Volume K Forecast, by Application 2019 & 2032
- Table 35: Global Apple Cider Vinegar Drinks Revenue million Forecast, by Types 2019 & 2032
- Table 36: Global Apple Cider Vinegar Drinks Volume K Forecast, by Types 2019 & 2032
- Table 37: Global Apple Cider Vinegar Drinks Revenue million Forecast, by Country 2019 & 2032
- Table 38: Global Apple Cider Vinegar Drinks Volume K Forecast, by Country 2019 & 2032
- Table 39: United Kingdom Apple Cider Vinegar Drinks Revenue (million) Forecast, by Application 2019 & 2032
- Table 40: United Kingdom Apple Cider Vinegar Drinks Volume (K) Forecast, by Application 2019 & 2032
- Table 41: Germany Apple Cider Vinegar Drinks Revenue (million) Forecast, by Application 2019 & 2032
- Table 42: Germany Apple Cider Vinegar Drinks Volume (K) Forecast, by Application 2019 & 2032
- Table 43: France Apple Cider Vinegar Drinks Revenue (million) Forecast, by Application 2019 & 2032
- Table 44: France Apple Cider Vinegar Drinks Volume (K) Forecast, by Application 2019 & 2032
- Table 45: Italy Apple Cider Vinegar Drinks Revenue (million) Forecast, by Application 2019 & 2032
- Table 46: Italy Apple Cider Vinegar Drinks Volume (K) Forecast, by Application 2019 & 2032
- Table 47: Spain Apple Cider Vinegar Drinks Revenue (million) Forecast, by Application 2019 & 2032
- Table 48: Spain Apple Cider Vinegar Drinks Volume (K) Forecast, by Application 2019 & 2032
- Table 49: Russia Apple Cider Vinegar Drinks Revenue (million) Forecast, by Application 2019 & 2032
- Table 50: Russia Apple Cider Vinegar Drinks Volume (K) Forecast, by Application 2019 & 2032
- Table 51: Benelux Apple Cider Vinegar Drinks Revenue (million) Forecast, by Application 2019 & 2032
- Table 52: Benelux Apple Cider Vinegar Drinks Volume (K) Forecast, by Application 2019 & 2032
- Table 53: Nordics Apple Cider Vinegar Drinks Revenue (million) Forecast, by Application 2019 & 2032
- Table 54: Nordics Apple Cider Vinegar Drinks Volume (K) Forecast, by Application 2019 & 2032
- Table 55: Rest of Europe Apple Cider Vinegar Drinks Revenue (million) Forecast, by Application 2019 & 2032
- Table 56: Rest of Europe Apple Cider Vinegar Drinks Volume (K) Forecast, by Application 2019 & 2032
- Table 57: Global Apple Cider Vinegar Drinks Revenue million Forecast, by Application 2019 & 2032
- Table 58: Global Apple Cider Vinegar Drinks Volume K Forecast, by Application 2019 & 2032
- Table 59: Global Apple Cider Vinegar Drinks Revenue million Forecast, by Types 2019 & 2032
- Table 60: Global Apple Cider Vinegar Drinks Volume K Forecast, by Types 2019 & 2032
- Table 61: Global Apple Cider Vinegar Drinks Revenue million Forecast, by Country 2019 & 2032
- Table 62: Global Apple Cider Vinegar Drinks Volume K Forecast, by Country 2019 & 2032
- Table 63: Turkey Apple Cider Vinegar Drinks Revenue (million) Forecast, by Application 2019 & 2032
- Table 64: Turkey Apple Cider Vinegar Drinks Volume (K) Forecast, by Application 2019 & 2032
- Table 65: Israel Apple Cider Vinegar Drinks Revenue (million) Forecast, by Application 2019 & 2032
- Table 66: Israel Apple Cider Vinegar Drinks Volume (K) Forecast, by Application 2019 & 2032
- Table 67: GCC Apple Cider Vinegar Drinks Revenue (million) Forecast, by Application 2019 & 2032
- Table 68: GCC Apple Cider Vinegar Drinks Volume (K) Forecast, by Application 2019 & 2032
- Table 69: North Africa Apple Cider Vinegar Drinks Revenue (million) Forecast, by Application 2019 & 2032
- Table 70: North Africa Apple Cider Vinegar Drinks Volume (K) Forecast, by Application 2019 & 2032
- Table 71: South Africa Apple Cider Vinegar Drinks Revenue (million) Forecast, by Application 2019 & 2032
- Table 72: South Africa Apple Cider Vinegar Drinks Volume (K) Forecast, by Application 2019 & 2032
- Table 73: Rest of Middle East & Africa Apple Cider Vinegar Drinks Revenue (million) Forecast, by Application 2019 & 2032
- Table 74: Rest of Middle East & Africa Apple Cider Vinegar Drinks Volume (K) Forecast, by Application 2019 & 2032
- Table 75: Global Apple Cider Vinegar Drinks Revenue million Forecast, by Application 2019 & 2032
- Table 76: Global Apple Cider Vinegar Drinks Volume K Forecast, by Application 2019 & 2032
- Table 77: Global Apple Cider Vinegar Drinks Revenue million Forecast, by Types 2019 & 2032
- Table 78: Global Apple Cider Vinegar Drinks Volume K Forecast, by Types 2019 & 2032
- Table 79: Global Apple Cider Vinegar Drinks Revenue million Forecast, by Country 2019 & 2032
- Table 80: Global Apple Cider Vinegar Drinks Volume K Forecast, by Country 2019 & 2032
- Table 81: China Apple Cider Vinegar Drinks Revenue (million) Forecast, by Application 2019 & 2032
- Table 82: China Apple Cider Vinegar Drinks Volume (K) Forecast, by Application 2019 & 2032
- Table 83: India Apple Cider Vinegar Drinks Revenue (million) Forecast, by Application 2019 & 2032
- Table 84: India Apple Cider Vinegar Drinks Volume (K) Forecast, by Application 2019 & 2032
- Table 85: Japan Apple Cider Vinegar Drinks Revenue (million) Forecast, by Application 2019 & 2032
- Table 86: Japan Apple Cider Vinegar Drinks Volume (K) Forecast, by Application 2019 & 2032
- Table 87: South Korea Apple Cider Vinegar Drinks Revenue (million) Forecast, by Application 2019 & 2032
- Table 88: South Korea Apple Cider Vinegar Drinks Volume (K) Forecast, by Application 2019 & 2032
- Table 89: ASEAN Apple Cider Vinegar Drinks Revenue (million) Forecast, by Application 2019 & 2032
- Table 90: ASEAN Apple Cider Vinegar Drinks Volume (K) Forecast, by Application 2019 & 2032
- Table 91: Oceania Apple Cider Vinegar Drinks Revenue (million) Forecast, by Application 2019 & 2032
- Table 92: Oceania Apple Cider Vinegar Drinks Volume (K) Forecast, by Application 2019 & 2032
- Table 93: Rest of Asia Pacific Apple Cider Vinegar Drinks Revenue (million) Forecast, by Application 2019 & 2032
- Table 94: Rest of Asia Pacific Apple Cider Vinegar Drinks Volume (K) Forecast, by Application 2019 & 2032
Frequently Asked Questions
1. What is the projected Compound Annual Growth Rate (CAGR) of the Apple Cider Vinegar Drinks?
The projected CAGR is approximately 2.8%.
2. Which companies are prominent players in the Apple Cider Vinegar Drinks?
Key companies in the market include BRAGG, Vitacost, Fleischmann's Vinegar, Dynamic Health, TDYH Drink Corp., Kanesho, Foshan Haitian company, Jiangsu Hengshun Vinegar Industry Co., Ltd.
3. What are the main segments of the Apple Cider Vinegar Drinks?
The market segments include Application, Types.
4. Can you provide details about the market size?
The market size is estimated to be USD 882.5 million as of 2022.
5. What are some drivers contributing to market growth?
N/A
6. What are the notable trends driving market growth?
N/A
7. Are there any restraints impacting market growth?
N/A
8. Can you provide examples of recent developments in the market?
N/A
9. What pricing options are available for accessing the report?
Pricing options include single-user, multi-user, and enterprise licenses priced at USD 3350.00, USD 5025.00, and USD 6700.00 respectively.
10. Is the market size provided in terms of value or volume?
The market size is provided in terms of value, measured in million and volume, measured in K.
11. Are there any specific market keywords associated with the report?
Yes, the market keyword associated with the report is "Apple Cider Vinegar Drinks," which aids in identifying and referencing the specific market segment covered.
12. How do I determine which pricing option suits my needs best?
The pricing options vary based on user requirements and access needs. Individual users may opt for single-user licenses, while businesses requiring broader access may choose multi-user or enterprise licenses for cost-effective access to the report.
13. Are there any additional resources or data provided in the Apple Cider Vinegar Drinks report?
While the report offers comprehensive insights, it's advisable to review the specific contents or supplementary materials provided to ascertain if additional resources or data are available.
14. How can I stay updated on further developments or reports in the Apple Cider Vinegar Drinks?
To stay informed about further developments, trends, and reports in the Apple Cider Vinegar Drinks, consider subscribing to industry newsletters, following relevant companies and organizations, or regularly checking reputable industry news sources and publications.
Methodology
Step 1 - Identification of Relevant Samples Size from Population Database


Step 2 - Approaches for Defining Global Market Size (Value, Volume* & Price*)

Note*: In applicable scenarios
Step 3 - Data Sources
Primary Research
- Web Analytics
- Survey Reports
- Research Institute
- Latest Research Reports
- Opinion Leaders
Secondary Research
- Annual Reports
- White Paper
- Latest Press Release
- Industry Association
- Paid Database
- Investor Presentations

Step 4 - Data Triangulation
Involves using different sources of information in order to increase the validity of a study
These sources are likely to be stakeholders in a program - participants, other researchers, program staff, other community members, and so on.
Then we put all data in single framework & apply various statistical tools to find out the dynamic on the market.
During the analysis stage, feedback from the stakeholder groups would be compared to determine areas of agreement as well as areas of divergence


