Apron Bus Market Trends and Opportunities for Growth

Apron Bus Market by Production Analysis, by Consumption Analysis, by Import Market Analysis (Value & Volume), by Export Market Analysis (Value & Volume), by Price Trend Analysis, by North America (United States, Canada, Mexico), by South America (Brazil, Argentina, Rest of South America), by Europe (United Kingdom, Germany, France, Italy, Spain, Russia, Benelux, Nordics, Rest of Europe), by Middle East & Africa (Turkey, Israel, GCC, North Africa, South Africa, Rest of Middle East & Africa), by Asia Pacific (China, India, Japan, South Korea, ASEAN, Oceania, Rest of Asia Pacific) Forecast 2025-2033

Jun 28 2025
Base Year: 2024

234 Pages
Main Logo

Apron Bus Market Trends and Opportunities for Growth


Home
Industries
Aerospace & Defense
sponsor image
sponsor image
sponsor image
sponsor image

Tailored for you

  • In-depth Analysis Tailored to Specified Regions or Segments
  • Company Profiles Customized to User Preferences
  • Comprehensive Insights Focused on Specific Segments or Regions
  • Customized Evaluation of Competitive Landscape to Meet Your Needs
  • Tailored Customization to Address Other Specific Requirements
Ask for customization


Key Insights

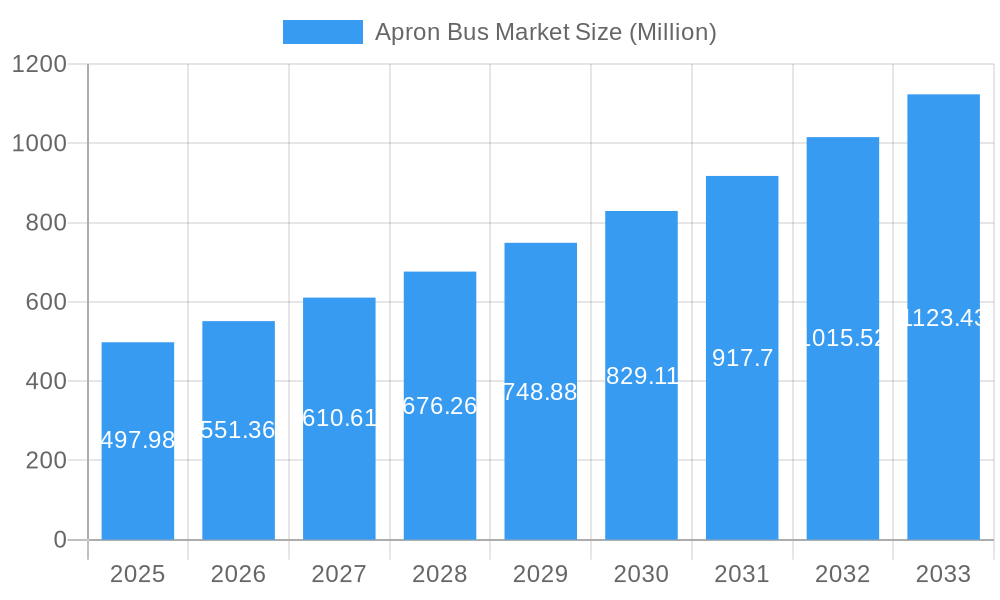
The global apron bus market, valued at $497.98 million in 2025, is projected to experience robust growth, driven by increasing air passenger traffic and the expansion of airport infrastructure globally. The market's Compound Annual Growth Rate (CAGR) of 10.77% from 2025 to 2033 indicates significant market expansion over the forecast period. Key drivers include the rising demand for efficient passenger transportation within airports, stringent regulations regarding passenger safety and comfort, and a growing preference for electric and hybrid apron buses due to environmental concerns and operational cost savings. Technological advancements, such as the integration of advanced passenger information systems and improved safety features, are further fueling market growth. However, the market faces challenges like high initial investment costs for electric vehicles and the need for specialized infrastructure for their operation. Segmentation by fuel type (electric and diesel) reveals a growing preference for electric buses, reflecting the global shift towards sustainable transportation. Major players like Proterra Inc, Ashok Leyland, BYD Company Ltd, and Volvo Group are actively shaping the market through technological innovation and strategic partnerships. Regional analysis shows strong growth potential in Asia-Pacific and North America, driven by significant airport expansion and modernization projects in these regions. The market is expected to witness further consolidation, with larger players acquiring smaller companies to expand their market share and product portfolio.
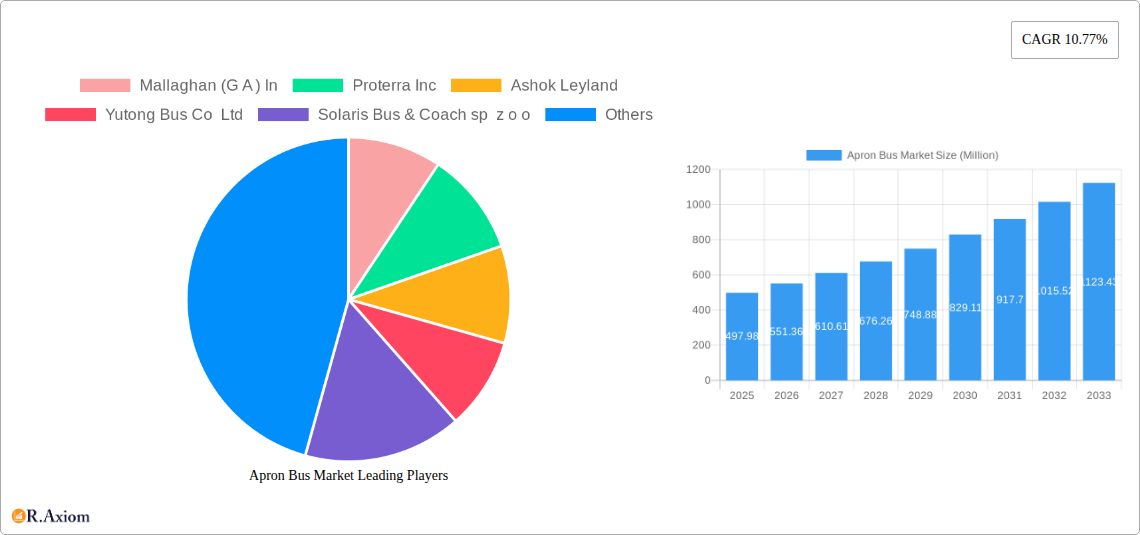
The competitive landscape is characterized by a mix of established manufacturers and emerging players, leading to increased innovation and price competition. The market's future growth hinges on continuous technological improvements, supportive government policies promoting sustainable transportation, and the ability of manufacturers to adapt to evolving passenger needs and environmental regulations. The forecast period (2025-2033) presents substantial opportunities for companies offering technologically advanced, eco-friendly, and cost-effective apron bus solutions. Strategic alliances and investments in research and development will be crucial for sustained success in this rapidly evolving market.

This in-depth report provides a comprehensive analysis of the global Apron Bus Market, offering invaluable insights for industry stakeholders, investors, and strategic decision-makers. The study period covers 2019-2033, with 2025 serving as the base and estimated year. The report meticulously analyzes market trends, competitive dynamics, and future growth potential, incorporating detailed segmentation by type (Electric and Diesel). The report is crucial for understanding the market's current state and anticipating its future trajectory. This detailed analysis incorporates extensive market sizing, forecasts, and a granular competitive landscape. The global Apron Bus Market is projected to reach xx Million by 2033, exhibiting a CAGR of xx% during the forecast period (2025-2033).

Apron Bus Market Research Report - Market Size, Growth & Forecast

Apron Bus Market Concentration & Innovation

This section analyzes the market concentration, innovation drivers, regulatory landscape, and competitive activities within the apron bus market. The market exhibits a moderately concentrated structure, with key players holding significant market share. However, the emergence of new entrants with innovative technologies is gradually altering the landscape.

  • Market Share: The top five players account for approximately xx% of the global market share in 2025. Precise market share figures for each company are available in the full report.
  • Innovation Drivers: Stringent emission regulations, coupled with the aviation industry's push for sustainability, are driving innovation in electric apron buses. Technological advancements in battery technology, charging infrastructure, and autonomous driving systems are key factors.
  • Regulatory Frameworks: Government regulations concerning emissions and safety standards significantly influence market dynamics. These regulations vary across regions, creating both opportunities and challenges for manufacturers.
  • Product Substitutes: While apron buses are specialized vehicles, alternative solutions like smaller shuttle buses or autonomous vehicles are emerging as potential substitutes, particularly for smaller airports.
  • End-User Trends: Airports are increasingly prioritizing sustainability and operational efficiency. This trend fuels the demand for efficient and environmentally friendly apron buses.
  • M&A Activities: The apron bus market has witnessed a moderate level of M&A activity in recent years. Deal values have ranged from xx Million to xx Million, primarily driven by strategic expansions and technological acquisitions. Details of significant M&A deals are included in the full report.

Apron Bus Market Industry Trends & Insights

The global apron bus market is experiencing robust growth driven by factors such as the increasing passenger traffic at airports worldwide, stringent environmental regulations, and the rising adoption of electric vehicles. The market is witnessing a significant shift towards electric apron buses owing to their environmental benefits and cost-effectiveness in the long run. Technological advancements in battery technology and charging infrastructure are further accelerating the adoption rate. Furthermore, the growing focus on improving airport operations and optimizing passenger experience contributes to the market's expansion. The increasing demand for comfortable and safe passenger transport within airport premises is driving the adoption of advanced features and technologies in apron buses. The competitive landscape is characterized by the presence of both established players and emerging companies specializing in electric and alternative fuel technologies. This creates intense competition, resulting in continuous innovation and product differentiation. The market is projected to witness a substantial increase in market penetration of electric apron buses over the coming years.

Apron Bus Market Growth

Dominant Markets & Segments in Apron Bus Market

The report identifies key regions, countries, and segments exhibiting significant growth within the apron bus market. North America and Europe are currently the dominant regions, driven by strong environmental regulations, technological advancements, and a high concentration of major airports. However, the Asia-Pacific region is emerging as a significant growth market, fueled by rapid airport infrastructure development and increasing passenger traffic.

  • Electric Segment: This segment holds significant growth potential, propelled by rising environmental concerns and government incentives for electric vehicle adoption. Key drivers include:

    • Stringent emission regulations in major regions.
    • Government subsidies and tax breaks promoting electric vehicle adoption.
    • Technological advancements in battery technology and charging infrastructure.
    • Growing awareness of environmental sustainability among airports and airlines.
  • Diesel Segment: While the diesel segment currently holds a larger market share, its growth is expected to decelerate due to increasing environmental restrictions and the rising popularity of electric vehicles.

  • Regional Dominance: North America and Europe lead in adoption due to established infrastructure, stringent emission norms, and higher purchasing power. However, the Asia-Pacific region is projected to experience the fastest growth due to rapid infrastructure development and a growing number of airports.

Apron Bus Market Product Developments

Recent product developments in the apron bus market are mainly focused on enhancing efficiency, sustainability, and passenger comfort. Manufacturers are incorporating advanced technologies such as electric powertrains, regenerative braking systems, and improved safety features. The focus on electric vehicles is prominent, with manufacturers constantly striving to improve battery range, charging times, and overall performance. These innovations are tailored to meet the growing demand for environmentally friendly and technologically advanced apron buses.

Report Scope & Segmentation Analysis

This report segments the apron bus market based on the type of fuel used: Electric and Diesel.

  • Electric Apron Buses: This segment is projected to witness significant growth, driven by the increasing adoption of electric vehicles globally and the stringent emission regulations imposed on airport vehicles. Market size and competitive dynamics within this segment are detailed in the full report.

  • Diesel Apron Buses: While this segment currently holds a larger market share, its growth is anticipated to decelerate due to growing environmental concerns and the increasing popularity of electric alternatives. Market size and competitive dynamics within this segment are also detailed in the full report.

Key Drivers of Apron Bus Market Growth

Several factors are driving growth in the apron bus market:

  • Stringent Emission Regulations: Governments worldwide are imposing stricter emission standards, pushing the adoption of cleaner transportation solutions like electric apron buses.
  • Rising Airport Passenger Traffic: The increasing number of air travelers globally fuels the demand for efficient passenger transport within airport facilities.
  • Technological Advancements: Innovations in battery technology, charging infrastructure, and autonomous driving systems are making electric apron buses more viable and appealing.
  • Focus on Sustainability: Airlines and airports are increasingly prioritizing environmental sustainability, leading to the adoption of eco-friendly vehicles.

Challenges in the Apron Bus Market Sector

The apron bus market faces several challenges:

  • High Initial Investment Costs: Electric apron buses have significantly higher upfront costs compared to diesel counterparts, posing a barrier to adoption for some operators.
  • Limited Charging Infrastructure: The lack of widespread charging infrastructure in some regions can hinder the adoption of electric apron buses.
  • Range Anxiety: Concerns regarding the range of electric apron buses, particularly in large airports, could affect their adoption.
  • Competition: Intense competition among established and emerging players can put pressure on pricing and profitability.

Emerging Opportunities in Apron Bus Market

Several emerging opportunities exist within the apron bus market:

  • Autonomous Driving Technology: The integration of autonomous driving features can further improve efficiency and reduce operational costs.
  • Expansion in Emerging Markets: Developing countries with growing air travel demand offer substantial growth potential.
  • Hybrid Technology: Hybrid apron buses could provide a cost-effective transition path towards cleaner transportation solutions.
  • Service and Maintenance Contracts: Offering comprehensive service and maintenance packages can increase revenue streams for manufacturers.

Leading Players in the Apron Bus Market Market

  • Mallaghan (G A ) In
  • Proterra Inc
  • Ashok Leyland
  • Yutong Bus Co Ltd
  • Solaris Bus & Coach sp z o o
  • Xiamen King Long International Trading Co Ltd
  • TAM - EUROPE
  • AB Volvo (Volvo Group)
  • COBUS Industries GmbH
  • BYD Company Ltd
  • Xinfa Airport Equipment Ltd

Key Developments in Apron Bus Market Industry

  • July 2023: Busnex launched the 'DinoBus', a fully electric airport apron bus with a range of up to 150 km and capacity for 120 passengers. This launch highlights the industry's focus on decarbonization.
  • August 2023: LSP Plus Corporation secured a five-year contract for parking and shuttle operations at Eppley Airport (OMA), potentially influencing the demand for apron buses in the US market.

Strategic Outlook for Apron Bus Market Market

The apron bus market is poised for significant growth, driven by increasing passenger numbers, stringent environmental regulations, and technological advancements. The shift towards electric vehicles presents immense opportunities for manufacturers, while addressing challenges related to initial investment costs and infrastructure development will be crucial for sustained market expansion. The focus on sustainability, coupled with innovations in autonomous driving technologies, will further shape the market's future trajectory.

Apron Bus Market Segmentation

  • 1. Production Analysis
  • 2. Consumption Analysis
  • 3. Import Market Analysis (Value & Volume)
  • 4. Export Market Analysis (Value & Volume)
  • 5. Price Trend Analysis

Apron Bus Market Segmentation By Geography

  • 1. North America
    • 1.1. United States
    • 1.2. Canada
    • 1.3. Mexico
  • 2. South America
    • 2.1. Brazil
    • 2.2. Argentina
    • 2.3. Rest of South America
  • 3. Europe
    • 3.1. United Kingdom
    • 3.2. Germany
    • 3.3. France
    • 3.4. Italy
    • 3.5. Spain
    • 3.6. Russia
    • 3.7. Benelux
    • 3.8. Nordics
    • 3.9. Rest of Europe
  • 4. Middle East & Africa
    • 4.1. Turkey
    • 4.2. Israel
    • 4.3. GCC
    • 4.4. North Africa
    • 4.5. South Africa
    • 4.6. Rest of Middle East & Africa
  • 5. Asia Pacific
    • 5.1. China
    • 5.2. India
    • 5.3. Japan
    • 5.4. South Korea
    • 5.5. ASEAN
    • 5.6. Oceania
    • 5.7. Rest of Asia Pacific
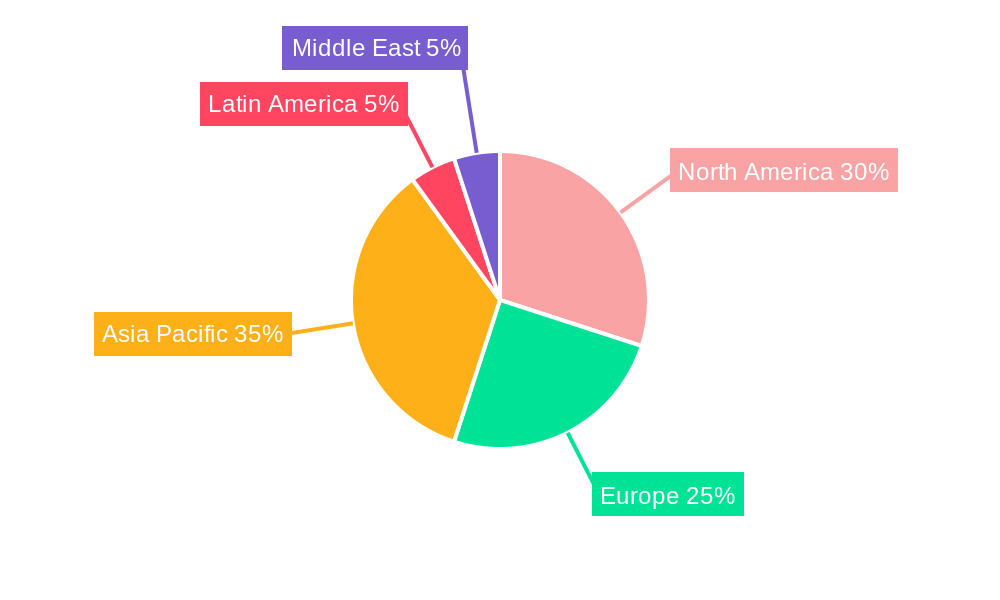
Apron Bus Market Regional Share


Apron Bus Market REPORT HIGHLIGHTS

AspectsDetails
Study Period 2019-2033
Base Year 2024
Estimated Year 2025
Forecast Period2025-2033
Historical Period2019-2024
Growth RateCAGR of 10.77% from 2019-2033
Segmentation
    • By Production Analysis
    • By Consumption Analysis
    • By Import Market Analysis (Value & Volume)
    • By Export Market Analysis (Value & Volume)
    • By Price Trend Analysis
  • By Geography
    • North America
      • United States
      • Canada
      • Mexico
    • South America
      • Brazil
      • Argentina
      • Rest of South America
    • Europe
      • United Kingdom
      • Germany
      • France
      • Italy
      • Spain
      • Russia
      • Benelux
      • Nordics
      • Rest of Europe
    • Middle East & Africa
      • Turkey
      • Israel
      • GCC
      • North Africa
      • South Africa
      • Rest of Middle East & Africa
    • Asia Pacific
      • China
      • India
      • Japan
      • South Korea
      • ASEAN
      • Oceania
      • Rest of Asia Pacific


Table of Contents

  1. 1. Introduction
    • 1.1. Research Scope
    • 1.2. Market Segmentation
    • 1.3. Research Methodology
    • 1.4. Definitions and Assumptions
  2. 2. Executive Summary
    • 2.1. Introduction
  3. 3. Market Dynamics
    • 3.1. Introduction
      • 3.2. Market Drivers
        • 3.2.1. Increase in Internet of Things (IoT) and Autonomous Systems; Rise in Demand for Military and Defense Satellite Communication Solutions
      • 3.3. Market Restrains
        • 3.3.1. Cybersecurity Threats to Satellite Communication; Interference in Transmission of Data
      • 3.4. Market Trends
        • 3.4.1. Electric Segment is Expected to Show Significant Growth During the Forecast Period
  4. 4. Market Factor Analysis
    • 4.1. Porters Five Forces
    • 4.2. Supply/Value Chain
    • 4.3. PESTEL analysis
    • 4.4. Market Entropy
    • 4.5. Patent/Trademark Analysis
  5. 5. Global Apron Bus Market Analysis, Insights and Forecast, 2019-2031
    • 5.1. Market Analysis, Insights and Forecast - by Production Analysis
      • 5.2. Market Analysis, Insights and Forecast - by Consumption Analysis
        • 5.3. Market Analysis, Insights and Forecast - by Import Market Analysis (Value & Volume)
          • 5.4. Market Analysis, Insights and Forecast - by Export Market Analysis (Value & Volume)
            • 5.5. Market Analysis, Insights and Forecast - by Price Trend Analysis
              • 5.6. Market Analysis, Insights and Forecast - by Region
                • 5.6.1. North America
                • 5.6.2. South America
                • 5.6.3. Europe
                • 5.6.4. Middle East & Africa
                • 5.6.5. Asia Pacific
            • 6. North America Apron Bus Market Analysis, Insights and Forecast, 2019-2031
              • 6.1. Market Analysis, Insights and Forecast - by Production Analysis
                • 6.2. Market Analysis, Insights and Forecast - by Consumption Analysis
                  • 6.3. Market Analysis, Insights and Forecast - by Import Market Analysis (Value & Volume)
                    • 6.4. Market Analysis, Insights and Forecast - by Export Market Analysis (Value & Volume)
                      • 6.5. Market Analysis, Insights and Forecast - by Price Trend Analysis
                      • 7. South America Apron Bus Market Analysis, Insights and Forecast, 2019-2031
                        • 7.1. Market Analysis, Insights and Forecast - by Production Analysis
                          • 7.2. Market Analysis, Insights and Forecast - by Consumption Analysis
                            • 7.3. Market Analysis, Insights and Forecast - by Import Market Analysis (Value & Volume)
                              • 7.4. Market Analysis, Insights and Forecast - by Export Market Analysis (Value & Volume)
                                • 7.5. Market Analysis, Insights and Forecast - by Price Trend Analysis
                                • 8. Europe Apron Bus Market Analysis, Insights and Forecast, 2019-2031
                                  • 8.1. Market Analysis, Insights and Forecast - by Production Analysis
                                    • 8.2. Market Analysis, Insights and Forecast - by Consumption Analysis
                                      • 8.3. Market Analysis, Insights and Forecast - by Import Market Analysis (Value & Volume)
                                        • 8.4. Market Analysis, Insights and Forecast - by Export Market Analysis (Value & Volume)
                                          • 8.5. Market Analysis, Insights and Forecast - by Price Trend Analysis
                                          • 9. Middle East & Africa Apron Bus Market Analysis, Insights and Forecast, 2019-2031
                                            • 9.1. Market Analysis, Insights and Forecast - by Production Analysis
                                              • 9.2. Market Analysis, Insights and Forecast - by Consumption Analysis
                                                • 9.3. Market Analysis, Insights and Forecast - by Import Market Analysis (Value & Volume)
                                                  • 9.4. Market Analysis, Insights and Forecast - by Export Market Analysis (Value & Volume)
                                                    • 9.5. Market Analysis, Insights and Forecast - by Price Trend Analysis
                                                    • 10. Asia Pacific Apron Bus Market Analysis, Insights and Forecast, 2019-2031
                                                      • 10.1. Market Analysis, Insights and Forecast - by Production Analysis
                                                        • 10.2. Market Analysis, Insights and Forecast - by Consumption Analysis
                                                          • 10.3. Market Analysis, Insights and Forecast - by Import Market Analysis (Value & Volume)
                                                            • 10.4. Market Analysis, Insights and Forecast - by Export Market Analysis (Value & Volume)
                                                              • 10.5. Market Analysis, Insights and Forecast - by Price Trend Analysis
                                                              • 11. North America Apron Bus Market Analysis, Insights and Forecast, 2019-2031
                                                                  • 11.1. Market Analysis, Insights and Forecast - By Country/Sub-region
                                                                    • 11.1.1 United States
                                                                    • 11.1.2 Canada
                                                              • 12. Europe Apron Bus Market Analysis, Insights and Forecast, 2019-2031
                                                                  • 12.1. Market Analysis, Insights and Forecast - By Country/Sub-region
                                                                    • 12.1.1 United Kingdom
                                                                    • 12.1.2 Germany
                                                                    • 12.1.3 France
                                                                    • 12.1.4 Italy
                                                                    • 12.1.5 Russia
                                                                    • 12.1.6 Rest of Europe
                                                              • 13. Asia Pacific Apron Bus Market Analysis, Insights and Forecast, 2019-2031
                                                                  • 13.1. Market Analysis, Insights and Forecast - By Country/Sub-region
                                                                    • 13.1.1 China
                                                                    • 13.1.2 India
                                                                    • 13.1.3 Japan
                                                                    • 13.1.4 South Korea
                                                                    • 13.1.5 Australia
                                                                    • 13.1.6 Rest of Asia Pacific
                                                              • 14. Latin America Apron Bus Market Analysis, Insights and Forecast, 2019-2031
                                                                  • 14.1. Market Analysis, Insights and Forecast - By Country/Sub-region
                                                                    • 14.1.1 Brazil
                                                                    • 14.1.2 Mexico
                                                                    • 14.1.3 Rest of Latin America
                                                              • 15. Middle East Apron Bus Market Analysis, Insights and Forecast, 2019-2031
                                                                  • 15.1. Market Analysis, Insights and Forecast - By Country/Sub-region
                                                                    • 15.1.1.
                                                              • 16. United Arab Emirates Apron Bus Market Analysis, Insights and Forecast, 2019-2031
                                                                  • 16.1. Market Analysis, Insights and Forecast - By Country/Sub-region
                                                                    • 16.1.1 Saudi Arabia
                                                                    • 16.1.2 Egypt
                                                                    • 16.1.3 South Africa
                                                                    • 16.1.4 Rest of Middle East
                                                              • 17. Competitive Analysis
                                                                • 17.1. Global Market Share Analysis 2024
                                                                  • 17.2. Company Profiles
                                                                    • 17.2.1 Mallaghan (G A ) In
                                                                      • 17.2.1.1. Overview
                                                                      • 17.2.1.2. Products
                                                                      • 17.2.1.3. SWOT Analysis
                                                                      • 17.2.1.4. Recent Developments
                                                                      • 17.2.1.5. Financials (Based on Availability)
                                                                    • 17.2.2 Proterra Inc
                                                                      • 17.2.2.1. Overview
                                                                      • 17.2.2.2. Products
                                                                      • 17.2.2.3. SWOT Analysis
                                                                      • 17.2.2.4. Recent Developments
                                                                      • 17.2.2.5. Financials (Based on Availability)
                                                                    • 17.2.3 Ashok Leyland
                                                                      • 17.2.3.1. Overview
                                                                      • 17.2.3.2. Products
                                                                      • 17.2.3.3. SWOT Analysis
                                                                      • 17.2.3.4. Recent Developments
                                                                      • 17.2.3.5. Financials (Based on Availability)
                                                                    • 17.2.4 Yutong Bus Co Ltd
                                                                      • 17.2.4.1. Overview
                                                                      • 17.2.4.2. Products
                                                                      • 17.2.4.3. SWOT Analysis
                                                                      • 17.2.4.4. Recent Developments
                                                                      • 17.2.4.5. Financials (Based on Availability)
                                                                    • 17.2.5 Solaris Bus & Coach sp z o o
                                                                      • 17.2.5.1. Overview
                                                                      • 17.2.5.2. Products
                                                                      • 17.2.5.3. SWOT Analysis
                                                                      • 17.2.5.4. Recent Developments
                                                                      • 17.2.5.5. Financials (Based on Availability)
                                                                    • 17.2.6 Xiamen King Long International Trading Co Ltd
                                                                      • 17.2.6.1. Overview
                                                                      • 17.2.6.2. Products
                                                                      • 17.2.6.3. SWOT Analysis
                                                                      • 17.2.6.4. Recent Developments
                                                                      • 17.2.6.5. Financials (Based on Availability)
                                                                    • 17.2.7 TAM - EUROPE
                                                                      • 17.2.7.1. Overview
                                                                      • 17.2.7.2. Products
                                                                      • 17.2.7.3. SWOT Analysis
                                                                      • 17.2.7.4. Recent Developments
                                                                      • 17.2.7.5. Financials (Based on Availability)
                                                                    • 17.2.8 AB Volvo (Volvo Group)
                                                                      • 17.2.8.1. Overview
                                                                      • 17.2.8.2. Products
                                                                      • 17.2.8.3. SWOT Analysis
                                                                      • 17.2.8.4. Recent Developments
                                                                      • 17.2.8.5. Financials (Based on Availability)
                                                                    • 17.2.9 COBUS Industries GmbH
                                                                      • 17.2.9.1. Overview
                                                                      • 17.2.9.2. Products
                                                                      • 17.2.9.3. SWOT Analysis
                                                                      • 17.2.9.4. Recent Developments
                                                                      • 17.2.9.5. Financials (Based on Availability)
                                                                    • 17.2.10 BYD Company Ltd
                                                                      • 17.2.10.1. Overview
                                                                      • 17.2.10.2. Products
                                                                      • 17.2.10.3. SWOT Analysis
                                                                      • 17.2.10.4. Recent Developments
                                                                      • 17.2.10.5. Financials (Based on Availability)
                                                                    • 17.2.11 Xinfa Airport Equipment Ltd
                                                                      • 17.2.11.1. Overview
                                                                      • 17.2.11.2. Products
                                                                      • 17.2.11.3. SWOT Analysis
                                                                      • 17.2.11.4. Recent Developments
                                                                      • 17.2.11.5. Financials (Based on Availability)

                                                              List of Figures

                                                              1. Figure 1: Global Apron Bus Market Revenue Breakdown (Million, %) by Region 2024 & 2032
                                                              2. Figure 2: North America Apron Bus Market Revenue (Million), by Country 2024 & 2032
                                                              3. Figure 3: North America Apron Bus Market Revenue Share (%), by Country 2024 & 2032
                                                              4. Figure 4: Europe Apron Bus Market Revenue (Million), by Country 2024 & 2032
                                                              5. Figure 5: Europe Apron Bus Market Revenue Share (%), by Country 2024 & 2032
                                                              6. Figure 6: Asia Pacific Apron Bus Market Revenue (Million), by Country 2024 & 2032
                                                              7. Figure 7: Asia Pacific Apron Bus Market Revenue Share (%), by Country 2024 & 2032
                                                              8. Figure 8: Latin America Apron Bus Market Revenue (Million), by Country 2024 & 2032
                                                              9. Figure 9: Latin America Apron Bus Market Revenue Share (%), by Country 2024 & 2032
                                                              10. Figure 10: Middle East Apron Bus Market Revenue (Million), by Country 2024 & 2032
                                                              11. Figure 11: Middle East Apron Bus Market Revenue Share (%), by Country 2024 & 2032
                                                              12. Figure 12: United Arab Emirates Apron Bus Market Revenue (Million), by Country 2024 & 2032
                                                              13. Figure 13: United Arab Emirates Apron Bus Market Revenue Share (%), by Country 2024 & 2032
                                                              14. Figure 14: North America Apron Bus Market Revenue (Million), by Production Analysis 2024 & 2032
                                                              15. Figure 15: North America Apron Bus Market Revenue Share (%), by Production Analysis 2024 & 2032
                                                              16. Figure 16: North America Apron Bus Market Revenue (Million), by Consumption Analysis 2024 & 2032
                                                              17. Figure 17: North America Apron Bus Market Revenue Share (%), by Consumption Analysis 2024 & 2032
                                                              18. Figure 18: North America Apron Bus Market Revenue (Million), by Import Market Analysis (Value & Volume) 2024 & 2032
                                                              19. Figure 19: North America Apron Bus Market Revenue Share (%), by Import Market Analysis (Value & Volume) 2024 & 2032
                                                              20. Figure 20: North America Apron Bus Market Revenue (Million), by Export Market Analysis (Value & Volume) 2024 & 2032
                                                              21. Figure 21: North America Apron Bus Market Revenue Share (%), by Export Market Analysis (Value & Volume) 2024 & 2032
                                                              22. Figure 22: North America Apron Bus Market Revenue (Million), by Price Trend Analysis 2024 & 2032
                                                              23. Figure 23: North America Apron Bus Market Revenue Share (%), by Price Trend Analysis 2024 & 2032
                                                              24. Figure 24: North America Apron Bus Market Revenue (Million), by Country 2024 & 2032
                                                              25. Figure 25: North America Apron Bus Market Revenue Share (%), by Country 2024 & 2032
                                                              26. Figure 26: South America Apron Bus Market Revenue (Million), by Production Analysis 2024 & 2032
                                                              27. Figure 27: South America Apron Bus Market Revenue Share (%), by Production Analysis 2024 & 2032
                                                              28. Figure 28: South America Apron Bus Market Revenue (Million), by Consumption Analysis 2024 & 2032
                                                              29. Figure 29: South America Apron Bus Market Revenue Share (%), by Consumption Analysis 2024 & 2032
                                                              30. Figure 30: South America Apron Bus Market Revenue (Million), by Import Market Analysis (Value & Volume) 2024 & 2032
                                                              31. Figure 31: South America Apron Bus Market Revenue Share (%), by Import Market Analysis (Value & Volume) 2024 & 2032
                                                              32. Figure 32: South America Apron Bus Market Revenue (Million), by Export Market Analysis (Value & Volume) 2024 & 2032
                                                              33. Figure 33: South America Apron Bus Market Revenue Share (%), by Export Market Analysis (Value & Volume) 2024 & 2032
                                                              34. Figure 34: South America Apron Bus Market Revenue (Million), by Price Trend Analysis 2024 & 2032
                                                              35. Figure 35: South America Apron Bus Market Revenue Share (%), by Price Trend Analysis 2024 & 2032
                                                              36. Figure 36: South America Apron Bus Market Revenue (Million), by Country 2024 & 2032
                                                              37. Figure 37: South America Apron Bus Market Revenue Share (%), by Country 2024 & 2032
                                                              38. Figure 38: Europe Apron Bus Market Revenue (Million), by Production Analysis 2024 & 2032
                                                              39. Figure 39: Europe Apron Bus Market Revenue Share (%), by Production Analysis 2024 & 2032
                                                              40. Figure 40: Europe Apron Bus Market Revenue (Million), by Consumption Analysis 2024 & 2032
                                                              41. Figure 41: Europe Apron Bus Market Revenue Share (%), by Consumption Analysis 2024 & 2032
                                                              42. Figure 42: Europe Apron Bus Market Revenue (Million), by Import Market Analysis (Value & Volume) 2024 & 2032
                                                              43. Figure 43: Europe Apron Bus Market Revenue Share (%), by Import Market Analysis (Value & Volume) 2024 & 2032
                                                              44. Figure 44: Europe Apron Bus Market Revenue (Million), by Export Market Analysis (Value & Volume) 2024 & 2032
                                                              45. Figure 45: Europe Apron Bus Market Revenue Share (%), by Export Market Analysis (Value & Volume) 2024 & 2032
                                                              46. Figure 46: Europe Apron Bus Market Revenue (Million), by Price Trend Analysis 2024 & 2032
                                                              47. Figure 47: Europe Apron Bus Market Revenue Share (%), by Price Trend Analysis 2024 & 2032
                                                              48. Figure 48: Europe Apron Bus Market Revenue (Million), by Country 2024 & 2032
                                                              49. Figure 49: Europe Apron Bus Market Revenue Share (%), by Country 2024 & 2032
                                                              50. Figure 50: Middle East & Africa Apron Bus Market Revenue (Million), by Production Analysis 2024 & 2032
                                                              51. Figure 51: Middle East & Africa Apron Bus Market Revenue Share (%), by Production Analysis 2024 & 2032
                                                              52. Figure 52: Middle East & Africa Apron Bus Market Revenue (Million), by Consumption Analysis 2024 & 2032
                                                              53. Figure 53: Middle East & Africa Apron Bus Market Revenue Share (%), by Consumption Analysis 2024 & 2032
                                                              54. Figure 54: Middle East & Africa Apron Bus Market Revenue (Million), by Import Market Analysis (Value & Volume) 2024 & 2032
                                                              55. Figure 55: Middle East & Africa Apron Bus Market Revenue Share (%), by Import Market Analysis (Value & Volume) 2024 & 2032
                                                              56. Figure 56: Middle East & Africa Apron Bus Market Revenue (Million), by Export Market Analysis (Value & Volume) 2024 & 2032
                                                              57. Figure 57: Middle East & Africa Apron Bus Market Revenue Share (%), by Export Market Analysis (Value & Volume) 2024 & 2032
                                                              58. Figure 58: Middle East & Africa Apron Bus Market Revenue (Million), by Price Trend Analysis 2024 & 2032
                                                              59. Figure 59: Middle East & Africa Apron Bus Market Revenue Share (%), by Price Trend Analysis 2024 & 2032
                                                              60. Figure 60: Middle East & Africa Apron Bus Market Revenue (Million), by Country 2024 & 2032
                                                              61. Figure 61: Middle East & Africa Apron Bus Market Revenue Share (%), by Country 2024 & 2032
                                                              62. Figure 62: Asia Pacific Apron Bus Market Revenue (Million), by Production Analysis 2024 & 2032
                                                              63. Figure 63: Asia Pacific Apron Bus Market Revenue Share (%), by Production Analysis 2024 & 2032
                                                              64. Figure 64: Asia Pacific Apron Bus Market Revenue (Million), by Consumption Analysis 2024 & 2032
                                                              65. Figure 65: Asia Pacific Apron Bus Market Revenue Share (%), by Consumption Analysis 2024 & 2032
                                                              66. Figure 66: Asia Pacific Apron Bus Market Revenue (Million), by Import Market Analysis (Value & Volume) 2024 & 2032
                                                              67. Figure 67: Asia Pacific Apron Bus Market Revenue Share (%), by Import Market Analysis (Value & Volume) 2024 & 2032
                                                              68. Figure 68: Asia Pacific Apron Bus Market Revenue (Million), by Export Market Analysis (Value & Volume) 2024 & 2032
                                                              69. Figure 69: Asia Pacific Apron Bus Market Revenue Share (%), by Export Market Analysis (Value & Volume) 2024 & 2032
                                                              70. Figure 70: Asia Pacific Apron Bus Market Revenue (Million), by Price Trend Analysis 2024 & 2032
                                                              71. Figure 71: Asia Pacific Apron Bus Market Revenue Share (%), by Price Trend Analysis 2024 & 2032
                                                              72. Figure 72: Asia Pacific Apron Bus Market Revenue (Million), by Country 2024 & 2032
                                                              73. Figure 73: Asia Pacific Apron Bus Market Revenue Share (%), by Country 2024 & 2032

                                                              List of Tables

                                                              1. Table 1: Global Apron Bus Market Revenue Million Forecast, by Region 2019 & 2032
                                                              2. Table 2: Global Apron Bus Market Revenue Million Forecast, by Production Analysis 2019 & 2032
                                                              3. Table 3: Global Apron Bus Market Revenue Million Forecast, by Consumption Analysis 2019 & 2032
                                                              4. Table 4: Global Apron Bus Market Revenue Million Forecast, by Import Market Analysis (Value & Volume) 2019 & 2032
                                                              5. Table 5: Global Apron Bus Market Revenue Million Forecast, by Export Market Analysis (Value & Volume) 2019 & 2032
                                                              6. Table 6: Global Apron Bus Market Revenue Million Forecast, by Price Trend Analysis 2019 & 2032
                                                              7. Table 7: Global Apron Bus Market Revenue Million Forecast, by Region 2019 & 2032
                                                              8. Table 8: Global Apron Bus Market Revenue Million Forecast, by Country 2019 & 2032
                                                              9. Table 9: United States Apron Bus Market Revenue (Million) Forecast, by Application 2019 & 2032
                                                              10. Table 10: Canada Apron Bus Market Revenue (Million) Forecast, by Application 2019 & 2032
                                                              11. Table 11: Global Apron Bus Market Revenue Million Forecast, by Country 2019 & 2032
                                                              12. Table 12: United Kingdom Apron Bus Market Revenue (Million) Forecast, by Application 2019 & 2032
                                                              13. Table 13: Germany Apron Bus Market Revenue (Million) Forecast, by Application 2019 & 2032
                                                              14. Table 14: France Apron Bus Market Revenue (Million) Forecast, by Application 2019 & 2032
                                                              15. Table 15: Italy Apron Bus Market Revenue (Million) Forecast, by Application 2019 & 2032
                                                              16. Table 16: Russia Apron Bus Market Revenue (Million) Forecast, by Application 2019 & 2032
                                                              17. Table 17: Rest of Europe Apron Bus Market Revenue (Million) Forecast, by Application 2019 & 2032
                                                              18. Table 18: Global Apron Bus Market Revenue Million Forecast, by Country 2019 & 2032
                                                              19. Table 19: China Apron Bus Market Revenue (Million) Forecast, by Application 2019 & 2032
                                                              20. Table 20: India Apron Bus Market Revenue (Million) Forecast, by Application 2019 & 2032
                                                              21. Table 21: Japan Apron Bus Market Revenue (Million) Forecast, by Application 2019 & 2032
                                                              22. Table 22: South Korea Apron Bus Market Revenue (Million) Forecast, by Application 2019 & 2032
                                                              23. Table 23: Australia Apron Bus Market Revenue (Million) Forecast, by Application 2019 & 2032
                                                              24. Table 24: Rest of Asia Pacific Apron Bus Market Revenue (Million) Forecast, by Application 2019 & 2032
                                                              25. Table 25: Global Apron Bus Market Revenue Million Forecast, by Country 2019 & 2032
                                                              26. Table 26: Brazil Apron Bus Market Revenue (Million) Forecast, by Application 2019 & 2032
                                                              27. Table 27: Mexico Apron Bus Market Revenue (Million) Forecast, by Application 2019 & 2032
                                                              28. Table 28: Rest of Latin America Apron Bus Market Revenue (Million) Forecast, by Application 2019 & 2032
                                                              29. Table 29: Global Apron Bus Market Revenue Million Forecast, by Country 2019 & 2032
                                                              30. Table 30: Apron Bus Market Revenue (Million) Forecast, by Application 2019 & 2032
                                                              31. Table 31: Global Apron Bus Market Revenue Million Forecast, by Country 2019 & 2032
                                                              32. Table 32: Saudi Arabia Apron Bus Market Revenue (Million) Forecast, by Application 2019 & 2032
                                                              33. Table 33: Egypt Apron Bus Market Revenue (Million) Forecast, by Application 2019 & 2032
                                                              34. Table 34: South Africa Apron Bus Market Revenue (Million) Forecast, by Application 2019 & 2032
                                                              35. Table 35: Rest of Middle East Apron Bus Market Revenue (Million) Forecast, by Application 2019 & 2032
                                                              36. Table 36: Global Apron Bus Market Revenue Million Forecast, by Production Analysis 2019 & 2032
                                                              37. Table 37: Global Apron Bus Market Revenue Million Forecast, by Consumption Analysis 2019 & 2032
                                                              38. Table 38: Global Apron Bus Market Revenue Million Forecast, by Import Market Analysis (Value & Volume) 2019 & 2032
                                                              39. Table 39: Global Apron Bus Market Revenue Million Forecast, by Export Market Analysis (Value & Volume) 2019 & 2032
                                                              40. Table 40: Global Apron Bus Market Revenue Million Forecast, by Price Trend Analysis 2019 & 2032
                                                              41. Table 41: Global Apron Bus Market Revenue Million Forecast, by Country 2019 & 2032
                                                              42. Table 42: United States Apron Bus Market Revenue (Million) Forecast, by Application 2019 & 2032
                                                              43. Table 43: Canada Apron Bus Market Revenue (Million) Forecast, by Application 2019 & 2032
                                                              44. Table 44: Mexico Apron Bus Market Revenue (Million) Forecast, by Application 2019 & 2032
                                                              45. Table 45: Global Apron Bus Market Revenue Million Forecast, by Production Analysis 2019 & 2032
                                                              46. Table 46: Global Apron Bus Market Revenue Million Forecast, by Consumption Analysis 2019 & 2032
                                                              47. Table 47: Global Apron Bus Market Revenue Million Forecast, by Import Market Analysis (Value & Volume) 2019 & 2032
                                                              48. Table 48: Global Apron Bus Market Revenue Million Forecast, by Export Market Analysis (Value & Volume) 2019 & 2032
                                                              49. Table 49: Global Apron Bus Market Revenue Million Forecast, by Price Trend Analysis 2019 & 2032
                                                              50. Table 50: Global Apron Bus Market Revenue Million Forecast, by Country 2019 & 2032
                                                              51. Table 51: Brazil Apron Bus Market Revenue (Million) Forecast, by Application 2019 & 2032
                                                              52. Table 52: Argentina Apron Bus Market Revenue (Million) Forecast, by Application 2019 & 2032
                                                              53. Table 53: Rest of South America Apron Bus Market Revenue (Million) Forecast, by Application 2019 & 2032
                                                              54. Table 54: Global Apron Bus Market Revenue Million Forecast, by Production Analysis 2019 & 2032
                                                              55. Table 55: Global Apron Bus Market Revenue Million Forecast, by Consumption Analysis 2019 & 2032
                                                              56. Table 56: Global Apron Bus Market Revenue Million Forecast, by Import Market Analysis (Value & Volume) 2019 & 2032
                                                              57. Table 57: Global Apron Bus Market Revenue Million Forecast, by Export Market Analysis (Value & Volume) 2019 & 2032
                                                              58. Table 58: Global Apron Bus Market Revenue Million Forecast, by Price Trend Analysis 2019 & 2032
                                                              59. Table 59: Global Apron Bus Market Revenue Million Forecast, by Country 2019 & 2032
                                                              60. Table 60: United Kingdom Apron Bus Market Revenue (Million) Forecast, by Application 2019 & 2032
                                                              61. Table 61: Germany Apron Bus Market Revenue (Million) Forecast, by Application 2019 & 2032
                                                              62. Table 62: France Apron Bus Market Revenue (Million) Forecast, by Application 2019 & 2032
                                                              63. Table 63: Italy Apron Bus Market Revenue (Million) Forecast, by Application 2019 & 2032
                                                              64. Table 64: Spain Apron Bus Market Revenue (Million) Forecast, by Application 2019 & 2032
                                                              65. Table 65: Russia Apron Bus Market Revenue (Million) Forecast, by Application 2019 & 2032
                                                              66. Table 66: Benelux Apron Bus Market Revenue (Million) Forecast, by Application 2019 & 2032
                                                              67. Table 67: Nordics Apron Bus Market Revenue (Million) Forecast, by Application 2019 & 2032
                                                              68. Table 68: Rest of Europe Apron Bus Market Revenue (Million) Forecast, by Application 2019 & 2032
                                                              69. Table 69: Global Apron Bus Market Revenue Million Forecast, by Production Analysis 2019 & 2032
                                                              70. Table 70: Global Apron Bus Market Revenue Million Forecast, by Consumption Analysis 2019 & 2032
                                                              71. Table 71: Global Apron Bus Market Revenue Million Forecast, by Import Market Analysis (Value & Volume) 2019 & 2032
                                                              72. Table 72: Global Apron Bus Market Revenue Million Forecast, by Export Market Analysis (Value & Volume) 2019 & 2032
                                                              73. Table 73: Global Apron Bus Market Revenue Million Forecast, by Price Trend Analysis 2019 & 2032
                                                              74. Table 74: Global Apron Bus Market Revenue Million Forecast, by Country 2019 & 2032
                                                              75. Table 75: Turkey Apron Bus Market Revenue (Million) Forecast, by Application 2019 & 2032
                                                              76. Table 76: Israel Apron Bus Market Revenue (Million) Forecast, by Application 2019 & 2032
                                                              77. Table 77: GCC Apron Bus Market Revenue (Million) Forecast, by Application 2019 & 2032
                                                              78. Table 78: North Africa Apron Bus Market Revenue (Million) Forecast, by Application 2019 & 2032
                                                              79. Table 79: South Africa Apron Bus Market Revenue (Million) Forecast, by Application 2019 & 2032
                                                              80. Table 80: Rest of Middle East & Africa Apron Bus Market Revenue (Million) Forecast, by Application 2019 & 2032
                                                              81. Table 81: Global Apron Bus Market Revenue Million Forecast, by Production Analysis 2019 & 2032
                                                              82. Table 82: Global Apron Bus Market Revenue Million Forecast, by Consumption Analysis 2019 & 2032
                                                              83. Table 83: Global Apron Bus Market Revenue Million Forecast, by Import Market Analysis (Value & Volume) 2019 & 2032
                                                              84. Table 84: Global Apron Bus Market Revenue Million Forecast, by Export Market Analysis (Value & Volume) 2019 & 2032
                                                              85. Table 85: Global Apron Bus Market Revenue Million Forecast, by Price Trend Analysis 2019 & 2032
                                                              86. Table 86: Global Apron Bus Market Revenue Million Forecast, by Country 2019 & 2032
                                                              87. Table 87: China Apron Bus Market Revenue (Million) Forecast, by Application 2019 & 2032
                                                              88. Table 88: India Apron Bus Market Revenue (Million) Forecast, by Application 2019 & 2032
                                                              89. Table 89: Japan Apron Bus Market Revenue (Million) Forecast, by Application 2019 & 2032
                                                              90. Table 90: South Korea Apron Bus Market Revenue (Million) Forecast, by Application 2019 & 2032
                                                              91. Table 91: ASEAN Apron Bus Market Revenue (Million) Forecast, by Application 2019 & 2032
                                                              92. Table 92: Oceania Apron Bus Market Revenue (Million) Forecast, by Application 2019 & 2032
                                                              93. Table 93: Rest of Asia Pacific Apron Bus Market Revenue (Million) Forecast, by Application 2019 & 2032


                                                              Frequently Asked Questions

                                                              1. What is the projected Compound Annual Growth Rate (CAGR) of the Apron Bus Market?

                                                              The projected CAGR is approximately 10.77%.

                                                              2. Which companies are prominent players in the Apron Bus Market?

                                                              Key companies in the market include Mallaghan (G A ) In, Proterra Inc, Ashok Leyland, Yutong Bus Co Ltd, Solaris Bus & Coach sp z o o, Xiamen King Long International Trading Co Ltd, TAM - EUROPE, AB Volvo (Volvo Group), COBUS Industries GmbH, BYD Company Ltd, Xinfa Airport Equipment Ltd.

                                                              3. What are the main segments of the Apron Bus Market?

                                                              The market segments include Production Analysis, Consumption Analysis, Import Market Analysis (Value & Volume), Export Market Analysis (Value & Volume), Price Trend Analysis.

                                                              4. Can you provide details about the market size?

                                                              The market size is estimated to be USD 497.98 Million as of 2022.

                                                              5. What are some drivers contributing to market growth?

                                                              Increase in Internet of Things (IoT) and Autonomous Systems; Rise in Demand for Military and Defense Satellite Communication Solutions.

                                                              6. What are the notable trends driving market growth?

                                                              Electric Segment is Expected to Show Significant Growth During the Forecast Period.

                                                              7. Are there any restraints impacting market growth?

                                                              Cybersecurity Threats to Satellite Communication; Interference in Transmission of Data.

                                                              8. Can you provide examples of recent developments in the market?

                                                              August 2023: LSP Plus Corporation Announced a Five-Year Parking and Shuttle Operations Contract for the management of all public and employee parking facilities and public and employee shuttle service at Eppley Airport (OMA), US.

                                                              9. What pricing options are available for accessing the report?

                                                              Pricing options include single-user, multi-user, and enterprise licenses priced at USD 4750, USD 5250, and USD 8750 respectively.

                                                              10. Is the market size provided in terms of value or volume?

                                                              The market size is provided in terms of value, measured in Million.

                                                              11. Are there any specific market keywords associated with the report?

                                                              Yes, the market keyword associated with the report is "Apron Bus Market," which aids in identifying and referencing the specific market segment covered.

                                                              12. How do I determine which pricing option suits my needs best?

                                                              The pricing options vary based on user requirements and access needs. Individual users may opt for single-user licenses, while businesses requiring broader access may choose multi-user or enterprise licenses for cost-effective access to the report.

                                                              13. Are there any additional resources or data provided in the Apron Bus Market report?

                                                              While the report offers comprehensive insights, it's advisable to review the specific contents or supplementary materials provided to ascertain if additional resources or data are available.

                                                              14. How can I stay updated on further developments or reports in the Apron Bus Market?

                                                              To stay informed about further developments, trends, and reports in the Apron Bus Market, consider subscribing to industry newsletters, following relevant companies and organizations, or regularly checking reputable industry news sources and publications.


                                                              Methodology

                                                              Step 1 - Identification of Relevant Samples Size from Population Database

                                                              Step Chart
                                                              Bar Chart
                                                              Method Chart

                                                              Step 2 - Approaches for Defining Global Market Size (Value, Volume* & Price*)

                                                              Approach Chart
                                                              Top-down and bottom-up approaches are used to validate the global market size and estimate the market size for manufactures, regional segments, product, and application.

                                                              Note*: In applicable scenarios

                                                              Step 3 - Data Sources

                                                              Primary Research

                                                              • Web Analytics
                                                              • Survey Reports
                                                              • Research Institute
                                                              • Latest Research Reports
                                                              • Opinion Leaders

                                                              Secondary Research

                                                              • Annual Reports
                                                              • White Paper
                                                              • Latest Press Release
                                                              • Industry Association
                                                              • Paid Database
                                                              • Investor Presentations
                                                              Analyst Chart

                                                              Step 4 - Data Triangulation

                                                              Involves using different sources of information in order to increase the validity of a study

                                                              These sources are likely to be stakeholders in a program - participants, other researchers, program staff, other community members, and so on.

                                                              Then we put all data in single framework & apply various statistical tools to find out the dynamic on the market.

                                                              During the analysis stage, feedback from the stakeholder groups would be compared to determine areas of agreement as well as areas of divergence

                                                              Additionally, after gathering mixed and scattered data from a wide range of sources, data is triangulated and correlated to come up with estimated figures which are further validated through primary mediums or industry experts, opinion leaders.

                                                              About Research Axiom

                                                              Research Axiom delivers in-depth market research, industry analysis, and consulting for pharmaceuticals, automotive, IT, and consumer goods. Our reports provide the clarity you need to make informed decisions and drive innovation.

                                                              Our team combines primary research, advanced analytics, and sector expertise to deliver actionable intelligence. We offer syndicated reports, custom research, and consulting services tailored to your business needs.

                                                              At Research Axiom, we are committed to quality, transparency, and client satisfaction. Every report is rigorously validated to ensure accuracy and relevance. Our global perspective and local expertise help you understand both the big picture and the finer details of your market.

                                                              Stay informed with Research Axiom. Subscribe to our newsletter for the latest updates and research highlights, and follow us on social media for real-time insights. Research Axiom – Turning Data into Business Advantage.

                                                              artwork spiralartwork spiralRelated Reports
                                                              artwork underline

                                                              Naval Combat Weapons Market Strategic Roadmap: Analysis and Forecasts 2025-2033

                                                              The Naval Combat Weapons market is booming, projected to reach $XX million by 2033 with a 4% CAGR. This comprehensive analysis explores market drivers, trends, restraints, and key players like General Dynamics and Lockheed Martin, covering segments like underwater and surface-based weapons across diverse regions. Discover the future of naval warfare technology.

                                                              July 2025
                                                              Base Year: 2024
                                                              No Of Pages: 234
                                                              Price: $4750

                                                              Target Acquisition Systems Market Report 2025: Growth Driven by Government Incentives and Partnerships

                                                              Discover the explosive growth in the Target Acquisition Systems market, projected to exceed a 5.5% CAGR through 2033. This in-depth analysis reveals key drivers, market segments (land, airborne, naval), leading companies, and regional trends. Learn how technological advancements and geopolitical factors are shaping this lucrative sector.

                                                              July 2025
                                                              Base Year: 2024
                                                              No Of Pages: 234
                                                              Price: $4750

                                                              Aerospace Plastics Industry Market Outlook and Strategic Insights

                                                              The Aerospace Plastics Market is booming, projected to reach $25 billion by 2033 at a CAGR of 7.66%. Driven by lightweighting and fuel efficiency demands, this report analyzes market trends, key players (Premium AEROTEC, Toray Industries), regional growth (North America, Asia-Pacific), and segment applications (aerostructures, cabin interiors). Discover insights into this rapidly expanding sector.

                                                              July 2025
                                                              Base Year: 2024
                                                              No Of Pages: 234
                                                              Price: $4750

                                                              Challenges to Overcome in Commercial Airport Lighting Market Market Growth: Analysis 2025-2033

                                                              The commercial airport lighting market is booming, projected to reach [estimated 2033 market size] by 2033, driven by LED adoption and infrastructure expansion. Learn about market trends, key players (Honeywell, ADB SAFEGATE, etc.), and regional growth in this in-depth analysis.

                                                              July 2025
                                                              Base Year: 2024
                                                              No Of Pages: 234
                                                              Price: $4750

                                                              North America Small Satellite Market 2025-2033 Trends: Unveiling Growth Opportunities and Competitor Dynamics

                                                              The North American small satellite market is booming, with a projected CAGR of 5.18% through 2033. Driven by commercial and government demand for Earth observation, communication, and navigation, this report analyzes market size, key players (SpaceX, Swarm Technologies, etc.), and emerging trends in LEO, GEO, and MEO satellite technology. Discover the opportunities and challenges shaping this dynamic sector.

                                                              July 2025
                                                              Base Year: 2024
                                                              No Of Pages: 197
                                                              Price: $3800

                                                              Aircraft Door Market CAGR Growth Drivers and Trends: Forecasts 2025-2033

                                                              The aircraft door market is booming, projected to reach $8.48 billion by 2033 at a CAGR of 5.69%. This in-depth analysis explores market drivers, trends, restraints, segmentation (commercial, military, general aviation; passenger, cargo, emergency doors), key players (Safran, Collins Aerospace, etc.), and regional growth forecasts. Discover the opportunities and challenges shaping this dynamic sector.

                                                              July 2025
                                                              Base Year: 2024
                                                              No Of Pages: 234
                                                              Price: $4750

                                                              Future-Forward Strategies for EMEA Aviation Infrastructure Industry Industry

                                                              The EMEA aviation infrastructure market is booming, projected to reach $1.47 billion by 2033 with a 4.42% CAGR. Discover key market trends, drivers, restraints, and major players shaping this dynamic sector. Explore regional breakdowns and infrastructure segment analyses.

                                                              July 2025
                                                              Base Year: 2024
                                                              No Of Pages: 234
                                                              Price: $4750

                                                              APAC Military Aircraft Modernization and Retrofit Market 2025 Market Trends and 2033 Forecasts: Exploring Growth Potential

                                                              The APAC military aircraft modernization and retrofit market is booming, projected to reach $13.71 billion by 2025, driven by geopolitical tensions and technological advancements. Learn about key market trends, major players, and growth forecasts until 2033.

                                                              July 2025
                                                              Base Year: 2024
                                                              No Of Pages: 197
                                                              Price: $3800

                                                              Future-Ready Strategies for North America Charter Jet Services Market Market Growth

                                                              The North America charter jet services market is booming, projected to reach \$24.2 billion by 2033 with a 9.1% CAGR. Discover key trends, drivers, and leading companies shaping this lucrative private aviation sector. Learn about market segmentation by aircraft size and regional analysis focusing on the US, Canada, and Mexico.

                                                              July 2025
                                                              Base Year: 2024
                                                              No Of Pages: 234
                                                              Price: $4750

                                                              Middle East Aviation Market Report Probes the XXX Million Size, Share, Growth Report and Future Analysis by 2033

                                                              The Middle East aviation market, a $27.18 billion industry in 2025, is booming. Discover key trends, growth drivers (tourism, infrastructure investments), and leading companies shaping this rapidly expanding sector with a projected 4.40% CAGR until 2033. Explore regional market shares and future projections for commercial, military, and general aviation.

                                                              July 2025
                                                              Base Year: 2024
                                                              No Of Pages: 234
                                                              Price: $4750

                                                              Commercial Airport Radar Systems Industry Future-proof Strategies: Trends, Competitor Dynamics, and Opportunities 2025-2033

                                                              The Commercial Airport Radar Systems market is booming, projected to reach $5.98B in 2025 with a 7.48% CAGR. Discover key trends, drivers, restraints, and leading companies shaping this vital sector for air traffic management. Learn about market segmentation by application (surveillance, weather, approach radars) and regional analysis.

                                                              July 2025
                                                              Base Year: 2024
                                                              No Of Pages: 234
                                                              Price: $4750

                                                              Market Deep Dive: Exploring Defense Aircraft Materials Market Trends 2025-2033

                                                              Discover the booming defense aircraft materials market! This comprehensive analysis reveals key trends, drivers, and restraints impacting growth through 2033, covering materials like aluminum alloys, titanium, and composites, and major players like Toray and DuPont. Explore regional market shares and forecast data.

                                                              July 2025
                                                              Base Year: 2024
                                                              No Of Pages: 234
                                                              Price: $4750

                                                              Future Trends Shaping Naval ISR Market Growth

                                                              Discover the booming Naval ISR market, projected to reach $XX million by 2033 with a 3.5% CAGR. Explore market drivers, trends, and key players like Lockheed Martin and General Dynamics. Learn about regional growth in North America, Europe, and Asia-Pacific. Get the insights you need for strategic planning.

                                                              July 2025
                                                              Base Year: 2024
                                                              No Of Pages: 234
                                                              Price: $4750

                                                              Latin America Inflight Services Market Market’s Growth Blueprint

                                                              Discover the booming Latin American inflight services market! This comprehensive analysis reveals a $1.11B market in 2025, projecting 9.91% CAGR growth to 2033. Explore key drivers, trends, and challenges impacting airlines, catering companies, and passenger experiences. Learn about market segmentation, leading players, and regional opportunities.

                                                              July 2025
                                                              Base Year: 2024
                                                              No Of Pages: 234
                                                              Price: $4750

                                                              Airport Ground Handling Vehicles Industry 2025-2033 Trends: Unveiling Growth Opportunities and Competitor Dynamics

                                                              The Airport Ground Handling Vehicles market is booming, projected to reach $8.94B by 2025 with a 5.99% CAGR. Discover key trends, drivers, and restraints shaping this industry, including the rise of electric vehicles and regional market analysis. Learn about leading companies and future growth forecasts.

                                                              July 2025
                                                              Base Year: 2024
                                                              No Of Pages: 234
                                                              Price: $4750

                                                              Exploring Opportunities in Naval Gas Turbine Market Sector

                                                              Discover the booming Naval Gas Turbine Market, projected to reach $X million by 2033 with a CAGR exceeding 7.80%. Explore market drivers, trends, restraints, key players (GE, Rolls Royce, Mitsubishi), and regional analysis (North America, Europe, Asia-Pacific). Get the insights you need to navigate this high-growth sector.

                                                              July 2025
                                                              Base Year: 2024
                                                              No Of Pages: 234
                                                              Price: $4750

                                                              Middle East Civil Aviation Flight Training and Simulation Market in Emerging Markets: Analysis and Projections 2025-2033

                                                              The Middle East Civil Aviation Flight Training & Simulation Market is booming, with a CAGR exceeding 15%! Discover key trends, drivers, restraints, and leading companies shaping this lucrative sector. Explore market size projections to 2033 and regional breakdowns for the UAE, Saudi Arabia, and more.

                                                              July 2025
                                                              Base Year: 2024
                                                              No Of Pages: 234
                                                              Price: $4750

                                                              Aircraft Winglets Market Market Expansion: Growth Outlook 2025-2033

                                                              The Aircraft Winglets Market is booming, projected to reach \$4.78 billion by 2033, with a CAGR of 7.90%. This report analyzes market drivers, trends, and key players like Aviation Partners Boeing and BLR Aerospace, offering insights into fuel-efficient aviation technologies.

                                                              July 2025
                                                              Base Year: 2024
                                                              No Of Pages: 234
                                                              Price: $4750

                                                              SATCOM Industry Market Expansion Strategies

                                                              The global SATCOM market is booming, with a projected 23.54% CAGR through 2033. Driven by IoT, cloud computing, and government initiatives, this report analyzes market size, segments (LEO, GEO, MEO, satellite mass), key players (SpaceX, Intelsat, Airbus), and regional trends. Discover the future of satellite communication!

                                                              July 2025
                                                              Base Year: 2024
                                                              No Of Pages: 197
                                                              Price: $3800

                                                              Aircraft Health Monitoring Systems Industry 2025-2033 Analysis: Trends, Competitor Dynamics, and Growth Opportunities

                                                              The Aircraft Health Monitoring Systems market is booming, projected to reach $2.39 billion by 2033 with a CAGR of 6%. This report analyzes market drivers, trends, restraints, key players (Safran, Honeywell, Meggitt), and regional growth, focusing on technologies like AI and predictive maintenance. Explore the future of aviation safety and efficiency.

                                                              July 2025
                                                              Base Year: 2024
                                                              No Of Pages: 234
                                                              Price: $4750
                                                              • Home
                                                              • About Us
                                                              • Industries
                                                                • Aerospace & Defense
                                                                • Agriculture
                                                                • Animal Nutrition & Wellness
                                                                • Automotive
                                                                • Chemicals & Materials
                                                                • Consumer Goods and Services
                                                                • Energy & Power
                                                                • Financial Services and Investment Intelligence
                                                                • Food & Beverage
                                                                • Home and Property Improvement
                                                                • Hospitality and Tourism
                                                                • Logistics
                                                                • Manufacturing Products and Services
                                                                • Packaging
                                                                • Professional and Commercial Services
                                                                • Real Estate and Construction
                                                                • Retail
                                                                • Technology, Media and Telecom
                                                                • Healthcare
                                                              • Services
                                                              • Contact
                                                              Main Logo
                                                              • Home
                                                              • About Us
                                                              • Industries
                                                                • Aerospace & Defense
                                                                • Agriculture
                                                                • Animal Nutrition & Wellness
                                                                • Automotive
                                                                • Chemicals & Materials
                                                                • Consumer Goods and Services
                                                                • Energy & Power
                                                                • Financial Services and Investment Intelligence
                                                                • Food & Beverage
                                                                • Home and Property Improvement
                                                                • Hospitality and Tourism
                                                                • Logistics
                                                                • Manufacturing Products and Services
                                                                • Packaging
                                                                • Professional and Commercial Services
                                                                • Real Estate and Construction
                                                                • Retail
                                                                • Technology, Media and Telecom
                                                                • Healthcare
                                                              • Services
                                                              • Contact
                                                              +17162654855
                                                              [email protected]

                                                              +17162654855

                                                              [email protected]

                                                              Business Address

                                                              Head Office

                                                              Office no. A 5010, fifth floor, Solitaire Business Hub, Near Phoenix mall, Pune, Maharashtra 411014

                                                              Contact Information

                                                              Craig Francis

                                                              Business Development Head

                                                              +17162654855

                                                              [email protected]

                                                              Connect With Us

                                                              Secure Payment Partners

                                                              payment image
                                                              RetailLogisticsPackagingAutomotiveHealthcareAgricultureEnergy & PowerFood & BeverageAerospace & DefenseChemicals & MaterialsHospitality and TourismAnimal Nutrition & WellnessConsumer Goods and ServicesReal Estate and ConstructionHome and Property ImprovementTechnology, Media and TelecomManufacturing Products and ServicesFinancial Services and Investment Intelligence

                                                              © 2025 All rights reserved


                                                              Privacy Policy
                                                              Terms and Conditions
                                                              FAQ