

Key Insights
The global Area Rugs market is poised for significant expansion, projected to reach USD 12.71 billion in 2025 and grow at a robust Compound Annual Growth Rate (CAGR) of 5.65% through 2033. This upward trajectory is fueled by a confluence of factors, including rising disposable incomes in emerging economies, a growing trend towards interior design and home personalization, and increased consumer spending on home furnishings. The residential sector is expected to remain the dominant application segment, driven by homeowners seeking to enhance the aesthetics and comfort of their living spaces. Within this segment, natural fiber rugs like wool, cotton, and jute are experiencing a resurgence in popularity due to their eco-friendly appeal and aesthetic qualities, while synthetic options continue to offer durability and affordability.
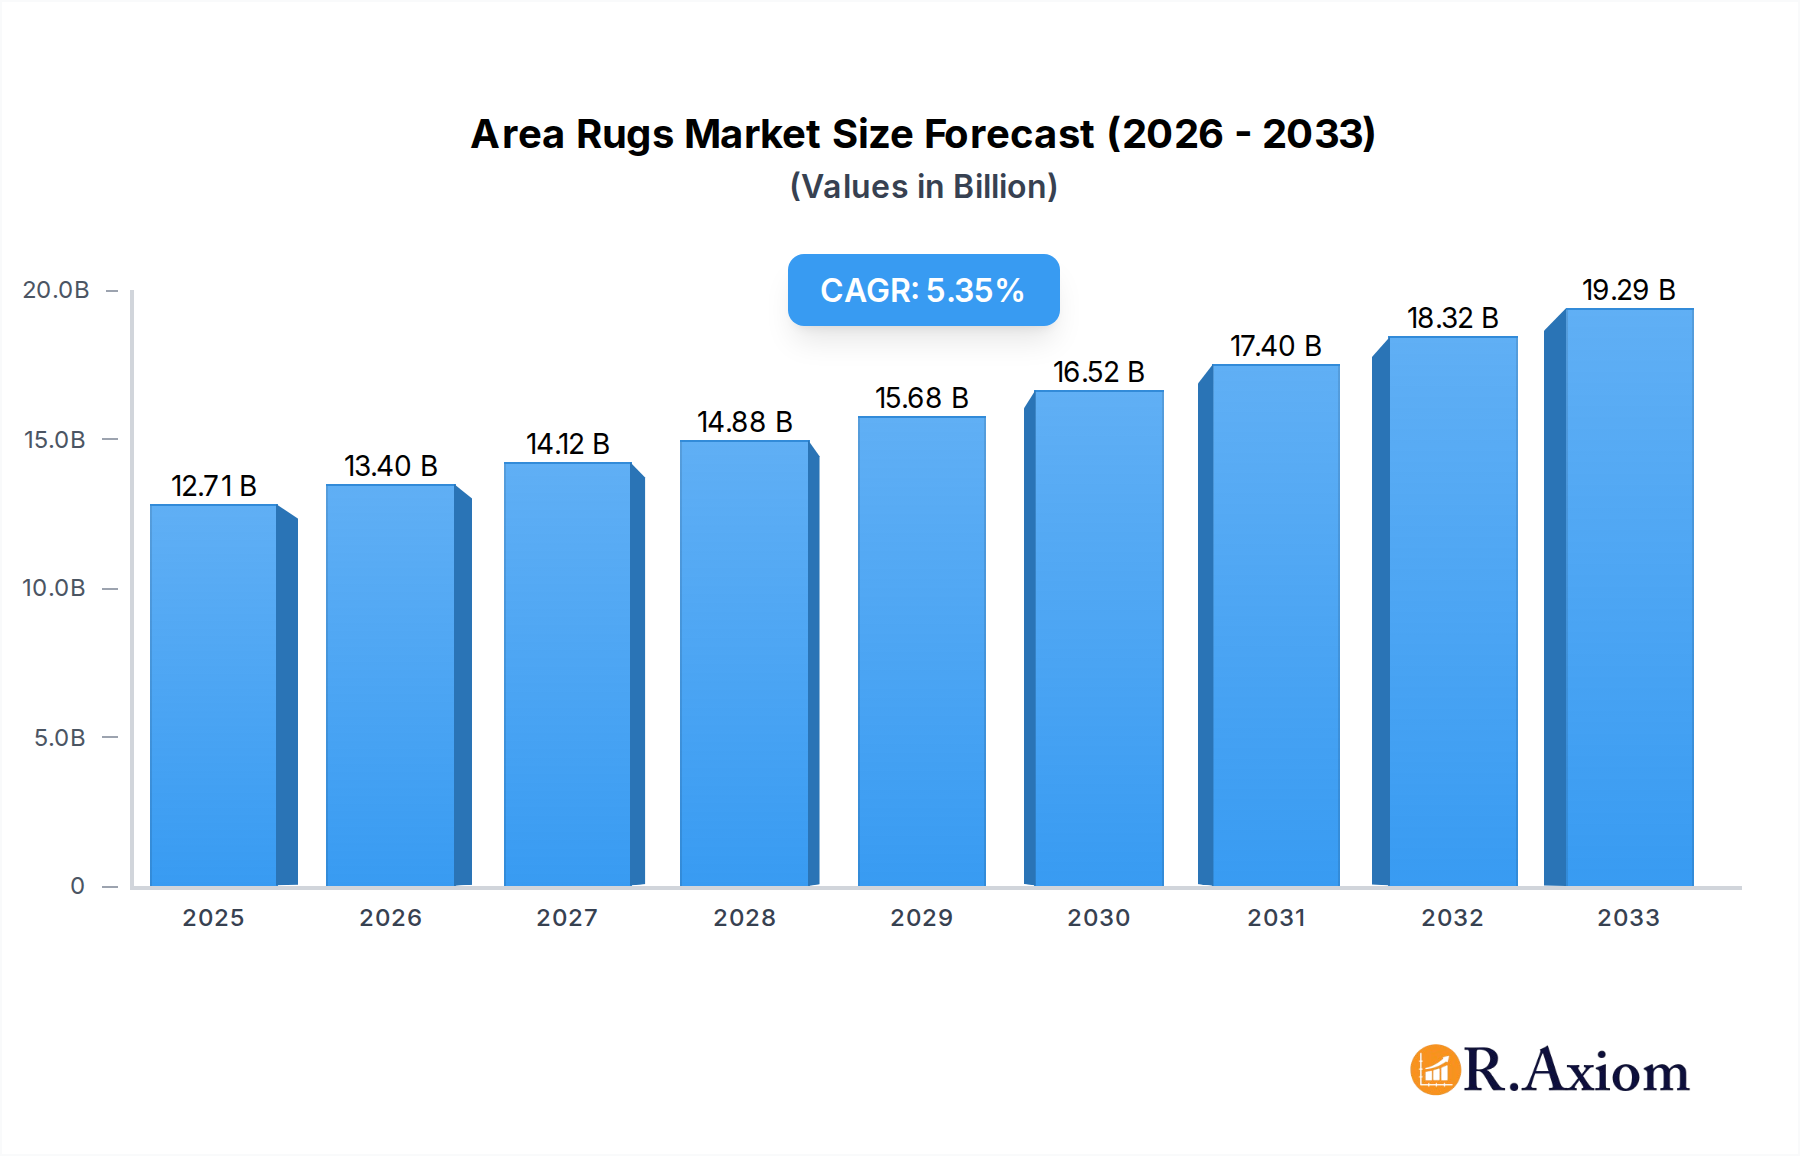
Area Rugs Market Size (In Billion)
The commercial sector is also a key growth driver, with businesses investing in attractive and functional flooring solutions for offices, hospitality venues, and retail spaces. The demand for area rugs in these environments is often influenced by branding, client comfort, and the need for sound absorption. Key trends shaping the market include the increasing preference for customizable rugs, the growing influence of e-commerce in rug sales, and a greater emphasis on sustainable and ethically sourced materials. While the market is generally optimistic, challenges such as volatile raw material prices and intense competition among manufacturers could present some hurdles. However, the overall outlook for the area rug industry remains strong, with continuous innovation in design, materials, and distribution channels expected to sustain its growth momentum.

Area Rugs Company Market Share
Global Area Rugs Market Analysis and Forecast: 2019-2033
This comprehensive report delves into the global Area Rugs market, providing an in-depth analysis of market dynamics, growth drivers, challenges, and opportunities. Covering a study period from 2019 to 2033, with a base year of 2025, this report offers valuable insights for industry stakeholders, including manufacturers, suppliers, distributors, and investors. We meticulously examine market concentration, innovation, regulatory frameworks, product substitutes, end-user trends, and Mergers & Acquisitions (M&A) activities. The report forecasts market trends and provides actionable strategies for navigating the competitive landscape of the area rugs industry.
Area Rugs Market Concentration & Innovation
The global Area Rugs market exhibits a moderate level of concentration, with key players like Mohawk Industries, Shaw Industries, and Balta Industries holding significant market shares. In 2025, the market is projected to reach a valuation of over 100 billion dollars, driven by continuous innovation in materials, designs, and manufacturing processes. Innovation is fueled by evolving consumer preferences for personalized and sustainable products, alongside advancements in digital printing and smart textile technologies. Regulatory frameworks primarily focus on material safety and environmental impact, influencing production practices. Product substitutes, such as wall-to-wall carpeting and hard flooring with smaller accent mats, present a competitive challenge. End-user trends indicate a growing demand for durable, aesthetically pleasing, and eco-friendly area rugs for both residential and commercial applications. M&A activities, with estimated deal values reaching into the billions, are strategically aimed at expanding product portfolios, enhancing distribution networks, and consolidating market presence.
- Market Share Distribution: Leading companies hold an estimated 60 billion dollar share collectively.
- M&A Deal Values: Recent M&A transactions are valued at over 5 billion dollars annually.
- Innovation Drivers: Sustainability, customization, and advanced material science.
- Regulatory Focus: Material safety standards and environmental compliance.
- Competitive Landscape: Moderate concentration with scope for new entrants in niche segments.
Area Rugs Industry Trends & Insights
The Area Rugs industry is poised for robust growth, projected at a Compound Annual Growth Rate (CAGR) of approximately 6.50% from 2025 to 2033, with the global market size expected to surpass 150 billion dollars by 2033. This growth is propelled by several key factors, including the increasing disposable incomes in emerging economies, a burgeoning real estate sector driving demand for home furnishings, and a heightened consumer focus on interior aesthetics and comfort. The residential segment continues to be a dominant force, as homeowners invest in creating personalized and inviting living spaces. Furthermore, the commercial sector, encompassing hospitality, retail, and corporate offices, is increasingly utilizing area rugs to enhance ambiance, define spaces, and improve acoustics, contributing significantly to market penetration. Technological disruptions are playing a crucial role, with advancements in digital printing allowing for intricate designs and on-demand customization, while the development of new synthetic fibers offers improved durability, stain resistance, and sustainability at competitive price points. The demand for natural fibers such as wool and sisal remains strong due to their inherent aesthetic appeal and eco-friendly attributes, albeit with higher price points. Consumer preferences are shifting towards sustainable sourcing, ethical manufacturing, and the incorporation of smart technologies for enhanced functionality. Competitive dynamics are characterized by a blend of established global players and agile niche manufacturers catering to specific design trends or material preferences. The market penetration for area rugs is estimated at 75% in developed economies and is rapidly expanding in developing regions. The overall market value in 2025 is estimated at 105 billion dollars.
Dominant Markets & Segments in Area Rugs
North America currently dominates the global Area Rugs market, driven by strong consumer spending on home décor and a well-established real estate industry. Within North America, the United States leads in market share due to a mature retail infrastructure and a high propensity for home renovations and interior design investments. The residential use application segment is the largest contributor to the market, accounting for an estimated 70 billion dollars in 2025. This dominance is attributed to the growing trend of home personalization, where area rugs play a pivotal role in defining living spaces, adding warmth, and enhancing aesthetic appeal. The commercial use segment, while smaller, is experiencing significant growth, particularly within the hospitality and corporate sectors, contributing approximately 35 billion dollars in 2025. This growth is spurred by the need for durable, attractive, and acoustically beneficial flooring solutions that can withstand high traffic.
Among the types of area rugs, Wool Area Rugs represent a significant segment, valued at an estimated 45 billion dollars in 2025, due to their inherent luxury, durability, and natural appeal. Synthetics Area Rugs follow closely, with an estimated market value of 30 billion dollars in 2025, offering a balance of affordability, stain resistance, and a wide array of design options. Cotton Area Rugs and Sisal, Jute & Sea Grass Area Rugs collectively contribute approximately 20 billion dollars, catering to eco-conscious consumers and those seeking natural textures. Silk Area Rugs and Animal Skins Area Rugs constitute niche segments, with market values of around 5 billion dollars and 2 billion dollars respectively in 2025, appealing to luxury markets and specific design preferences.
- Leading Region: North America, driven by the United States.
- Key Drivers: High disposable income, robust real estate market, strong consumer demand for home décor.
- Market Size (2025): Estimated over 80 billion dollars.
- Dominant Application Segment: Residential Use.
- Key Drivers: Home personalization trends, interior design focus, desire for comfort.
- Market Size (2025): Estimated 70 billion dollars.
- Leading Type Segment: Wool Area Rugs.
- Key Drivers: Luxury appeal, durability, natural aesthetic.
- Market Size (2025): Estimated 45 billion dollars.
- Fastest Growing Segment: Commercial Use (Hospitality & Retail).
- Key Drivers: Need for durable and aesthetically pleasing spaces, acoustic benefits.
- Projected CAGR: ~7.00% during the forecast period.
Area Rugs Product Developments
Product innovation in the area rugs market is primarily focused on enhancing sustainability, functionality, and aesthetic appeal. Manufacturers are increasingly utilizing recycled and renewable materials, such as recycled PET bottles and organic cotton, to cater to environmentally conscious consumers. Advancements in printing technology allow for hyper-realistic patterns and personalized designs, blurring the lines between mass production and bespoke creations. Smart textiles are also emerging, with features like integrated lighting or self-cleaning properties being explored. These developments provide competitive advantages by meeting evolving consumer demands for unique, eco-friendly, and technologically advanced home furnishings. The market is witnessing a surge in offerings with enhanced stain and fade resistance, extending product lifespan and reducing maintenance.
Report Scope & Segmentation Analysis
This report provides a granular segmentation of the global Area Rugs market, encompassing Applications and Types. The Application segments include Residential Use, projected to reach over 90 billion dollars by 2033, and Commercial Use, expected to grow to over 50 billion dollars by the same period, driven by commercial space redesign initiatives and the growing experience economy. The Types segments analyzed include Wool Area Rug, estimated at 60 billion dollars by 2033; Silk Area Rug, a niche segment projected around 8 billion dollars; Cotton Area Rug, valued at approximately 30 billion dollars; Sisal, Jute & Sea Grass Area Rug, expected to reach 25 billion dollars, appealing to the sustainable and natural décor trend; Animal Skins Area Rug, a luxury segment anticipated at 4 billion dollars; and Synthetics Area Rug, projected to reach 40 billion dollars, offering a versatile and affordable alternative. Competitive dynamics within each segment vary, with natural fiber segments facing price sensitivity while synthetic segments compete on innovation and durability.
Key Drivers of Area Rugs Growth
The growth of the Area Rugs market is propelled by several interconnected factors. A primary driver is the increasing disposable income in both developed and developing economies, enabling consumers to invest more in home décor and lifestyle enhancements. Secondly, the burgeoning real estate and construction sectors globally directly translate to increased demand for furnishings, including area rugs, as new homes and commercial spaces are developed. Evolving interior design trends emphasizing comfort, personalization, and statement pieces further boost demand, with area rugs serving as a key element in achieving desired aesthetics. Technological advancements in manufacturing, such as digital printing and new material development, are enabling more diverse designs, improved durability, and sustainable production, thereby expanding market appeal. Growing environmental awareness is also a significant driver, pushing demand for eco-friendly and ethically sourced rugs.
Challenges in the Area Rugs Sector
Despite robust growth, the Area Rugs sector faces several challenges. Fluctuations in raw material prices, particularly for natural fibers like wool and silk, can impact manufacturing costs and final product pricing, potentially affecting demand. Intense competition from both established global players and a growing number of online retailers and smaller niche brands exerts pressure on profit margins. Supply chain disruptions, exacerbated by geopolitical events and logistical complexities, can lead to delays and increased costs. Stringent environmental regulations and the demand for sustainable practices require significant investment in R&D and production overhauls for some manufacturers. Furthermore, the increasing popularity of alternative flooring solutions and the perception of area rugs as an additional purchase rather than a necessity can also act as a restraint.
Emerging Opportunities in Area Rugs
Significant emerging opportunities lie in the increasing demand for sustainable and eco-friendly area rugs. Manufacturers focusing on recycled materials, organic fibers, and ethical production processes can tap into a growing conscious consumer base. The digitalization of retail and the rise of e-commerce present opportunities for wider market reach and direct-to-consumer sales, particularly for customizable or niche products. The expansion of the middle class in emerging economies offers substantial untapped market potential as disposable incomes rise and consumer spending on home furnishings increases. Furthermore, the integration of smart technologies into textiles, though nascent, presents a future opportunity for functional and innovative area rug designs. The commercial sector, especially in hospitality and healthcare, is also a growing opportunity, demanding durable, hygienic, and aesthetically pleasing solutions.
Leading Players in the Area Rugs Market
- Balta Industries
- Milliken & Company
- Mohawk Industries
- Nourison Industries
- OW (Oriental Weavers)
- Shaw Industries
- The Dixie Group
Key Developments in Area Rugs Industry
- 2023: Mohawk Industries acquires a leading sustainable textile manufacturer, strengthening its eco-friendly product portfolio.
- 2023: Milliken & Company launches a new line of performance area rugs with advanced stain-repellent technology, targeting commercial applications.
- 2023: Oriental Weavers invests heavily in digital printing technology, enabling faster customization and intricate design capabilities.
- 2024: Shaw Industries introduces a collection of area rugs made entirely from recycled plastic bottles, enhancing its sustainability credentials.
- 2024: Balta Industries expands its production capacity for natural fiber rugs to meet growing demand for premium products.
Strategic Outlook for Area Rugs Market
The strategic outlook for the Area Rugs market remains highly positive, driven by ongoing consumer demand for aesthetically pleasing, comfortable, and functional home environments. Key growth catalysts include the continuous innovation in sustainable materials and manufacturing processes, coupled with the expansion of e-commerce platforms that offer broader market access. The increasing adoption of area rugs in commercial spaces, driven by design trends and the need for enhanced acoustics and space definition, presents a significant growth avenue. Companies that can effectively leverage digital technologies for customization and direct-to-consumer engagement, while also prioritizing eco-friendly production, are best positioned for future success. The market's future potential is further bolstered by the rising disposable incomes in developing regions, creating new consumer bases eager to invest in home décor.
Area Rugs Segmentation
-
1. Application
- 1.1. Residential Use
- 1.2. Commercial Use
-
2. Types
- 2.1. Wool Area Rug
- 2.2. Silk Area Rug
- 2.3. Cotton Area Rug
- 2.4. Sisal, Jute & Sea Grass Area Rug
- 2.5. Animal Skins Area Rug
- 2.6. Synthetics Area Rug
Area Rugs Segmentation By Geography
-
1. North America
- 1.1. United States
- 1.2. Canada
- 1.3. Mexico
-
2. South America
- 2.1. Brazil
- 2.2. Argentina
- 2.3. Rest of South America
-
3. Europe
- 3.1. United Kingdom
- 3.2. Germany
- 3.3. France
- 3.4. Italy
- 3.5. Spain
- 3.6. Russia
- 3.7. Benelux
- 3.8. Nordics
- 3.9. Rest of Europe
-
4. Middle East & Africa
- 4.1. Turkey
- 4.2. Israel
- 4.3. GCC
- 4.4. North Africa
- 4.5. South Africa
- 4.6. Rest of Middle East & Africa
-
5. Asia Pacific
- 5.1. China
- 5.2. India
- 5.3. Japan
- 5.4. South Korea
- 5.5. ASEAN
- 5.6. Oceania
- 5.7. Rest of Asia Pacific

Area Rugs Regional Market Share
Geographic Coverage of Area Rugs
Area Rugs REPORT HIGHLIGHTS
| Aspects | Details |
|---|---|
| Study Period | 2020-2034 |
| Base Year | 2025 |
| Estimated Year | 2026 |
| Forecast Period | 2026-2034 |
| Historical Period | 2020-2025 |
| Growth Rate | CAGR of 5.65% from 2020-2034 |
| Segmentation |
|
Table of Contents
- 1. Introduction
- 1.1. Research Scope
- 1.2. Market Segmentation
- 1.3. Research Objective
- 1.4. Definitions and Assumptions
- 2. Executive Summary
- 2.1. Market Snapshot
- 3. Market Dynamics
- 3.1. Market Drivers
- 3.2. Market Restrains
- 3.3. Market Trends
- 3.4. Market Opportunities
- 4. Market Factor Analysis
- 4.1. Porters Five Forces
- 4.1.1. Bargaining Power of Suppliers
- 4.1.2. Bargaining Power of Buyers
- 4.1.3. Threat of New Entrants
- 4.1.4. Threat of Substitutes
- 4.1.5. Competitive Rivalry
- 4.2. PESTEL analysis
- 4.3. BCG Analysis
- 4.3.1. Stars (High Growth, High Market Share)
- 4.3.2. Cash Cows (Low Growth, High Market Share)
- 4.3.3. Question Mark (High Growth, Low Market Share)
- 4.3.4. Dogs (Low Growth, Low Market Share)
- 4.4. Ansoff Matrix Analysis
- 4.5. Supply Chain Analysis
- 4.6. Regulatory Landscape
- 4.7. Current Market Potential and Opportunity Assessment (TAM–SAM–SOM Framework)
- 4.8. RAX Analyst Note
- 4.1. Porters Five Forces
- 5. Market Analysis, Insights and Forecast 2021-2033
- 5.1. Market Analysis, Insights and Forecast - by Application
- 5.1.1. Residential Use
- 5.1.2. Commercial Use
- 5.2. Market Analysis, Insights and Forecast - by Types
- 5.2.1. Wool Area Rug
- 5.2.2. Silk Area Rug
- 5.2.3. Cotton Area Rug
- 5.2.4. Sisal, Jute & Sea Grass Area Rug
- 5.2.5. Animal Skins Area Rug
- 5.2.6. Synthetics Area Rug
- 5.3. Market Analysis, Insights and Forecast - by Region
- 5.3.1. North America
- 5.3.2. South America
- 5.3.3. Europe
- 5.3.4. Middle East & Africa
- 5.3.5. Asia Pacific
- 5.1. Market Analysis, Insights and Forecast - by Application
- 6. Global Area Rugs Analysis, Insights and Forecast, 2021-2033
- 6.1. Market Analysis, Insights and Forecast - by Application
- 6.1.1. Residential Use
- 6.1.2. Commercial Use
- 6.2. Market Analysis, Insights and Forecast - by Types
- 6.2.1. Wool Area Rug
- 6.2.2. Silk Area Rug
- 6.2.3. Cotton Area Rug
- 6.2.4. Sisal, Jute & Sea Grass Area Rug
- 6.2.5. Animal Skins Area Rug
- 6.2.6. Synthetics Area Rug
- 6.1. Market Analysis, Insights and Forecast - by Application
- 7. North America Area Rugs Analysis, Insights and Forecast, 2020-2032
- 7.1. Market Analysis, Insights and Forecast - by Application
- 7.1.1. Residential Use
- 7.1.2. Commercial Use
- 7.2. Market Analysis, Insights and Forecast - by Types
- 7.2.1. Wool Area Rug
- 7.2.2. Silk Area Rug
- 7.2.3. Cotton Area Rug
- 7.2.4. Sisal, Jute & Sea Grass Area Rug
- 7.2.5. Animal Skins Area Rug
- 7.2.6. Synthetics Area Rug
- 7.1. Market Analysis, Insights and Forecast - by Application
- 8. South America Area Rugs Analysis, Insights and Forecast, 2020-2032
- 8.1. Market Analysis, Insights and Forecast - by Application
- 8.1.1. Residential Use
- 8.1.2. Commercial Use
- 8.2. Market Analysis, Insights and Forecast - by Types
- 8.2.1. Wool Area Rug
- 8.2.2. Silk Area Rug
- 8.2.3. Cotton Area Rug
- 8.2.4. Sisal, Jute & Sea Grass Area Rug
- 8.2.5. Animal Skins Area Rug
- 8.2.6. Synthetics Area Rug
- 8.1. Market Analysis, Insights and Forecast - by Application
- 9. Europe Area Rugs Analysis, Insights and Forecast, 2020-2032
- 9.1. Market Analysis, Insights and Forecast - by Application
- 9.1.1. Residential Use
- 9.1.2. Commercial Use
- 9.2. Market Analysis, Insights and Forecast - by Types
- 9.2.1. Wool Area Rug
- 9.2.2. Silk Area Rug
- 9.2.3. Cotton Area Rug
- 9.2.4. Sisal, Jute & Sea Grass Area Rug
- 9.2.5. Animal Skins Area Rug
- 9.2.6. Synthetics Area Rug
- 9.1. Market Analysis, Insights and Forecast - by Application
- 10. Middle East & Africa Area Rugs Analysis, Insights and Forecast, 2020-2032
- 10.1. Market Analysis, Insights and Forecast - by Application
- 10.1.1. Residential Use
- 10.1.2. Commercial Use
- 10.2. Market Analysis, Insights and Forecast - by Types
- 10.2.1. Wool Area Rug
- 10.2.2. Silk Area Rug
- 10.2.3. Cotton Area Rug
- 10.2.4. Sisal, Jute & Sea Grass Area Rug
- 10.2.5. Animal Skins Area Rug
- 10.2.6. Synthetics Area Rug
- 10.1. Market Analysis, Insights and Forecast - by Application
- 11. Asia Pacific Area Rugs Analysis, Insights and Forecast, 2020-2032
- 11.1. Market Analysis, Insights and Forecast - by Application
- 11.1.1. Residential Use
- 11.1.2. Commercial Use
- 11.2. Market Analysis, Insights and Forecast - by Types
- 11.2.1. Wool Area Rug
- 11.2.2. Silk Area Rug
- 11.2.3. Cotton Area Rug
- 11.2.4. Sisal, Jute & Sea Grass Area Rug
- 11.2.5. Animal Skins Area Rug
- 11.2.6. Synthetics Area Rug
- 11.1. Market Analysis, Insights and Forecast - by Application
- 12. Competitive Analysis
- 12.1. Company Profiles
- 12.1.1 Balta Industries
- 12.1.1.1. Company Overview
- 12.1.1.2. Products
- 12.1.1.3. Company Financials
- 12.1.1.4. SWOT Analysis
- 12.1.2 Milliken & Company
- 12.1.2.1. Company Overview
- 12.1.2.2. Products
- 12.1.2.3. Company Financials
- 12.1.2.4. SWOT Analysis
- 12.1.3 Mohawk Industries
- 12.1.3.1. Company Overview
- 12.1.3.2. Products
- 12.1.3.3. Company Financials
- 12.1.3.4. SWOT Analysis
- 12.1.4 Nourison Industries
- 12.1.4.1. Company Overview
- 12.1.4.2. Products
- 12.1.4.3. Company Financials
- 12.1.4.4. SWOT Analysis
- 12.1.5 OW (Oriental Weavers)
- 12.1.5.1. Company Overview
- 12.1.5.2. Products
- 12.1.5.3. Company Financials
- 12.1.5.4. SWOT Analysis
- 12.1.6 Shaw Industries
- 12.1.6.1. Company Overview
- 12.1.6.2. Products
- 12.1.6.3. Company Financials
- 12.1.6.4. SWOT Analysis
- 12.1.7 The Dixie Group
- 12.1.7.1. Company Overview
- 12.1.7.2. Products
- 12.1.7.3. Company Financials
- 12.1.7.4. SWOT Analysis
- 12.1.1 Balta Industries
- 12.2. Market Entropy
- 12.2.1 Company's Key Areas Served
- 12.2.2 Recent Developments
- 12.3. Company Market Share Analysis 2025
- 12.3.1 Top 5 Companies Market Share Analysis
- 12.3.2 Top 3 Companies Market Share Analysis
- 12.4. List of Potential Customers
- 13. Research Methodology
List of Figures
- Figure 1: Global Area Rugs Revenue Breakdown (undefined, %) by Region 2025 & 2033
- Figure 2: Global Area Rugs Volume Breakdown (K, %) by Region 2025 & 2033
- Figure 3: North America Area Rugs Revenue (undefined), by Application 2025 & 2033
- Figure 4: North America Area Rugs Volume (K), by Application 2025 & 2033
- Figure 5: North America Area Rugs Revenue Share (%), by Application 2025 & 2033
- Figure 6: North America Area Rugs Volume Share (%), by Application 2025 & 2033
- Figure 7: North America Area Rugs Revenue (undefined), by Types 2025 & 2033
- Figure 8: North America Area Rugs Volume (K), by Types 2025 & 2033
- Figure 9: North America Area Rugs Revenue Share (%), by Types 2025 & 2033
- Figure 10: North America Area Rugs Volume Share (%), by Types 2025 & 2033
- Figure 11: North America Area Rugs Revenue (undefined), by Country 2025 & 2033
- Figure 12: North America Area Rugs Volume (K), by Country 2025 & 2033
- Figure 13: North America Area Rugs Revenue Share (%), by Country 2025 & 2033
- Figure 14: North America Area Rugs Volume Share (%), by Country 2025 & 2033
- Figure 15: South America Area Rugs Revenue (undefined), by Application 2025 & 2033
- Figure 16: South America Area Rugs Volume (K), by Application 2025 & 2033
- Figure 17: South America Area Rugs Revenue Share (%), by Application 2025 & 2033
- Figure 18: South America Area Rugs Volume Share (%), by Application 2025 & 2033
- Figure 19: South America Area Rugs Revenue (undefined), by Types 2025 & 2033
- Figure 20: South America Area Rugs Volume (K), by Types 2025 & 2033
- Figure 21: South America Area Rugs Revenue Share (%), by Types 2025 & 2033
- Figure 22: South America Area Rugs Volume Share (%), by Types 2025 & 2033
- Figure 23: South America Area Rugs Revenue (undefined), by Country 2025 & 2033
- Figure 24: South America Area Rugs Volume (K), by Country 2025 & 2033
- Figure 25: South America Area Rugs Revenue Share (%), by Country 2025 & 2033
- Figure 26: South America Area Rugs Volume Share (%), by Country 2025 & 2033
- Figure 27: Europe Area Rugs Revenue (undefined), by Application 2025 & 2033
- Figure 28: Europe Area Rugs Volume (K), by Application 2025 & 2033
- Figure 29: Europe Area Rugs Revenue Share (%), by Application 2025 & 2033
- Figure 30: Europe Area Rugs Volume Share (%), by Application 2025 & 2033
- Figure 31: Europe Area Rugs Revenue (undefined), by Types 2025 & 2033
- Figure 32: Europe Area Rugs Volume (K), by Types 2025 & 2033
- Figure 33: Europe Area Rugs Revenue Share (%), by Types 2025 & 2033
- Figure 34: Europe Area Rugs Volume Share (%), by Types 2025 & 2033
- Figure 35: Europe Area Rugs Revenue (undefined), by Country 2025 & 2033
- Figure 36: Europe Area Rugs Volume (K), by Country 2025 & 2033
- Figure 37: Europe Area Rugs Revenue Share (%), by Country 2025 & 2033
- Figure 38: Europe Area Rugs Volume Share (%), by Country 2025 & 2033
- Figure 39: Middle East & Africa Area Rugs Revenue (undefined), by Application 2025 & 2033
- Figure 40: Middle East & Africa Area Rugs Volume (K), by Application 2025 & 2033
- Figure 41: Middle East & Africa Area Rugs Revenue Share (%), by Application 2025 & 2033
- Figure 42: Middle East & Africa Area Rugs Volume Share (%), by Application 2025 & 2033
- Figure 43: Middle East & Africa Area Rugs Revenue (undefined), by Types 2025 & 2033
- Figure 44: Middle East & Africa Area Rugs Volume (K), by Types 2025 & 2033
- Figure 45: Middle East & Africa Area Rugs Revenue Share (%), by Types 2025 & 2033
- Figure 46: Middle East & Africa Area Rugs Volume Share (%), by Types 2025 & 2033
- Figure 47: Middle East & Africa Area Rugs Revenue (undefined), by Country 2025 & 2033
- Figure 48: Middle East & Africa Area Rugs Volume (K), by Country 2025 & 2033
- Figure 49: Middle East & Africa Area Rugs Revenue Share (%), by Country 2025 & 2033
- Figure 50: Middle East & Africa Area Rugs Volume Share (%), by Country 2025 & 2033
- Figure 51: Asia Pacific Area Rugs Revenue (undefined), by Application 2025 & 2033
- Figure 52: Asia Pacific Area Rugs Volume (K), by Application 2025 & 2033
- Figure 53: Asia Pacific Area Rugs Revenue Share (%), by Application 2025 & 2033
- Figure 54: Asia Pacific Area Rugs Volume Share (%), by Application 2025 & 2033
- Figure 55: Asia Pacific Area Rugs Revenue (undefined), by Types 2025 & 2033
- Figure 56: Asia Pacific Area Rugs Volume (K), by Types 2025 & 2033
- Figure 57: Asia Pacific Area Rugs Revenue Share (%), by Types 2025 & 2033
- Figure 58: Asia Pacific Area Rugs Volume Share (%), by Types 2025 & 2033
- Figure 59: Asia Pacific Area Rugs Revenue (undefined), by Country 2025 & 2033
- Figure 60: Asia Pacific Area Rugs Volume (K), by Country 2025 & 2033
- Figure 61: Asia Pacific Area Rugs Revenue Share (%), by Country 2025 & 2033
- Figure 62: Asia Pacific Area Rugs Volume Share (%), by Country 2025 & 2033
List of Tables
- Table 1: Global Area Rugs Revenue undefined Forecast, by Application 2020 & 2033
- Table 2: Global Area Rugs Volume K Forecast, by Application 2020 & 2033
- Table 3: Global Area Rugs Revenue undefined Forecast, by Types 2020 & 2033
- Table 4: Global Area Rugs Volume K Forecast, by Types 2020 & 2033
- Table 5: Global Area Rugs Revenue undefined Forecast, by Region 2020 & 2033
- Table 6: Global Area Rugs Volume K Forecast, by Region 2020 & 2033
- Table 7: Global Area Rugs Revenue undefined Forecast, by Application 2020 & 2033
- Table 8: Global Area Rugs Volume K Forecast, by Application 2020 & 2033
- Table 9: Global Area Rugs Revenue undefined Forecast, by Types 2020 & 2033
- Table 10: Global Area Rugs Volume K Forecast, by Types 2020 & 2033
- Table 11: Global Area Rugs Revenue undefined Forecast, by Country 2020 & 2033
- Table 12: Global Area Rugs Volume K Forecast, by Country 2020 & 2033
- Table 13: United States Area Rugs Revenue (undefined) Forecast, by Application 2020 & 2033
- Table 14: United States Area Rugs Volume (K) Forecast, by Application 2020 & 2033
- Table 15: Canada Area Rugs Revenue (undefined) Forecast, by Application 2020 & 2033
- Table 16: Canada Area Rugs Volume (K) Forecast, by Application 2020 & 2033
- Table 17: Mexico Area Rugs Revenue (undefined) Forecast, by Application 2020 & 2033
- Table 18: Mexico Area Rugs Volume (K) Forecast, by Application 2020 & 2033
- Table 19: Global Area Rugs Revenue undefined Forecast, by Application 2020 & 2033
- Table 20: Global Area Rugs Volume K Forecast, by Application 2020 & 2033
- Table 21: Global Area Rugs Revenue undefined Forecast, by Types 2020 & 2033
- Table 22: Global Area Rugs Volume K Forecast, by Types 2020 & 2033
- Table 23: Global Area Rugs Revenue undefined Forecast, by Country 2020 & 2033
- Table 24: Global Area Rugs Volume K Forecast, by Country 2020 & 2033
- Table 25: Brazil Area Rugs Revenue (undefined) Forecast, by Application 2020 & 2033
- Table 26: Brazil Area Rugs Volume (K) Forecast, by Application 2020 & 2033
- Table 27: Argentina Area Rugs Revenue (undefined) Forecast, by Application 2020 & 2033
- Table 28: Argentina Area Rugs Volume (K) Forecast, by Application 2020 & 2033
- Table 29: Rest of South America Area Rugs Revenue (undefined) Forecast, by Application 2020 & 2033
- Table 30: Rest of South America Area Rugs Volume (K) Forecast, by Application 2020 & 2033
- Table 31: Global Area Rugs Revenue undefined Forecast, by Application 2020 & 2033
- Table 32: Global Area Rugs Volume K Forecast, by Application 2020 & 2033
- Table 33: Global Area Rugs Revenue undefined Forecast, by Types 2020 & 2033
- Table 34: Global Area Rugs Volume K Forecast, by Types 2020 & 2033
- Table 35: Global Area Rugs Revenue undefined Forecast, by Country 2020 & 2033
- Table 36: Global Area Rugs Volume K Forecast, by Country 2020 & 2033
- Table 37: United Kingdom Area Rugs Revenue (undefined) Forecast, by Application 2020 & 2033
- Table 38: United Kingdom Area Rugs Volume (K) Forecast, by Application 2020 & 2033
- Table 39: Germany Area Rugs Revenue (undefined) Forecast, by Application 2020 & 2033
- Table 40: Germany Area Rugs Volume (K) Forecast, by Application 2020 & 2033
- Table 41: France Area Rugs Revenue (undefined) Forecast, by Application 2020 & 2033
- Table 42: France Area Rugs Volume (K) Forecast, by Application 2020 & 2033
- Table 43: Italy Area Rugs Revenue (undefined) Forecast, by Application 2020 & 2033
- Table 44: Italy Area Rugs Volume (K) Forecast, by Application 2020 & 2033
- Table 45: Spain Area Rugs Revenue (undefined) Forecast, by Application 2020 & 2033
- Table 46: Spain Area Rugs Volume (K) Forecast, by Application 2020 & 2033
- Table 47: Russia Area Rugs Revenue (undefined) Forecast, by Application 2020 & 2033
- Table 48: Russia Area Rugs Volume (K) Forecast, by Application 2020 & 2033
- Table 49: Benelux Area Rugs Revenue (undefined) Forecast, by Application 2020 & 2033
- Table 50: Benelux Area Rugs Volume (K) Forecast, by Application 2020 & 2033
- Table 51: Nordics Area Rugs Revenue (undefined) Forecast, by Application 2020 & 2033
- Table 52: Nordics Area Rugs Volume (K) Forecast, by Application 2020 & 2033
- Table 53: Rest of Europe Area Rugs Revenue (undefined) Forecast, by Application 2020 & 2033
- Table 54: Rest of Europe Area Rugs Volume (K) Forecast, by Application 2020 & 2033
- Table 55: Global Area Rugs Revenue undefined Forecast, by Application 2020 & 2033
- Table 56: Global Area Rugs Volume K Forecast, by Application 2020 & 2033
- Table 57: Global Area Rugs Revenue undefined Forecast, by Types 2020 & 2033
- Table 58: Global Area Rugs Volume K Forecast, by Types 2020 & 2033
- Table 59: Global Area Rugs Revenue undefined Forecast, by Country 2020 & 2033
- Table 60: Global Area Rugs Volume K Forecast, by Country 2020 & 2033
- Table 61: Turkey Area Rugs Revenue (undefined) Forecast, by Application 2020 & 2033
- Table 62: Turkey Area Rugs Volume (K) Forecast, by Application 2020 & 2033
- Table 63: Israel Area Rugs Revenue (undefined) Forecast, by Application 2020 & 2033
- Table 64: Israel Area Rugs Volume (K) Forecast, by Application 2020 & 2033
- Table 65: GCC Area Rugs Revenue (undefined) Forecast, by Application 2020 & 2033
- Table 66: GCC Area Rugs Volume (K) Forecast, by Application 2020 & 2033
- Table 67: North Africa Area Rugs Revenue (undefined) Forecast, by Application 2020 & 2033
- Table 68: North Africa Area Rugs Volume (K) Forecast, by Application 2020 & 2033
- Table 69: South Africa Area Rugs Revenue (undefined) Forecast, by Application 2020 & 2033
- Table 70: South Africa Area Rugs Volume (K) Forecast, by Application 2020 & 2033
- Table 71: Rest of Middle East & Africa Area Rugs Revenue (undefined) Forecast, by Application 2020 & 2033
- Table 72: Rest of Middle East & Africa Area Rugs Volume (K) Forecast, by Application 2020 & 2033
- Table 73: Global Area Rugs Revenue undefined Forecast, by Application 2020 & 2033
- Table 74: Global Area Rugs Volume K Forecast, by Application 2020 & 2033
- Table 75: Global Area Rugs Revenue undefined Forecast, by Types 2020 & 2033
- Table 76: Global Area Rugs Volume K Forecast, by Types 2020 & 2033
- Table 77: Global Area Rugs Revenue undefined Forecast, by Country 2020 & 2033
- Table 78: Global Area Rugs Volume K Forecast, by Country 2020 & 2033
- Table 79: China Area Rugs Revenue (undefined) Forecast, by Application 2020 & 2033
- Table 80: China Area Rugs Volume (K) Forecast, by Application 2020 & 2033
- Table 81: India Area Rugs Revenue (undefined) Forecast, by Application 2020 & 2033
- Table 82: India Area Rugs Volume (K) Forecast, by Application 2020 & 2033
- Table 83: Japan Area Rugs Revenue (undefined) Forecast, by Application 2020 & 2033
- Table 84: Japan Area Rugs Volume (K) Forecast, by Application 2020 & 2033
- Table 85: South Korea Area Rugs Revenue (undefined) Forecast, by Application 2020 & 2033
- Table 86: South Korea Area Rugs Volume (K) Forecast, by Application 2020 & 2033
- Table 87: ASEAN Area Rugs Revenue (undefined) Forecast, by Application 2020 & 2033
- Table 88: ASEAN Area Rugs Volume (K) Forecast, by Application 2020 & 2033
- Table 89: Oceania Area Rugs Revenue (undefined) Forecast, by Application 2020 & 2033
- Table 90: Oceania Area Rugs Volume (K) Forecast, by Application 2020 & 2033
- Table 91: Rest of Asia Pacific Area Rugs Revenue (undefined) Forecast, by Application 2020 & 2033
- Table 92: Rest of Asia Pacific Area Rugs Volume (K) Forecast, by Application 2020 & 2033
Frequently Asked Questions
1. What is the projected Compound Annual Growth Rate (CAGR) of the Area Rugs?
The projected CAGR is approximately 5.65%.
2. Which companies are prominent players in the Area Rugs?
Key companies in the market include Balta Industries, Milliken & Company, Mohawk Industries, Nourison Industries, OW (Oriental Weavers), Shaw Industries, The Dixie Group.
3. What are the main segments of the Area Rugs?
The market segments include Application, Types.
4. Can you provide details about the market size?
The market size is estimated to be USD XXX N/A as of 2022.
5. What are some drivers contributing to market growth?
N/A
6. What are the notable trends driving market growth?
N/A
7. Are there any restraints impacting market growth?
N/A
8. Can you provide examples of recent developments in the market?
N/A
9. What pricing options are available for accessing the report?
Pricing options include single-user, multi-user, and enterprise licenses priced at USD 3350.00, USD 5025.00, and USD 6700.00 respectively.
10. Is the market size provided in terms of value or volume?
The market size is provided in terms of value, measured in N/A and volume, measured in K.
11. Are there any specific market keywords associated with the report?
Yes, the market keyword associated with the report is "Area Rugs," which aids in identifying and referencing the specific market segment covered.
12. How do I determine which pricing option suits my needs best?
The pricing options vary based on user requirements and access needs. Individual users may opt for single-user licenses, while businesses requiring broader access may choose multi-user or enterprise licenses for cost-effective access to the report.
13. Are there any additional resources or data provided in the Area Rugs report?
While the report offers comprehensive insights, it's advisable to review the specific contents or supplementary materials provided to ascertain if additional resources or data are available.
14. How can I stay updated on further developments or reports in the Area Rugs?
To stay informed about further developments, trends, and reports in the Area Rugs, consider subscribing to industry newsletters, following relevant companies and organizations, or regularly checking reputable industry news sources and publications.
Methodology
Step 1 - Identification of Relevant Samples Size from Population Database


Step 2 - Approaches for Defining Global Market Size (Value, Volume* & Price*)

Note*: In applicable scenarios
Step 3 - Data Sources
Primary Research
- Web Analytics
- Survey Reports
- Research Institute
- Latest Research Reports
- Opinion Leaders
Secondary Research
- Annual Reports
- White Paper
- Latest Press Release
- Industry Association
- Paid Database
- Investor Presentations

Step 4 - Data Triangulation
Involves using different sources of information in order to increase the validity of a study
These sources are likely to be stakeholders in a program - participants, other researchers, program staff, other community members, and so on.
Then we put all data in single framework & apply various statistical tools to find out the dynamic on the market.
During the analysis stage, feedback from the stakeholder groups would be compared to determine areas of agreement as well as areas of divergence