


Key Insights
The Artificial Intelligence (AI) in New Energy market is experiencing rapid growth, driven by the increasing need for efficient and sustainable energy solutions. The market, estimated at $5 billion in 2025, is projected to witness a robust Compound Annual Growth Rate (CAGR) of 25% from 2025 to 2033, reaching a valuation exceeding $25 billion by 2033. This expansion is fueled by several key factors. Firstly, the escalating demand for renewable energy sources like solar and wind necessitates intelligent grid management and predictive maintenance, areas where AI excels. AI-powered solutions optimize energy production, distribution, and consumption, leading to cost reductions and improved reliability. Secondly, advancements in machine learning and deep learning algorithms are enabling more accurate forecasting of energy demand and supply, minimizing energy waste and enhancing grid stability. Furthermore, the rising adoption of smart meters and sensors provides the necessary data for AI algorithms to function effectively, creating a positive feedback loop of innovation and adoption. Government initiatives promoting renewable energy and digitalization further contribute to market growth. However, challenges remain, including concerns about data security, the high initial investment costs associated with AI implementation, and the need for skilled professionals to manage and interpret AI-driven insights.

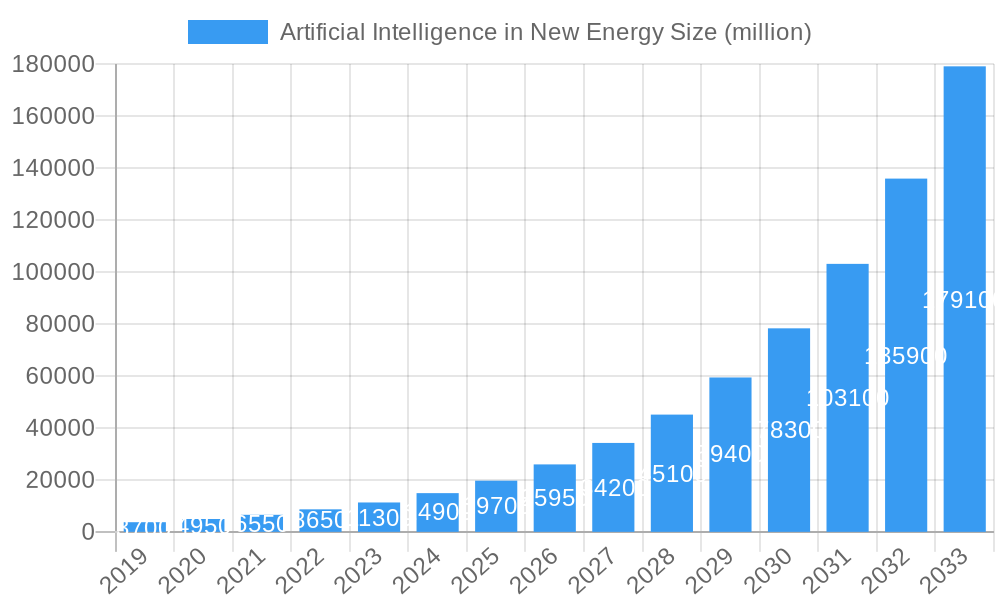
Artificial Intelligence in New Energy Market Size (In Billion)

Despite these restraints, the long-term outlook for AI in New Energy remains extremely positive. The market is segmented across various applications, including predictive maintenance for renewable energy assets, grid optimization, energy trading and demand-side management, and smart home energy management. Leading companies like C3.ai, AutoGrid, OpenAI, IBM Energy, and Google DeepMind are at the forefront of innovation, developing sophisticated AI solutions tailored to the unique challenges of the new energy landscape. The geographical distribution of the market is expected to be largely concentrated in North America and Europe initially, but significant growth is anticipated in Asia-Pacific and other regions as renewable energy adoption expands globally. Continued research and development in AI and related technologies will further drive innovation and accelerate market expansion in the coming years.
Artificial Intelligence in New Energy Company Market Share
This exhaustive report provides a detailed analysis of the Artificial Intelligence (AI) in New Energy market, projecting significant growth from $xx million in 2025 to $xx million by 2033, exhibiting a CAGR of xx%. The study period covers 2019-2033, with 2025 as the base and estimated year. This report is essential for investors, industry stakeholders, and strategists seeking a deep understanding of this rapidly evolving sector.
Artificial Intelligence in New Energy Market Concentration & Innovation
The AI in New Energy market exhibits a moderately concentrated landscape, with a few major players holding significant market share. Companies like C3.ai, AutoGrid, and OpenAI are at the forefront, driving innovation through advanced algorithms and platforms. However, numerous smaller, specialized firms contribute significantly to niche applications. The market share of the top 5 companies is estimated to be xx% in 2025, while the remaining xx% is shared by numerous smaller players. Innovation is fueled by increasing demand for efficient energy management, grid optimization, and renewable energy integration. Regulatory frameworks, particularly those promoting renewable energy adoption and grid modernization, are strong catalysts. The major substitutes to AI solutions are primarily traditional energy management systems, facing growing obsolescence due to AI's superior efficiency and predictive capabilities. End-user trends indicate a preference for AI-powered solutions due to their cost savings and improved reliability. M&A activity is robust, with deal values exceeding $xx million in the past five years, showcasing strong investor confidence and consolidation efforts. Key M&A deals included (example deal 1 and example deal 2 – include brief description and value).
- Market Concentration: Top 5 players hold xx% market share in 2025.
- M&A Activity: Total deal value exceeding $xx million (2019-2024).
- Innovation Drivers: Demand for efficient energy management, grid modernization, renewable energy integration.
- Regulatory Landscape: Supportive frameworks promoting renewable energy.
Artificial Intelligence in New Energy Industry Trends & Insights
The AI in New Energy market is experiencing exponential growth, driven by several key factors. The rising adoption of renewable energy sources, coupled with the need for efficient grid management and improved energy forecasting, fuels demand for AI-powered solutions. Technological disruptions, such as advancements in machine learning and deep learning, are continuously enhancing the capabilities of AI systems. Consumer preferences are shifting towards sustainable and cost-effective energy solutions, increasing the appeal of AI-driven technologies. The competitive dynamics are characterized by both collaboration and competition, with established players forging partnerships with startups to leverage specialized expertise and accelerate innovation. Market penetration is expected to reach xx% by 2033. The market is poised for substantial growth with a projected Compound Annual Growth Rate (CAGR) of xx% during the forecast period (2025-2033). This robust growth is supported by government incentives, technological advancements, and growing consumer awareness of sustainability.
Dominant Markets & Segments in Artificial Intelligence in New Energy
The North American region currently dominates the AI in New Energy market, driven by significant investments in renewable energy infrastructure and supportive government policies. The United States holds the largest market share, followed by Canada and Mexico. Europe holds a significant share, with key players concentrated in Germany, the UK, and France. The Asia-Pacific region shows strong potential for growth, driven by increasing energy demand and government initiatives focused on renewable energy development. The dominant segments include grid optimization, predictive maintenance, and energy forecasting.
- North America: Strong investment in renewable energy infrastructure, supportive policies.
- Europe: Significant market share held by Germany, UK, and France.
- Asia-Pacific: High growth potential, driven by energy demand and government initiatives.
- Dominant Segments: Grid optimization, predictive maintenance, energy forecasting.
Dominance Analysis: North America's dominance stems from early adoption of AI technologies in the energy sector, substantial R&D investments, and a strong regulatory framework that incentivizes renewable energy integration. However, the Asia-Pacific region is projected to show the fastest growth rate in the coming years due to large-scale investments in renewable energy infrastructure and government support for technological adoption.
Artificial Intelligence in New Energy Product Developments
Recent product innovations encompass advanced algorithms for improved grid stability, predictive maintenance solutions for minimizing downtime in renewable energy assets, and AI-powered platforms optimizing energy consumption in smart grids. The competitive advantage lies in achieving higher accuracy, faster processing speeds, and reduced operational costs compared to traditional methods. These advancements are revolutionizing the energy sector, fostering greater efficiency, reliability, and sustainability.
Report Scope & Segmentation Analysis
The report segments the AI in New Energy market by technology (machine learning, deep learning, natural language processing), application (grid management, renewable energy integration, energy forecasting), and geography (North America, Europe, Asia-Pacific, and Rest of the World). Each segment presents unique growth trajectories and competitive landscapes. For example, the machine learning segment is expected to dominate due to its versatility, while the grid management application segment shows strong growth potential given rising demand for efficient and reliable electricity grids. Market sizes for each segment are provided for 2025 and forecasted until 2033.
Key Drivers of Artificial Intelligence in New Energy Growth
Several factors drive the growth of the AI in New Energy market. Technological advancements in AI and machine learning algorithms are crucial, leading to more accurate predictions and better decision-making. Government policies promoting renewable energy adoption and grid modernization significantly influence market growth. Economic factors like the increasing cost of fossil fuels and the need for cost-effective energy solutions also contribute. For instance, the substantial investments made by governments worldwide in smart grid infrastructure are driving significant growth within this sector.
Challenges in the Artificial Intelligence in New Energy Sector
Challenges include the high initial investment costs associated with AI implementation, concerns regarding data security and privacy, and the need for skilled professionals to manage and maintain complex AI systems. Regulatory hurdles in certain regions could hamper adoption, while ensuring data quality and reliability remains a constant challenge. Supply chain disruptions can affect the availability of necessary hardware and software components. These factors could significantly impact the overall growth trajectory of the sector if not properly addressed. For example, a delay in regulatory approvals could hinder the deployment of AI-powered solutions in specific applications.
Emerging Opportunities in Artificial Intelligence in New Energy
Emerging opportunities encompass the integration of AI with other technologies, such as blockchain and IoT, to enhance grid security and transparency. New markets, such as microgrids and distributed energy resources, present promising growth avenues. The development of more sophisticated AI algorithms for improved forecasting and optimization of renewable energy resources offers significant opportunities. Growing consumer awareness of sustainable energy solutions and increasing demand for energy efficiency fuels further market expansion.
Leading Players in the Artificial Intelligence in New Energy Market
- C3.ai
- AutoGrid
- OpenAI
- IBM Energy
- Sentient Energy
- Google Deepmind
- Enbala
- Grid4C
- Heliogen
- Next Kraftwerke
- Opus One Solutions
- PowerScout
- Siemens Energy
- Verdigris
- WattTime
Key Developments in Artificial Intelligence in New Energy Industry
- 2022-Q4: C3.ai launched a new AI-powered platform for grid optimization.
- 2023-Q1: AutoGrid secured a major contract for deploying AI-based energy management systems.
- 2023-Q2: (Include additional key developments with year/month and brief impact description).
- 2024-Q3: (Include additional key developments with year/month and brief impact description).
Strategic Outlook for Artificial Intelligence in New Energy Market
The AI in New Energy market is poised for substantial growth, driven by increasing demand for efficient and sustainable energy solutions. Continued technological advancements and supportive government policies will further fuel market expansion. The integration of AI with other innovative technologies will unlock new applications and market opportunities. Early adoption of AI-based solutions by energy companies and utilities will offer significant competitive advantages, shaping the future of the energy landscape.
Artificial Intelligence in New Energy Segmentation
-
1. Application
- 1.1. Solar PV Design
- 1.2. Energy Storage Optimization
- 1.3. Wind Farm Operations
- 1.4. Smart Grid Management
- 1.5. Others
-
2. Types
- 2.1. Hardware
- 2.2. Software
- 2.3. Service
Artificial Intelligence in New Energy Segmentation By Geography
-
1. North America
- 1.1. United States
- 1.2. Canada
- 1.3. Mexico
-
2. South America
- 2.1. Brazil
- 2.2. Argentina
- 2.3. Rest of South America
-
3. Europe
- 3.1. United Kingdom
- 3.2. Germany
- 3.3. France
- 3.4. Italy
- 3.5. Spain
- 3.6. Russia
- 3.7. Benelux
- 3.8. Nordics
- 3.9. Rest of Europe
-
4. Middle East & Africa
- 4.1. Turkey
- 4.2. Israel
- 4.3. GCC
- 4.4. North Africa
- 4.5. South Africa
- 4.6. Rest of Middle East & Africa
-
5. Asia Pacific
- 5.1. China
- 5.2. India
- 5.3. Japan
- 5.4. South Korea
- 5.5. ASEAN
- 5.6. Oceania
- 5.7. Rest of Asia Pacific

Artificial Intelligence in New Energy Regional Market Share
Geographic Coverage of Artificial Intelligence in New Energy
Artificial Intelligence in New Energy REPORT HIGHLIGHTS
| Aspects | Details |
|---|---|
| Study Period | 2020-2034 |
| Base Year | 2025 |
| Estimated Year | 2026 |
| Forecast Period | 2026-2034 |
| Historical Period | 2020-2025 |
| Growth Rate | CAGR of 30.2% from 2020-2034 |
| Segmentation |
|
Table of Contents
- 1. Introduction
- 1.1. Research Scope
- 1.2. Market Segmentation
- 1.3. Research Methodology
- 1.4. Definitions and Assumptions
- 2. Executive Summary
- 2.1. Introduction
- 3. Market Dynamics
- 3.1. Introduction
- 3.2. Market Drivers
- 3.3. Market Restrains
- 3.4. Market Trends
- 4. Market Factor Analysis
- 4.1. Porters Five Forces
- 4.2. Supply/Value Chain
- 4.3. PESTEL analysis
- 4.4. Market Entropy
- 4.5. Patent/Trademark Analysis
- 5. Global Artificial Intelligence in New Energy Analysis, Insights and Forecast, 2020-2032
- 5.1. Market Analysis, Insights and Forecast - by Application
- 5.1.1. Solar PV Design
- 5.1.2. Energy Storage Optimization
- 5.1.3. Wind Farm Operations
- 5.1.4. Smart Grid Management
- 5.1.5. Others
- 5.2. Market Analysis, Insights and Forecast - by Types
- 5.2.1. Hardware
- 5.2.2. Software
- 5.2.3. Service
- 5.3. Market Analysis, Insights and Forecast - by Region
- 5.3.1. North America
- 5.3.2. South America
- 5.3.3. Europe
- 5.3.4. Middle East & Africa
- 5.3.5. Asia Pacific
- 5.1. Market Analysis, Insights and Forecast - by Application
- 6. North America Artificial Intelligence in New Energy Analysis, Insights and Forecast, 2020-2032
- 6.1. Market Analysis, Insights and Forecast - by Application
- 6.1.1. Solar PV Design
- 6.1.2. Energy Storage Optimization
- 6.1.3. Wind Farm Operations
- 6.1.4. Smart Grid Management
- 6.1.5. Others
- 6.2. Market Analysis, Insights and Forecast - by Types
- 6.2.1. Hardware
- 6.2.2. Software
- 6.2.3. Service
- 6.1. Market Analysis, Insights and Forecast - by Application
- 7. South America Artificial Intelligence in New Energy Analysis, Insights and Forecast, 2020-2032
- 7.1. Market Analysis, Insights and Forecast - by Application
- 7.1.1. Solar PV Design
- 7.1.2. Energy Storage Optimization
- 7.1.3. Wind Farm Operations
- 7.1.4. Smart Grid Management
- 7.1.5. Others
- 7.2. Market Analysis, Insights and Forecast - by Types
- 7.2.1. Hardware
- 7.2.2. Software
- 7.2.3. Service
- 7.1. Market Analysis, Insights and Forecast - by Application
- 8. Europe Artificial Intelligence in New Energy Analysis, Insights and Forecast, 2020-2032
- 8.1. Market Analysis, Insights and Forecast - by Application
- 8.1.1. Solar PV Design
- 8.1.2. Energy Storage Optimization
- 8.1.3. Wind Farm Operations
- 8.1.4. Smart Grid Management
- 8.1.5. Others
- 8.2. Market Analysis, Insights and Forecast - by Types
- 8.2.1. Hardware
- 8.2.2. Software
- 8.2.3. Service
- 8.1. Market Analysis, Insights and Forecast - by Application
- 9. Middle East & Africa Artificial Intelligence in New Energy Analysis, Insights and Forecast, 2020-2032
- 9.1. Market Analysis, Insights and Forecast - by Application
- 9.1.1. Solar PV Design
- 9.1.2. Energy Storage Optimization
- 9.1.3. Wind Farm Operations
- 9.1.4. Smart Grid Management
- 9.1.5. Others
- 9.2. Market Analysis, Insights and Forecast - by Types
- 9.2.1. Hardware
- 9.2.2. Software
- 9.2.3. Service
- 9.1. Market Analysis, Insights and Forecast - by Application
- 10. Asia Pacific Artificial Intelligence in New Energy Analysis, Insights and Forecast, 2020-2032
- 10.1. Market Analysis, Insights and Forecast - by Application
- 10.1.1. Solar PV Design
- 10.1.2. Energy Storage Optimization
- 10.1.3. Wind Farm Operations
- 10.1.4. Smart Grid Management
- 10.1.5. Others
- 10.2. Market Analysis, Insights and Forecast - by Types
- 10.2.1. Hardware
- 10.2.2. Software
- 10.2.3. Service
- 10.1. Market Analysis, Insights and Forecast - by Application
- 11. Competitive Analysis
- 11.1. Global Market Share Analysis 2025
- 11.2. Company Profiles
- 11.2.1 C3.ai
- 11.2.1.1. Overview
- 11.2.1.2. Products
- 11.2.1.3. SWOT Analysis
- 11.2.1.4. Recent Developments
- 11.2.1.5. Financials (Based on Availability)
- 11.2.2 AutoGrid
- 11.2.2.1. Overview
- 11.2.2.2. Products
- 11.2.2.3. SWOT Analysis
- 11.2.2.4. Recent Developments
- 11.2.2.5. Financials (Based on Availability)
- 11.2.3 OpenAI
- 11.2.3.1. Overview
- 11.2.3.2. Products
- 11.2.3.3. SWOT Analysis
- 11.2.3.4. Recent Developments
- 11.2.3.5. Financials (Based on Availability)
- 11.2.4 IBM Energy
- 11.2.4.1. Overview
- 11.2.4.2. Products
- 11.2.4.3. SWOT Analysis
- 11.2.4.4. Recent Developments
- 11.2.4.5. Financials (Based on Availability)
- 11.2.5 Sentient Energy
- 11.2.5.1. Overview
- 11.2.5.2. Products
- 11.2.5.3. SWOT Analysis
- 11.2.5.4. Recent Developments
- 11.2.5.5. Financials (Based on Availability)
- 11.2.6 Google Deepmind
- 11.2.6.1. Overview
- 11.2.6.2. Products
- 11.2.6.3. SWOT Analysis
- 11.2.6.4. Recent Developments
- 11.2.6.5. Financials (Based on Availability)
- 11.2.7 Enbala
- 11.2.7.1. Overview
- 11.2.7.2. Products
- 11.2.7.3. SWOT Analysis
- 11.2.7.4. Recent Developments
- 11.2.7.5. Financials (Based on Availability)
- 11.2.8 Grid4C
- 11.2.8.1. Overview
- 11.2.8.2. Products
- 11.2.8.3. SWOT Analysis
- 11.2.8.4. Recent Developments
- 11.2.8.5. Financials (Based on Availability)
- 11.2.9 Heliogen
- 11.2.9.1. Overview
- 11.2.9.2. Products
- 11.2.9.3. SWOT Analysis
- 11.2.9.4. Recent Developments
- 11.2.9.5. Financials (Based on Availability)
- 11.2.10 Next Kraftwerke
- 11.2.10.1. Overview
- 11.2.10.2. Products
- 11.2.10.3. SWOT Analysis
- 11.2.10.4. Recent Developments
- 11.2.10.5. Financials (Based on Availability)
- 11.2.11 Opus One Solutions
- 11.2.11.1. Overview
- 11.2.11.2. Products
- 11.2.11.3. SWOT Analysis
- 11.2.11.4. Recent Developments
- 11.2.11.5. Financials (Based on Availability)
- 11.2.12 PowerScout
- 11.2.12.1. Overview
- 11.2.12.2. Products
- 11.2.12.3. SWOT Analysis
- 11.2.12.4. Recent Developments
- 11.2.12.5. Financials (Based on Availability)
- 11.2.13 Siemens Energy
- 11.2.13.1. Overview
- 11.2.13.2. Products
- 11.2.13.3. SWOT Analysis
- 11.2.13.4. Recent Developments
- 11.2.13.5. Financials (Based on Availability)
- 11.2.14 Verdigris
- 11.2.14.1. Overview
- 11.2.14.2. Products
- 11.2.14.3. SWOT Analysis
- 11.2.14.4. Recent Developments
- 11.2.14.5. Financials (Based on Availability)
- 11.2.15 WattTime
- 11.2.15.1. Overview
- 11.2.15.2. Products
- 11.2.15.3. SWOT Analysis
- 11.2.15.4. Recent Developments
- 11.2.15.5. Financials (Based on Availability)
- 11.2.1 C3.ai
List of Figures
- Figure 1: Global Artificial Intelligence in New Energy Revenue Breakdown (undefined, %) by Region 2025 & 2033
- Figure 2: North America Artificial Intelligence in New Energy Revenue (undefined), by Application 2025 & 2033
- Figure 3: North America Artificial Intelligence in New Energy Revenue Share (%), by Application 2025 & 2033
- Figure 4: North America Artificial Intelligence in New Energy Revenue (undefined), by Types 2025 & 2033
- Figure 5: North America Artificial Intelligence in New Energy Revenue Share (%), by Types 2025 & 2033
- Figure 6: North America Artificial Intelligence in New Energy Revenue (undefined), by Country 2025 & 2033
- Figure 7: North America Artificial Intelligence in New Energy Revenue Share (%), by Country 2025 & 2033
- Figure 8: South America Artificial Intelligence in New Energy Revenue (undefined), by Application 2025 & 2033
- Figure 9: South America Artificial Intelligence in New Energy Revenue Share (%), by Application 2025 & 2033
- Figure 10: South America Artificial Intelligence in New Energy Revenue (undefined), by Types 2025 & 2033
- Figure 11: South America Artificial Intelligence in New Energy Revenue Share (%), by Types 2025 & 2033
- Figure 12: South America Artificial Intelligence in New Energy Revenue (undefined), by Country 2025 & 2033
- Figure 13: South America Artificial Intelligence in New Energy Revenue Share (%), by Country 2025 & 2033
- Figure 14: Europe Artificial Intelligence in New Energy Revenue (undefined), by Application 2025 & 2033
- Figure 15: Europe Artificial Intelligence in New Energy Revenue Share (%), by Application 2025 & 2033
- Figure 16: Europe Artificial Intelligence in New Energy Revenue (undefined), by Types 2025 & 2033
- Figure 17: Europe Artificial Intelligence in New Energy Revenue Share (%), by Types 2025 & 2033
- Figure 18: Europe Artificial Intelligence in New Energy Revenue (undefined), by Country 2025 & 2033
- Figure 19: Europe Artificial Intelligence in New Energy Revenue Share (%), by Country 2025 & 2033
- Figure 20: Middle East & Africa Artificial Intelligence in New Energy Revenue (undefined), by Application 2025 & 2033
- Figure 21: Middle East & Africa Artificial Intelligence in New Energy Revenue Share (%), by Application 2025 & 2033
- Figure 22: Middle East & Africa Artificial Intelligence in New Energy Revenue (undefined), by Types 2025 & 2033
- Figure 23: Middle East & Africa Artificial Intelligence in New Energy Revenue Share (%), by Types 2025 & 2033
- Figure 24: Middle East & Africa Artificial Intelligence in New Energy Revenue (undefined), by Country 2025 & 2033
- Figure 25: Middle East & Africa Artificial Intelligence in New Energy Revenue Share (%), by Country 2025 & 2033
- Figure 26: Asia Pacific Artificial Intelligence in New Energy Revenue (undefined), by Application 2025 & 2033
- Figure 27: Asia Pacific Artificial Intelligence in New Energy Revenue Share (%), by Application 2025 & 2033
- Figure 28: Asia Pacific Artificial Intelligence in New Energy Revenue (undefined), by Types 2025 & 2033
- Figure 29: Asia Pacific Artificial Intelligence in New Energy Revenue Share (%), by Types 2025 & 2033
- Figure 30: Asia Pacific Artificial Intelligence in New Energy Revenue (undefined), by Country 2025 & 2033
- Figure 31: Asia Pacific Artificial Intelligence in New Energy Revenue Share (%), by Country 2025 & 2033
List of Tables
- Table 1: Global Artificial Intelligence in New Energy Revenue undefined Forecast, by Application 2020 & 2033
- Table 2: Global Artificial Intelligence in New Energy Revenue undefined Forecast, by Types 2020 & 2033
- Table 3: Global Artificial Intelligence in New Energy Revenue undefined Forecast, by Region 2020 & 2033
- Table 4: Global Artificial Intelligence in New Energy Revenue undefined Forecast, by Application 2020 & 2033
- Table 5: Global Artificial Intelligence in New Energy Revenue undefined Forecast, by Types 2020 & 2033
- Table 6: Global Artificial Intelligence in New Energy Revenue undefined Forecast, by Country 2020 & 2033
- Table 7: United States Artificial Intelligence in New Energy Revenue (undefined) Forecast, by Application 2020 & 2033
- Table 8: Canada Artificial Intelligence in New Energy Revenue (undefined) Forecast, by Application 2020 & 2033
- Table 9: Mexico Artificial Intelligence in New Energy Revenue (undefined) Forecast, by Application 2020 & 2033
- Table 10: Global Artificial Intelligence in New Energy Revenue undefined Forecast, by Application 2020 & 2033
- Table 11: Global Artificial Intelligence in New Energy Revenue undefined Forecast, by Types 2020 & 2033
- Table 12: Global Artificial Intelligence in New Energy Revenue undefined Forecast, by Country 2020 & 2033
- Table 13: Brazil Artificial Intelligence in New Energy Revenue (undefined) Forecast, by Application 2020 & 2033
- Table 14: Argentina Artificial Intelligence in New Energy Revenue (undefined) Forecast, by Application 2020 & 2033
- Table 15: Rest of South America Artificial Intelligence in New Energy Revenue (undefined) Forecast, by Application 2020 & 2033
- Table 16: Global Artificial Intelligence in New Energy Revenue undefined Forecast, by Application 2020 & 2033
- Table 17: Global Artificial Intelligence in New Energy Revenue undefined Forecast, by Types 2020 & 2033
- Table 18: Global Artificial Intelligence in New Energy Revenue undefined Forecast, by Country 2020 & 2033
- Table 19: United Kingdom Artificial Intelligence in New Energy Revenue (undefined) Forecast, by Application 2020 & 2033
- Table 20: Germany Artificial Intelligence in New Energy Revenue (undefined) Forecast, by Application 2020 & 2033
- Table 21: France Artificial Intelligence in New Energy Revenue (undefined) Forecast, by Application 2020 & 2033
- Table 22: Italy Artificial Intelligence in New Energy Revenue (undefined) Forecast, by Application 2020 & 2033
- Table 23: Spain Artificial Intelligence in New Energy Revenue (undefined) Forecast, by Application 2020 & 2033
- Table 24: Russia Artificial Intelligence in New Energy Revenue (undefined) Forecast, by Application 2020 & 2033
- Table 25: Benelux Artificial Intelligence in New Energy Revenue (undefined) Forecast, by Application 2020 & 2033
- Table 26: Nordics Artificial Intelligence in New Energy Revenue (undefined) Forecast, by Application 2020 & 2033
- Table 27: Rest of Europe Artificial Intelligence in New Energy Revenue (undefined) Forecast, by Application 2020 & 2033
- Table 28: Global Artificial Intelligence in New Energy Revenue undefined Forecast, by Application 2020 & 2033
- Table 29: Global Artificial Intelligence in New Energy Revenue undefined Forecast, by Types 2020 & 2033
- Table 30: Global Artificial Intelligence in New Energy Revenue undefined Forecast, by Country 2020 & 2033
- Table 31: Turkey Artificial Intelligence in New Energy Revenue (undefined) Forecast, by Application 2020 & 2033
- Table 32: Israel Artificial Intelligence in New Energy Revenue (undefined) Forecast, by Application 2020 & 2033
- Table 33: GCC Artificial Intelligence in New Energy Revenue (undefined) Forecast, by Application 2020 & 2033
- Table 34: North Africa Artificial Intelligence in New Energy Revenue (undefined) Forecast, by Application 2020 & 2033
- Table 35: South Africa Artificial Intelligence in New Energy Revenue (undefined) Forecast, by Application 2020 & 2033
- Table 36: Rest of Middle East & Africa Artificial Intelligence in New Energy Revenue (undefined) Forecast, by Application 2020 & 2033
- Table 37: Global Artificial Intelligence in New Energy Revenue undefined Forecast, by Application 2020 & 2033
- Table 38: Global Artificial Intelligence in New Energy Revenue undefined Forecast, by Types 2020 & 2033
- Table 39: Global Artificial Intelligence in New Energy Revenue undefined Forecast, by Country 2020 & 2033
- Table 40: China Artificial Intelligence in New Energy Revenue (undefined) Forecast, by Application 2020 & 2033
- Table 41: India Artificial Intelligence in New Energy Revenue (undefined) Forecast, by Application 2020 & 2033
- Table 42: Japan Artificial Intelligence in New Energy Revenue (undefined) Forecast, by Application 2020 & 2033
- Table 43: South Korea Artificial Intelligence in New Energy Revenue (undefined) Forecast, by Application 2020 & 2033
- Table 44: ASEAN Artificial Intelligence in New Energy Revenue (undefined) Forecast, by Application 2020 & 2033
- Table 45: Oceania Artificial Intelligence in New Energy Revenue (undefined) Forecast, by Application 2020 & 2033
- Table 46: Rest of Asia Pacific Artificial Intelligence in New Energy Revenue (undefined) Forecast, by Application 2020 & 2033
Frequently Asked Questions
1. What is the projected Compound Annual Growth Rate (CAGR) of the Artificial Intelligence in New Energy?
The projected CAGR is approximately 30.2%.
2. Which companies are prominent players in the Artificial Intelligence in New Energy?
Key companies in the market include C3.ai, AutoGrid, OpenAI, IBM Energy, Sentient Energy, Google Deepmind, Enbala, Grid4C, Heliogen, Next Kraftwerke, Opus One Solutions, PowerScout, Siemens Energy, Verdigris, WattTime.
3. What are the main segments of the Artificial Intelligence in New Energy?
The market segments include Application, Types.
4. Can you provide details about the market size?
The market size is estimated to be USD XXX N/A as of 2022.
5. What are some drivers contributing to market growth?
N/A
6. What are the notable trends driving market growth?
N/A
7. Are there any restraints impacting market growth?
N/A
8. Can you provide examples of recent developments in the market?
N/A
9. What pricing options are available for accessing the report?
Pricing options include single-user, multi-user, and enterprise licenses priced at USD 3350.00, USD 5025.00, and USD 6700.00 respectively.
10. Is the market size provided in terms of value or volume?
The market size is provided in terms of value, measured in N/A.
11. Are there any specific market keywords associated with the report?
Yes, the market keyword associated with the report is "Artificial Intelligence in New Energy," which aids in identifying and referencing the specific market segment covered.
12. How do I determine which pricing option suits my needs best?
The pricing options vary based on user requirements and access needs. Individual users may opt for single-user licenses, while businesses requiring broader access may choose multi-user or enterprise licenses for cost-effective access to the report.
13. Are there any additional resources or data provided in the Artificial Intelligence in New Energy report?
While the report offers comprehensive insights, it's advisable to review the specific contents or supplementary materials provided to ascertain if additional resources or data are available.
14. How can I stay updated on further developments or reports in the Artificial Intelligence in New Energy?
To stay informed about further developments, trends, and reports in the Artificial Intelligence in New Energy, consider subscribing to industry newsletters, following relevant companies and organizations, or regularly checking reputable industry news sources and publications.
Methodology
Step 1 - Identification of Relevant Samples Size from Population Database


Step 2 - Approaches for Defining Global Market Size (Value, Volume* & Price*)

Note*: In applicable scenarios
Step 3 - Data Sources
Primary Research
- Web Analytics
- Survey Reports
- Research Institute
- Latest Research Reports
- Opinion Leaders
Secondary Research
- Annual Reports
- White Paper
- Latest Press Release
- Industry Association
- Paid Database
- Investor Presentations

Step 4 - Data Triangulation
Involves using different sources of information in order to increase the validity of a study
These sources are likely to be stakeholders in a program - participants, other researchers, program staff, other community members, and so on.
Then we put all data in single framework & apply various statistical tools to find out the dynamic on the market.
During the analysis stage, feedback from the stakeholder groups would be compared to determine areas of agreement as well as areas of divergence