

Key Insights
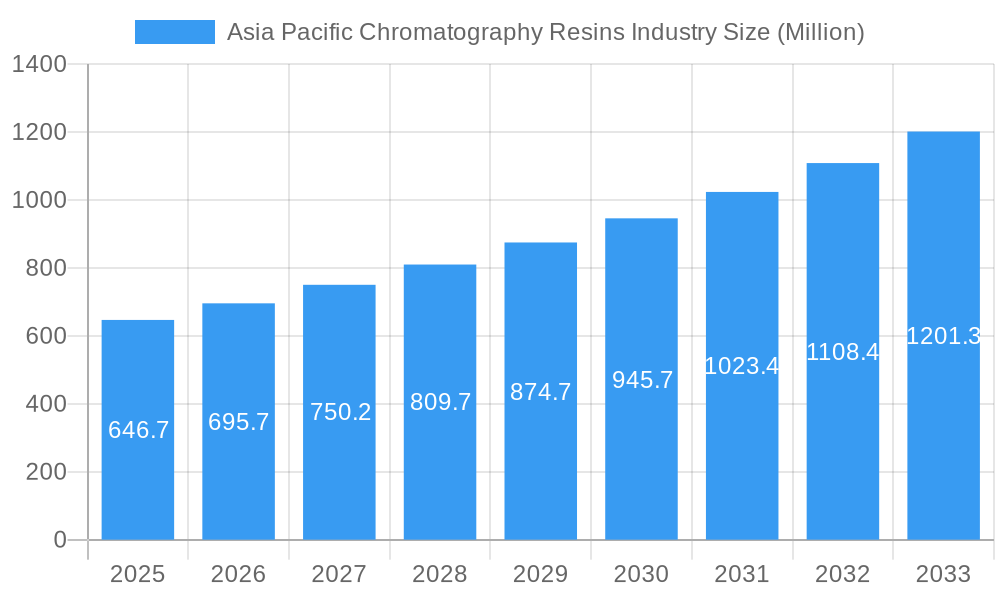
The Asia Pacific chromatography resins market, valued at $646.7 million in 2025, is projected to experience robust growth, driven by a compound annual growth rate (CAGR) exceeding 7% from 2025 to 2033. This expansion is fueled by several key factors. The burgeoning pharmaceutical and biotechnology sectors in countries like China, India, Japan, and South Korea are significantly increasing demand for high-purity compounds, necessitating advanced separation technologies like chromatography. Furthermore, the rising prevalence of chronic diseases and the consequent surge in drug discovery and development activities are bolstering market growth. Stringent regulatory requirements for drug purity and safety are also compelling pharmaceutical companies to adopt superior chromatography techniques and high-quality resins. The increasing adoption of advanced chromatography technologies like ion exchange, affinity, and size exclusion chromatography, alongside the growing preference for natural-based resins over synthetic ones due to biocompatibility concerns, further contributes to market expansion. The market is segmented by resin type (natural vs. synthetic), technology, and end-user industry (pharmaceuticals, food and beverages, etc.). Within the Asia Pacific region, China, India, and Japan are expected to be the major contributors to market growth, driven by their large pharmaceutical industries and expanding research and development capabilities.
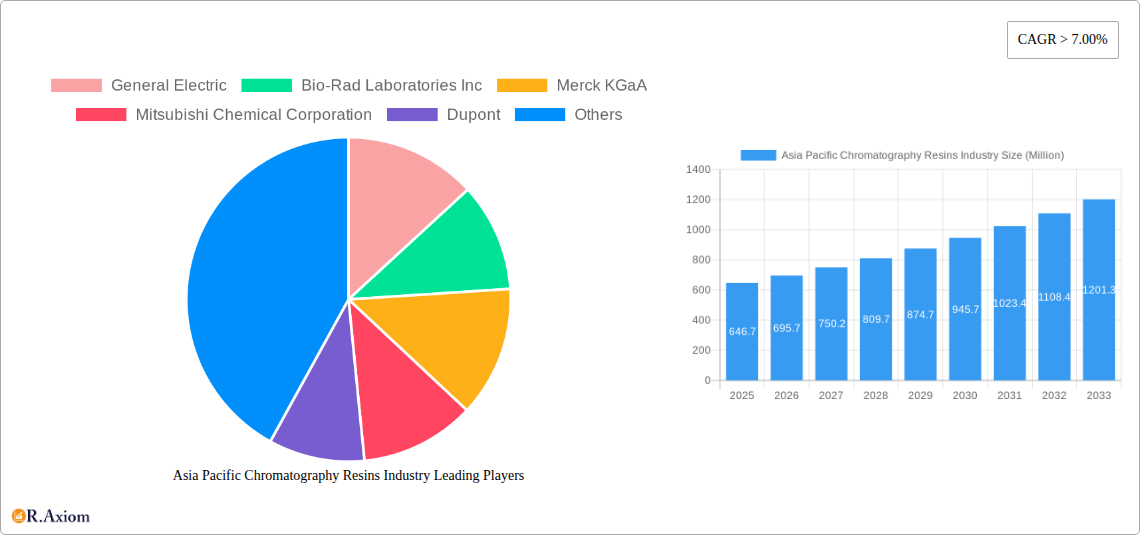
Asia Pacific Chromatography Resins Industry Market Size (In Million)
The competitive landscape is characterized by a mix of established global players and regional manufacturers. Companies like General Electric, Bio-Rad Laboratories, Merck KGaA, and others are actively investing in research and development to enhance resin performance and expand their product portfolios. These companies are also focusing on strategic partnerships and acquisitions to strengthen their market positions. However, the market faces challenges such as fluctuating raw material prices, intense competition, and the need for continuous technological innovation to meet evolving industry demands. Despite these challenges, the long-term outlook for the Asia Pacific chromatography resins market remains positive, with continued growth driven by the factors mentioned above. The focus on developing cost-effective, high-performance resins will be critical for sustaining this growth trajectory in the coming years.
Asia Pacific Chromatography Resins Industry Company Market Share
Asia Pacific Chromatography Resins Industry: A Comprehensive Market Analysis (2019-2033)
This in-depth report provides a comprehensive analysis of the Asia Pacific Chromatography Resins market, offering valuable insights for industry stakeholders, investors, and strategic decision-makers. Covering the period from 2019 to 2033, with a base year of 2025, this report meticulously examines market dynamics, growth drivers, challenges, and emerging opportunities. The report utilizes data from the historical period (2019-2024) to project market trends up to 2033.
Asia Pacific Chromatography Resins Industry Market Concentration & Innovation
The Asia Pacific chromatography resins market exhibits a moderately concentrated landscape, with key players such as General Electric, Bio-Rad Laboratories Inc, Merck KGaA, Mitsubishi Chemical Corporation, DuPont, Pall Corporation, Tosoh Bioscience LLC, Purolite, Agilent Technologies, Avantor Inc, and Thermo Fisher Scientific holding significant market share. However, the presence of numerous smaller players and emerging companies indicates a dynamic competitive environment. Market share data for 2025 estimates that the top 5 players collectively hold approximately XX% of the market, while the remaining share is distributed among smaller players and niche providers.
Innovation in the industry is driven by the increasing demand for high-performance resins with improved selectivity, efficiency, and scalability. This is particularly evident in the development of novel materials and advanced technologies like monolithic columns and magnetic beads. Regulatory frameworks, including those related to drug safety and environmental protection, significantly influence product development and market access. The presence of substitute technologies, such as electrophoresis and mass spectrometry, necessitates continuous innovation to maintain a competitive edge. Furthermore, end-user trends towards automation and miniaturization of chromatographic processes are driving demand for advanced resins. Recent M&A activities, though not publicly disclosed with specific deal values in all cases, are indicative of industry consolidation and efforts to broaden product portfolios and expand market reach. For example, XX major acquisitions within the last 5 years have involved companies focusing on this sector.
Asia Pacific Chromatography Resins Industry Industry Trends & Insights
The Asia Pacific chromatography resins market is projected to experience robust growth during the forecast period (2025-2033), with a CAGR of XX%. This growth is primarily fueled by the burgeoning pharmaceutical and biotechnology industries in the region, coupled with increasing investments in research and development. Technological advancements, particularly in the development of high-performance resins with improved selectivity and efficiency, are significantly contributing to market expansion. Growing consumer demand for high-quality, safe food and beverages is driving adoption of chromatography resins in the food and beverage sector. The competitive landscape is characterized by both intense rivalry among established players and the emergence of new entrants offering innovative solutions. Market penetration of advanced chromatography technologies, such as affinity chromatography, is increasing steadily, driven by the growing need for efficient purification and separation processes. These factors are propelling market growth, further accelerated by rising government investments and supportive regulatory environments in several key Asia-Pacific countries.
Dominant Markets & Segments in Asia Pacific Chromatography Resins Industry
The pharmaceutical sector is the dominant end-user industry for chromatography resins in the Asia Pacific region, accounting for approximately XX% of the total market in 2025. This dominance is driven by the increasing demand for high-purity pharmaceutical products and the stringent regulatory requirements for drug manufacturing.
- Key Drivers for Pharmaceutical Dominance:
- Rapid growth of the pharmaceutical industry in several Asian countries.
- Increasing demand for biologics and biosimilars.
- Stringent regulatory guidelines for drug purity and safety.
- Significant investments in R&D by pharmaceutical companies.
Within the technology segment, Ion Exchange Chromatography Resins hold the largest market share due to their wide applicability and cost-effectiveness. The synthetic-based (dextran) resins segment also holds a significant market share due to their superior performance characteristics. China and India are the leading countries in the region, contributing significantly to overall market growth. This growth is fueled by robust economic growth, a large and expanding population, improving healthcare infrastructure, and increasing government investments in healthcare and biotechnology.
Asia Pacific Chromatography Resins Industry Product Developments
Recent product innovations focus on enhancing resin performance through improved selectivity, efficiency, and durability. The introduction of novel materials, such as monolithic columns and magnetic beads, is transforming chromatographic techniques. This allows for higher throughput, reduced processing time, and increased automation. Companies are also focusing on developing customized resins tailored to specific applications to enhance market fit and gain a competitive advantage. Emphasis is placed on eco-friendly and sustainable resin production methods to satisfy growing environmental concerns.
Report Scope & Segmentation Analysis
This report segments the Asia Pacific chromatography resins market based on:
End-user Industry: Pharmaceuticals, Drug Production, Water and Environmental Agencies, Food and Beverages, Other End-user Industries. The pharmaceutical segment demonstrates the highest growth, driven by the rise of biologics.
Origin: Natural-based and Synthetic-based (Dextran). Synthetic-based resins exhibit higher growth potential due to their superior performance.
Technology: Ion Exchange Chromatography Resins, Affinity Chromatography Resins, Size Exclusion Chromatography Resins, Hydrophobic Interaction Chromatography Resins, and Other Technologies. Ion Exchange Chromatography remains the dominant technology, but other segments are showing faster growth.
Each segment's growth is projected based on factors such as technological advancements, regulatory changes, and end-user demand. Competitive dynamics within each segment are also analyzed, examining market share distribution and competitive strategies.
Key Drivers of Asia Pacific Chromatography Resins Industry Growth
The Asia Pacific chromatography resins market is driven by several factors. The burgeoning pharmaceutical and biotechnology industries are primary contributors, demanding high-purity products. Government initiatives promoting healthcare and R&D further fuel market expansion. Increasing focus on food safety and environmental regulations boosts demand in related sectors. Technological advancements, particularly in high-performance resins, improve efficiency and selectivity, further accelerating market growth.
Challenges in the Asia Pacific Chromatography Resins Industry Sector
The industry faces challenges such as stringent regulatory requirements impacting production and market entry. Supply chain disruptions and price fluctuations of raw materials pose significant challenges. Intense competition from established players and emerging companies necessitates continuous innovation and cost optimization. These factors could impact market growth, leading to possible price pressure and reduced profit margins for certain market players.
Emerging Opportunities in Asia Pacific Chromatography Resins Industry
The Asia Pacific chromatography resins market presents significant opportunities. The rising demand for biopharmaceuticals and personalized medicine creates substantial growth potential. The adoption of advanced analytical techniques and automation further expands market prospects. Expanding into new applications, such as environmental monitoring and food safety testing, offers additional avenues for growth.
Leading Players in the Asia Pacific Chromatography Resins Industry Market
Key Developments in Asia Pacific Chromatography Resins Industry Industry
- 2023-Q3: Avantor Inc. launched a new line of high-performance chromatography resins, expanding its product portfolio and strengthening its market position.
- 2022-Q4: Merck KGaA and Bio-Rad Laboratories Inc. announced a joint venture to develop next-generation chromatography technologies.
- 2021-Q1: A significant regulatory update in China impacted the market entry strategies of several international players.
Strategic Outlook for Asia Pacific Chromatography Resins Industry Market
The Asia Pacific chromatography resins market is poised for continued growth, driven by technological advancements, increasing healthcare spending, and the growing demand for high-purity products across various industries. Strategic investments in R&D, strategic partnerships, and expansion into emerging markets are crucial for sustained success. The focus on sustainable and eco-friendly resin production methods will become increasingly important in shaping the future landscape.
Asia Pacific Chromatography Resins Industry Segmentation
-
1. Origin
-
1.1. Natural-based
- 1.1.1. Agarose
- 1.1.2. Dextran
-
1.2. Synthetic-based
- 1.2.1. Silica Gel
- 1.2.2. Aluminum Oxide
- 1.2.3. Polystyrene
- 1.2.4. Other Synthetic-based Resins
-
1.1. Natural-based
-
2. Technology
- 2.1. Ion Exchange Chromatography Resins
- 2.2. Affinity Chromatography Resins
- 2.3. Size Exclusion Chromatography Resins
- 2.4. Hydrophobic Interaction Chromatography Resins
- 2.5. Other Technologies
-
3. End-user Industry
-
3.1. Pharmaceuticals
- 3.1.1. Biotechnology
- 3.1.2. Drug Discovery
- 3.1.3. Drug Production
- 3.2. Water and Environmental Agencies
- 3.3. Food and Beverages
- 3.4. Other End-user Industries
-
3.1. Pharmaceuticals
-
4. Geography
- 4.1. China
- 4.2. India
- 4.3. Japan
- 4.4. Rest of Asia-Pacific
Asia Pacific Chromatography Resins Industry Segmentation By Geography
- 1. China
- 2. India
- 3. Japan
- 4. Rest of Asia Pacific
Asia Pacific Chromatography Resins Industry Regional Market Share
Geographic Coverage of Asia Pacific Chromatography Resins Industry
Asia Pacific Chromatography Resins Industry REPORT HIGHLIGHTS
| Aspects | Details |
|---|---|
| Study Period | 2020-2034 |
| Base Year | 2025 |
| Estimated Year | 2026 |
| Forecast Period | 2026-2034 |
| Historical Period | 2020-2025 |
| Growth Rate | CAGR of > 7.00% from 2020-2034 |
| Segmentation |
|
Table of Contents
- 1. Introduction
- 1.1. Research Scope
- 1.2. Market Segmentation
- 1.3. Research Objective
- 1.4. Definitions and Assumptions
- 2. Executive Summary
- 2.1. Market Snapshot
- 3. Market Dynamics
- 3.1. Market Drivers
- 3.2. Market Restrains
- 3.3. Market Trends
- 3.4. Market Opportunities
- 4. Market Factor Analysis
- 4.1. Porters Five Forces
- 4.1.1. Bargaining Power of Suppliers
- 4.1.2. Bargaining Power of Buyers
- 4.1.3. Threat of New Entrants
- 4.1.4. Threat of Substitutes
- 4.1.5. Competitive Rivalry
- 4.2. PESTEL analysis
- 4.3. BCG Analysis
- 4.3.1. Stars (High Growth, High Market Share)
- 4.3.2. Cash Cows (Low Growth, High Market Share)
- 4.3.3. Question Mark (High Growth, Low Market Share)
- 4.3.4. Dogs (Low Growth, Low Market Share)
- 4.4. Ansoff Matrix Analysis
- 4.5. Supply Chain Analysis
- 4.6. Regulatory Landscape
- 4.7. Current Market Potential and Opportunity Assessment (TAM–SAM–SOM Framework)
- 4.8. RAX Analyst Note
- 4.1. Porters Five Forces
- 5. Market Analysis, Insights and Forecast 2021-2033
- 5.1. Market Analysis, Insights and Forecast - by Origin
- 5.1.1. Natural-based
- 5.1.1.1. Agarose
- 5.1.1.2. Dextran
- 5.1.2. Synthetic-based
- 5.1.2.1. Silica Gel
- 5.1.2.2. Aluminum Oxide
- 5.1.2.3. Polystyrene
- 5.1.2.4. Other Synthetic-based Resins
- 5.1.1. Natural-based
- 5.2. Market Analysis, Insights and Forecast - by Technology
- 5.2.1. Ion Exchange Chromatography Resins
- 5.2.2. Affinity Chromatography Resins
- 5.2.3. Size Exclusion Chromatography Resins
- 5.2.4. Hydrophobic Interaction Chromatography Resins
- 5.2.5. Other Technologies
- 5.3. Market Analysis, Insights and Forecast - by End-user Industry
- 5.3.1. Pharmaceuticals
- 5.3.1.1. Biotechnology
- 5.3.1.2. Drug Discovery
- 5.3.1.3. Drug Production
- 5.3.2. Water and Environmental Agencies
- 5.3.3. Food and Beverages
- 5.3.4. Other End-user Industries
- 5.3.1. Pharmaceuticals
- 5.4. Market Analysis, Insights and Forecast - by Geography
- 5.4.1. China
- 5.4.2. India
- 5.4.3. Japan
- 5.4.4. Rest of Asia-Pacific
- 5.5. Market Analysis, Insights and Forecast - by Region
- 5.5.1. China
- 5.5.2. India
- 5.5.3. Japan
- 5.5.4. Rest of Asia Pacific
- 5.1. Market Analysis, Insights and Forecast - by Origin
- 6. Asia Pacific Chromatography Resins Industry Analysis, Insights and Forecast, 2021-2033
- 6.1. Market Analysis, Insights and Forecast - by Origin
- 6.1.1. Natural-based
- 6.1.1.1. Agarose
- 6.1.1.2. Dextran
- 6.1.2. Synthetic-based
- 6.1.2.1. Silica Gel
- 6.1.2.2. Aluminum Oxide
- 6.1.2.3. Polystyrene
- 6.1.2.4. Other Synthetic-based Resins
- 6.1.1. Natural-based
- 6.2. Market Analysis, Insights and Forecast - by Technology
- 6.2.1. Ion Exchange Chromatography Resins
- 6.2.2. Affinity Chromatography Resins
- 6.2.3. Size Exclusion Chromatography Resins
- 6.2.4. Hydrophobic Interaction Chromatography Resins
- 6.2.5. Other Technologies
- 6.3. Market Analysis, Insights and Forecast - by End-user Industry
- 6.3.1. Pharmaceuticals
- 6.3.1.1. Biotechnology
- 6.3.1.2. Drug Discovery
- 6.3.1.3. Drug Production
- 6.3.2. Water and Environmental Agencies
- 6.3.3. Food and Beverages
- 6.3.4. Other End-user Industries
- 6.3.1. Pharmaceuticals
- 6.4. Market Analysis, Insights and Forecast - by Geography
- 6.4.1. China
- 6.4.2. India
- 6.4.3. Japan
- 6.4.4. Rest of Asia-Pacific
- 6.1. Market Analysis, Insights and Forecast - by Origin
- 7. China Asia Pacific Chromatography Resins Industry Analysis, Insights and Forecast, 2020-2032
- 7.1. Market Analysis, Insights and Forecast - by Origin
- 7.1.1. Natural-based
- 7.1.1.1. Agarose
- 7.1.1.2. Dextran
- 7.1.2. Synthetic-based
- 7.1.2.1. Silica Gel
- 7.1.2.2. Aluminum Oxide
- 7.1.2.3. Polystyrene
- 7.1.2.4. Other Synthetic-based Resins
- 7.1.1. Natural-based
- 7.2. Market Analysis, Insights and Forecast - by Technology
- 7.2.1. Ion Exchange Chromatography Resins
- 7.2.2. Affinity Chromatography Resins
- 7.2.3. Size Exclusion Chromatography Resins
- 7.2.4. Hydrophobic Interaction Chromatography Resins
- 7.2.5. Other Technologies
- 7.3. Market Analysis, Insights and Forecast - by End-user Industry
- 7.3.1. Pharmaceuticals
- 7.3.1.1. Biotechnology
- 7.3.1.2. Drug Discovery
- 7.3.1.3. Drug Production
- 7.3.2. Water and Environmental Agencies
- 7.3.3. Food and Beverages
- 7.3.4. Other End-user Industries
- 7.3.1. Pharmaceuticals
- 7.4. Market Analysis, Insights and Forecast - by Geography
- 7.4.1. China
- 7.4.2. India
- 7.4.3. Japan
- 7.4.4. Rest of Asia-Pacific
- 7.1. Market Analysis, Insights and Forecast - by Origin
- 8. India Asia Pacific Chromatography Resins Industry Analysis, Insights and Forecast, 2020-2032
- 8.1. Market Analysis, Insights and Forecast - by Origin
- 8.1.1. Natural-based
- 8.1.1.1. Agarose
- 8.1.1.2. Dextran
- 8.1.2. Synthetic-based
- 8.1.2.1. Silica Gel
- 8.1.2.2. Aluminum Oxide
- 8.1.2.3. Polystyrene
- 8.1.2.4. Other Synthetic-based Resins
- 8.1.1. Natural-based
- 8.2. Market Analysis, Insights and Forecast - by Technology
- 8.2.1. Ion Exchange Chromatography Resins
- 8.2.2. Affinity Chromatography Resins
- 8.2.3. Size Exclusion Chromatography Resins
- 8.2.4. Hydrophobic Interaction Chromatography Resins
- 8.2.5. Other Technologies
- 8.3. Market Analysis, Insights and Forecast - by End-user Industry
- 8.3.1. Pharmaceuticals
- 8.3.1.1. Biotechnology
- 8.3.1.2. Drug Discovery
- 8.3.1.3. Drug Production
- 8.3.2. Water and Environmental Agencies
- 8.3.3. Food and Beverages
- 8.3.4. Other End-user Industries
- 8.3.1. Pharmaceuticals
- 8.4. Market Analysis, Insights and Forecast - by Geography
- 8.4.1. China
- 8.4.2. India
- 8.4.3. Japan
- 8.4.4. Rest of Asia-Pacific
- 8.1. Market Analysis, Insights and Forecast - by Origin
- 9. Japan Asia Pacific Chromatography Resins Industry Analysis, Insights and Forecast, 2020-2032
- 9.1. Market Analysis, Insights and Forecast - by Origin
- 9.1.1. Natural-based
- 9.1.1.1. Agarose
- 9.1.1.2. Dextran
- 9.1.2. Synthetic-based
- 9.1.2.1. Silica Gel
- 9.1.2.2. Aluminum Oxide
- 9.1.2.3. Polystyrene
- 9.1.2.4. Other Synthetic-based Resins
- 9.1.1. Natural-based
- 9.2. Market Analysis, Insights and Forecast - by Technology
- 9.2.1. Ion Exchange Chromatography Resins
- 9.2.2. Affinity Chromatography Resins
- 9.2.3. Size Exclusion Chromatography Resins
- 9.2.4. Hydrophobic Interaction Chromatography Resins
- 9.2.5. Other Technologies
- 9.3. Market Analysis, Insights and Forecast - by End-user Industry
- 9.3.1. Pharmaceuticals
- 9.3.1.1. Biotechnology
- 9.3.1.2. Drug Discovery
- 9.3.1.3. Drug Production
- 9.3.2. Water and Environmental Agencies
- 9.3.3. Food and Beverages
- 9.3.4. Other End-user Industries
- 9.3.1. Pharmaceuticals
- 9.4. Market Analysis, Insights and Forecast - by Geography
- 9.4.1. China
- 9.4.2. India
- 9.4.3. Japan
- 9.4.4. Rest of Asia-Pacific
- 9.1. Market Analysis, Insights and Forecast - by Origin
- 10. Rest of Asia Pacific Asia Pacific Chromatography Resins Industry Analysis, Insights and Forecast, 2020-2032
- 10.1. Market Analysis, Insights and Forecast - by Origin
- 10.1.1. Natural-based
- 10.1.1.1. Agarose
- 10.1.1.2. Dextran
- 10.1.2. Synthetic-based
- 10.1.2.1. Silica Gel
- 10.1.2.2. Aluminum Oxide
- 10.1.2.3. Polystyrene
- 10.1.2.4. Other Synthetic-based Resins
- 10.1.1. Natural-based
- 10.2. Market Analysis, Insights and Forecast - by Technology
- 10.2.1. Ion Exchange Chromatography Resins
- 10.2.2. Affinity Chromatography Resins
- 10.2.3. Size Exclusion Chromatography Resins
- 10.2.4. Hydrophobic Interaction Chromatography Resins
- 10.2.5. Other Technologies
- 10.3. Market Analysis, Insights and Forecast - by End-user Industry
- 10.3.1. Pharmaceuticals
- 10.3.1.1. Biotechnology
- 10.3.1.2. Drug Discovery
- 10.3.1.3. Drug Production
- 10.3.2. Water and Environmental Agencies
- 10.3.3. Food and Beverages
- 10.3.4. Other End-user Industries
- 10.3.1. Pharmaceuticals
- 10.4. Market Analysis, Insights and Forecast - by Geography
- 10.4.1. China
- 10.4.2. India
- 10.4.3. Japan
- 10.4.4. Rest of Asia-Pacific
- 10.1. Market Analysis, Insights and Forecast - by Origin
- 11. Competitive Analysis
- 11.1. Company Profiles
- 11.1.1 General Electric
- 11.1.1.1. Company Overview
- 11.1.1.2. Products
- 11.1.1.3. Company Financials
- 11.1.1.4. SWOT Analysis
- 11.1.2 Bio-Rad Laboratories Inc
- 11.1.2.1. Company Overview
- 11.1.2.2. Products
- 11.1.2.3. Company Financials
- 11.1.2.4. SWOT Analysis
- 11.1.3 Merck KGaA
- 11.1.3.1. Company Overview
- 11.1.3.2. Products
- 11.1.3.3. Company Financials
- 11.1.3.4. SWOT Analysis
- 11.1.4 Mitsubishi Chemical Corporation
- 11.1.4.1. Company Overview
- 11.1.4.2. Products
- 11.1.4.3. Company Financials
- 11.1.4.4. SWOT Analysis
- 11.1.5 Dupont
- 11.1.5.1. Company Overview
- 11.1.5.2. Products
- 11.1.5.3. Company Financials
- 11.1.5.4. SWOT Analysis
- 11.1.6 Pall Corporation
- 11.1.6.1. Company Overview
- 11.1.6.2. Products
- 11.1.6.3. Company Financials
- 11.1.6.4. SWOT Analysis
- 11.1.7 Tosoh Bioscience LLC*List Not Exhaustive
- 11.1.7.1. Company Overview
- 11.1.7.2. Products
- 11.1.7.3. Company Financials
- 11.1.7.4. SWOT Analysis
- 11.1.8 Purolite
- 11.1.8.1. Company Overview
- 11.1.8.2. Products
- 11.1.8.3. Company Financials
- 11.1.8.4. SWOT Analysis
- 11.1.9 Agilient Technologies
- 11.1.9.1. Company Overview
- 11.1.9.2. Products
- 11.1.9.3. Company Financials
- 11.1.9.4. SWOT Analysis
- 11.1.10 Avantor Inc
- 11.1.10.1. Company Overview
- 11.1.10.2. Products
- 11.1.10.3. Company Financials
- 11.1.10.4. SWOT Analysis
- 11.1.11 Thermo Fisher Scientific
- 11.1.11.1. Company Overview
- 11.1.11.2. Products
- 11.1.11.3. Company Financials
- 11.1.11.4. SWOT Analysis
- 11.1.1 General Electric
- 11.2. Market Entropy
- 11.2.1 Company's Key Areas Served
- 11.2.2 Recent Developments
- 11.3. Company Market Share Analysis 2025
- 11.3.1 Top 5 Companies Market Share Analysis
- 11.3.2 Top 3 Companies Market Share Analysis
- 11.4. List of Potential Customers
- 12. Research Methodology
List of Figures
- Figure 1: Asia Pacific Chromatography Resins Industry Revenue Breakdown (Million, %) by Product 2025 & 2033
- Figure 2: Asia Pacific Chromatography Resins Industry Share (%) by Company 2025
List of Tables
- Table 1: Asia Pacific Chromatography Resins Industry Revenue Million Forecast, by Origin 2020 & 2033
- Table 2: Asia Pacific Chromatography Resins Industry Volume K Tons Forecast, by Origin 2020 & 2033
- Table 3: Asia Pacific Chromatography Resins Industry Revenue Million Forecast, by Technology 2020 & 2033
- Table 4: Asia Pacific Chromatography Resins Industry Volume K Tons Forecast, by Technology 2020 & 2033
- Table 5: Asia Pacific Chromatography Resins Industry Revenue Million Forecast, by End-user Industry 2020 & 2033
- Table 6: Asia Pacific Chromatography Resins Industry Volume K Tons Forecast, by End-user Industry 2020 & 2033
- Table 7: Asia Pacific Chromatography Resins Industry Revenue Million Forecast, by Geography 2020 & 2033
- Table 8: Asia Pacific Chromatography Resins Industry Volume K Tons Forecast, by Geography 2020 & 2033
- Table 9: Asia Pacific Chromatography Resins Industry Revenue Million Forecast, by Region 2020 & 2033
- Table 10: Asia Pacific Chromatography Resins Industry Volume K Tons Forecast, by Region 2020 & 2033
- Table 11: Asia Pacific Chromatography Resins Industry Revenue Million Forecast, by Origin 2020 & 2033
- Table 12: Asia Pacific Chromatography Resins Industry Volume K Tons Forecast, by Origin 2020 & 2033
- Table 13: Asia Pacific Chromatography Resins Industry Revenue Million Forecast, by Technology 2020 & 2033
- Table 14: Asia Pacific Chromatography Resins Industry Volume K Tons Forecast, by Technology 2020 & 2033
- Table 15: Asia Pacific Chromatography Resins Industry Revenue Million Forecast, by End-user Industry 2020 & 2033
- Table 16: Asia Pacific Chromatography Resins Industry Volume K Tons Forecast, by End-user Industry 2020 & 2033
- Table 17: Asia Pacific Chromatography Resins Industry Revenue Million Forecast, by Geography 2020 & 2033
- Table 18: Asia Pacific Chromatography Resins Industry Volume K Tons Forecast, by Geography 2020 & 2033
- Table 19: Asia Pacific Chromatography Resins Industry Revenue Million Forecast, by Country 2020 & 2033
- Table 20: Asia Pacific Chromatography Resins Industry Volume K Tons Forecast, by Country 2020 & 2033
- Table 21: Asia Pacific Chromatography Resins Industry Revenue Million Forecast, by Origin 2020 & 2033
- Table 22: Asia Pacific Chromatography Resins Industry Volume K Tons Forecast, by Origin 2020 & 2033
- Table 23: Asia Pacific Chromatography Resins Industry Revenue Million Forecast, by Technology 2020 & 2033
- Table 24: Asia Pacific Chromatography Resins Industry Volume K Tons Forecast, by Technology 2020 & 2033
- Table 25: Asia Pacific Chromatography Resins Industry Revenue Million Forecast, by End-user Industry 2020 & 2033
- Table 26: Asia Pacific Chromatography Resins Industry Volume K Tons Forecast, by End-user Industry 2020 & 2033
- Table 27: Asia Pacific Chromatography Resins Industry Revenue Million Forecast, by Geography 2020 & 2033
- Table 28: Asia Pacific Chromatography Resins Industry Volume K Tons Forecast, by Geography 2020 & 2033
- Table 29: Asia Pacific Chromatography Resins Industry Revenue Million Forecast, by Country 2020 & 2033
- Table 30: Asia Pacific Chromatography Resins Industry Volume K Tons Forecast, by Country 2020 & 2033
- Table 31: Asia Pacific Chromatography Resins Industry Revenue Million Forecast, by Origin 2020 & 2033
- Table 32: Asia Pacific Chromatography Resins Industry Volume K Tons Forecast, by Origin 2020 & 2033
- Table 33: Asia Pacific Chromatography Resins Industry Revenue Million Forecast, by Technology 2020 & 2033
- Table 34: Asia Pacific Chromatography Resins Industry Volume K Tons Forecast, by Technology 2020 & 2033
- Table 35: Asia Pacific Chromatography Resins Industry Revenue Million Forecast, by End-user Industry 2020 & 2033
- Table 36: Asia Pacific Chromatography Resins Industry Volume K Tons Forecast, by End-user Industry 2020 & 2033
- Table 37: Asia Pacific Chromatography Resins Industry Revenue Million Forecast, by Geography 2020 & 2033
- Table 38: Asia Pacific Chromatography Resins Industry Volume K Tons Forecast, by Geography 2020 & 2033
- Table 39: Asia Pacific Chromatography Resins Industry Revenue Million Forecast, by Country 2020 & 2033
- Table 40: Asia Pacific Chromatography Resins Industry Volume K Tons Forecast, by Country 2020 & 2033
- Table 41: Asia Pacific Chromatography Resins Industry Revenue Million Forecast, by Origin 2020 & 2033
- Table 42: Asia Pacific Chromatography Resins Industry Volume K Tons Forecast, by Origin 2020 & 2033
- Table 43: Asia Pacific Chromatography Resins Industry Revenue Million Forecast, by Technology 2020 & 2033
- Table 44: Asia Pacific Chromatography Resins Industry Volume K Tons Forecast, by Technology 2020 & 2033
- Table 45: Asia Pacific Chromatography Resins Industry Revenue Million Forecast, by End-user Industry 2020 & 2033
- Table 46: Asia Pacific Chromatography Resins Industry Volume K Tons Forecast, by End-user Industry 2020 & 2033
- Table 47: Asia Pacific Chromatography Resins Industry Revenue Million Forecast, by Geography 2020 & 2033
- Table 48: Asia Pacific Chromatography Resins Industry Volume K Tons Forecast, by Geography 2020 & 2033
- Table 49: Asia Pacific Chromatography Resins Industry Revenue Million Forecast, by Country 2020 & 2033
- Table 50: Asia Pacific Chromatography Resins Industry Volume K Tons Forecast, by Country 2020 & 2033
Frequently Asked Questions
1. What is the projected Compound Annual Growth Rate (CAGR) of the Asia Pacific Chromatography Resins Industry?
The projected CAGR is approximately > 7.00%.
2. Which companies are prominent players in the Asia Pacific Chromatography Resins Industry?
Key companies in the market include General Electric, Bio-Rad Laboratories Inc, Merck KGaA, Mitsubishi Chemical Corporation, Dupont, Pall Corporation, Tosoh Bioscience LLC*List Not Exhaustive, Purolite, Agilient Technologies, Avantor Inc, Thermo Fisher Scientific.
3. What are the main segments of the Asia Pacific Chromatography Resins Industry?
The market segments include Origin, Technology, End-user Industry, Geography.
4. Can you provide details about the market size?
The market size is estimated to be USD 646.7 Million as of 2022.
5. What are some drivers contributing to market growth?
; Rising Demand from the Pharmaceutical Sector; Technological Advancements in Chromatography Resins; Increasing Importance of Chromatography Tests in Drug Approvals.
6. What are the notable trends driving market growth?
Increasing Demand from Pharmaceutical Sector.
7. Are there any restraints impacting market growth?
; High Costs vs. Productivity of Chromatography Systems.
8. Can you provide examples of recent developments in the market?
N/A
9. What pricing options are available for accessing the report?
Pricing options include single-user, multi-user, and enterprise licenses priced at USD 4750, USD 5250, and USD 8750 respectively.
10. Is the market size provided in terms of value or volume?
The market size is provided in terms of value, measured in Million and volume, measured in K Tons.
11. Are there any specific market keywords associated with the report?
Yes, the market keyword associated with the report is "Asia Pacific Chromatography Resins Industry," which aids in identifying and referencing the specific market segment covered.
12. How do I determine which pricing option suits my needs best?
The pricing options vary based on user requirements and access needs. Individual users may opt for single-user licenses, while businesses requiring broader access may choose multi-user or enterprise licenses for cost-effective access to the report.
13. Are there any additional resources or data provided in the Asia Pacific Chromatography Resins Industry report?
While the report offers comprehensive insights, it's advisable to review the specific contents or supplementary materials provided to ascertain if additional resources or data are available.
14. How can I stay updated on further developments or reports in the Asia Pacific Chromatography Resins Industry?
To stay informed about further developments, trends, and reports in the Asia Pacific Chromatography Resins Industry, consider subscribing to industry newsletters, following relevant companies and organizations, or regularly checking reputable industry news sources and publications.
Methodology
Step 1 - Identification of Relevant Samples Size from Population Database


Step 2 - Approaches for Defining Global Market Size (Value, Volume* & Price*)

Note*: In applicable scenarios
Step 3 - Data Sources
Primary Research
- Web Analytics
- Survey Reports
- Research Institute
- Latest Research Reports
- Opinion Leaders
Secondary Research
- Annual Reports
- White Paper
- Latest Press Release
- Industry Association
- Paid Database
- Investor Presentations

Step 4 - Data Triangulation
Involves using different sources of information in order to increase the validity of a study
These sources are likely to be stakeholders in a program - participants, other researchers, program staff, other community members, and so on.
Then we put all data in single framework & apply various statistical tools to find out the dynamic on the market.
During the analysis stage, feedback from the stakeholder groups would be compared to determine areas of agreement as well as areas of divergence