

Key Insights
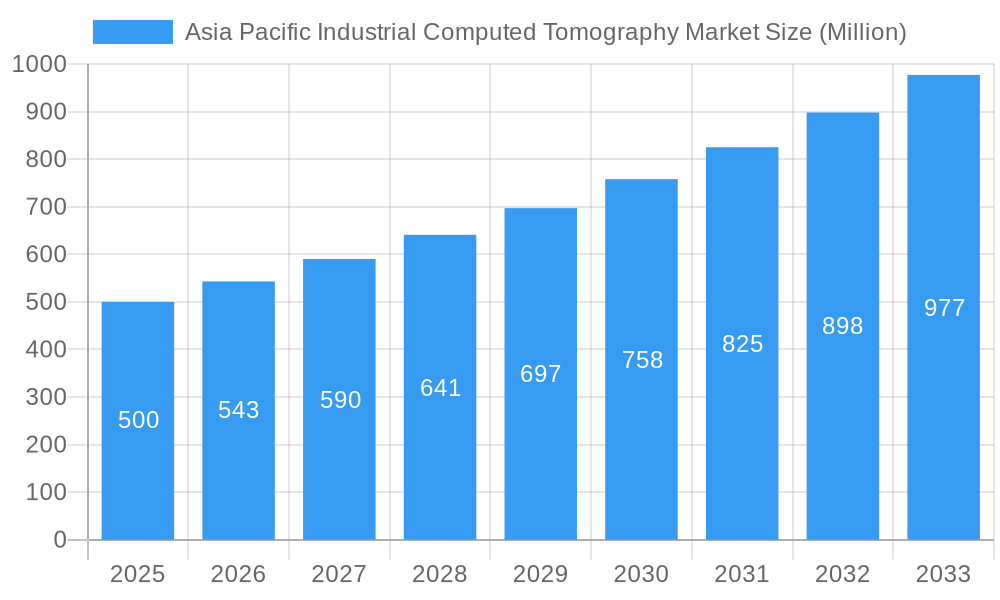
The Asia Pacific Industrial Computed Tomography (ICT) market is poised for substantial expansion, fueled by the escalating demand for advanced non-destructive testing (NDT) solutions across key industries. With a projected Compound Annual Growth Rate (CAGR) of 19.04%, the market is expected to reach 536 million by 2025, building on its current momentum. This robust growth trajectory is attributed to the region's dynamic manufacturing sectors, including electronics, automotive, and aerospace, which increasingly prioritize stringent quality control and assurance. The complexity of modern components necessitates detailed internal analysis, a capability perfectly addressed by ICT. Furthermore, the adoption of ICT for failure analysis is crucial for enhancing product design and reliability. Leading companies are actively investing in research and development, driving innovation in higher resolution imaging and faster scan times, which will further propel market growth.
Asia Pacific Industrial Computed Tomography Market Market Size (In Million)
Key contributors to this growth include China, Japan, South Korea, and India, leveraging their extensive manufacturing capabilities and infrastructure investments. While the automotive and electronics sectors currently lead ICT application, the aerospace and oil & gas industries present significant untapped potential. Challenges such as high initial investment and the requirement for skilled operators are being addressed through continuous technological advancements and heightened awareness of ICT's benefits in improving product quality and reducing operational expenditures. Flaw detection and inspection, driven by the demand for superior quality assurance, are expected to witness the strongest growth, with China and Japan continuing to dominate the regional market landscape.
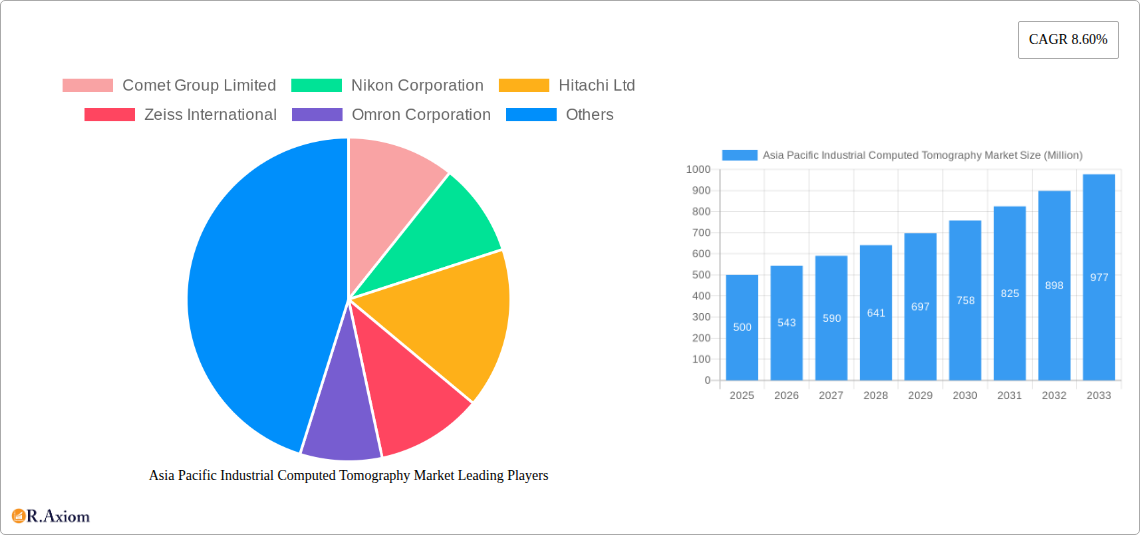
Asia Pacific Industrial Computed Tomography Market Company Market Share
Asia Pacific Industrial Computed Tomography Market: A Comprehensive Report (2019-2033)
This comprehensive report provides an in-depth analysis of the Asia Pacific Industrial Computed Tomography (CT) market, offering valuable insights for stakeholders across the value chain. The study covers the period 2019-2033, with 2025 as the base year and a forecast period spanning 2025-2033. Key market segments, competitive dynamics, and future growth opportunities are meticulously examined. The report is enriched with data points, market sizing, and CAGR projections, facilitating informed decision-making for industry professionals.
Asia Pacific Industrial Computed Tomography Market Concentration & Innovation
The Asia Pacific industrial computed tomography market exhibits a moderately concentrated landscape, with several major players holding significant market share. While exact figures are proprietary to the full report, leading companies such as Comet Group Limited, Nikon Corporation, Hitachi Ltd, Zeiss International, Omron Corporation, Thermo Fischer Scientific Inc, Shimadzu Corporation, Waygate Technologies (Baker Hughes Digital Solutions GmbH), and Bruker Corporation drive innovation through continuous product development and strategic acquisitions. Market share distribution among these players is dynamic and subject to fluctuations based on technological advancements and strategic partnerships. The total market value in 2024 is estimated at xx Million.
Innovation in the Asia Pacific industrial CT market is fueled by several factors:
- Technological advancements: Miniaturization, improved image resolution, faster scan times, and enhanced software capabilities are driving market growth.
- Regulatory frameworks: Stringent quality control standards across various industries, particularly aerospace and automotive, are pushing adoption of CT technology.
- Product substitutes: While other non-destructive testing (NDT) methods exist, industrial CT offers superior imaging capabilities and data analysis, providing a competitive advantage.
- End-user trends: Growing demand for advanced quality control and failure analysis across diverse industries, including electronics and oil & gas, is fostering market expansion.
- M&A activities: Mergers and acquisitions among market players are contributing to increased market concentration and technological integration. Recent M&A deals have ranged from xx Million to xx Million in value, with a trend towards consolidation expected to continue.
Asia Pacific Industrial Computed Tomography Market Industry Trends & Insights
The Asia Pacific industrial computed tomography market is experiencing robust growth, driven by several key factors. The region's expanding manufacturing base, coupled with a rising emphasis on product quality and safety, is significantly contributing to market expansion. The market is projected to witness a CAGR of xx% during the forecast period (2025-2033), reaching a value of xx Million by 2033. This growth is influenced by:
- Increasing demand for high-resolution imaging: Advanced CT systems are enabling detailed analysis of intricate components, leading to improved product quality and reduced defects.
- Technological disruptions: The integration of artificial intelligence (AI) and machine learning (ML) into CT systems is enhancing image processing, analysis, and automation, improving efficiency and reducing analysis time.
- Consumer preferences: The increasing demand for higher-quality, reliable, and safe products across various industries is driving the adoption of industrial CT for quality control and failure analysis.
- Competitive dynamics: Intense competition among established and emerging players is leading to continuous product innovation and price optimization, making industrial CT more accessible to a broader range of end-users. Market penetration has been steadily increasing, particularly in the electronics and automotive sectors.
Dominant Markets & Segments in Asia Pacific Industrial Computed Tomography Market
Within the Asia Pacific region, China and Japan represent the most dominant markets for industrial CT, driven by strong manufacturing sectors and significant investments in advanced technologies. Other key markets include South Korea, India, and Singapore.
By Application:
- Flaw Detection and Inspection: This segment holds the largest market share, driven by the increasing need for stringent quality control across various industries. Key growth drivers include the rising demand for high-precision components and the need to prevent catastrophic failures.
- Failure Analysis: This segment is growing rapidly, fueled by the need to understand and rectify product failures quickly and efficiently, reducing downtime and improving product design.
- Assembly Analysis: This segment is experiencing steady growth, as manufacturers seek to optimize assembly processes and ensure component integrity.
- Other Applications: This includes applications like research and development, materials science, and medical device testing. This segment is expected to witness moderate growth.
By End-User Industry:
- Electronics: This sector is a major driver of industrial CT market growth due to the increasing complexity of electronic components and the demand for high-reliability devices. The need for precise inspection of printed circuit boards (PCBs) and other electronic components is further driving the demand.
- Automotive: The automotive industry is significantly driving the adoption of industrial CT for quality control of complex automotive parts and assemblies, contributing substantially to market growth. Stricter regulations related to vehicle safety are also influencing adoption.
- Aerospace: The aerospace industry demands exceptionally high levels of quality and reliability. The increasing use of advanced composite materials and complex geometries necessitates the adoption of advanced inspection techniques, leading to robust growth in this segment.
- Oil and Gas: This sector uses industrial CT to inspect pipelines, components, and other equipment for defects and damage, contributing to the growth in this segment.
- Other End-User Industries: This includes sectors like medical devices, energy, and consumer goods. These segments are expected to experience moderate growth.
Asia Pacific Industrial Computed Tomography Market Product Developments
Recent technological advancements have significantly enhanced the capabilities of industrial CT systems. The market is witnessing a trend towards miniaturization, higher resolution imaging, faster scan speeds, and greater ease of use. Developments like AI-powered image analysis tools are improving efficiency and accuracy, leading to improved decision-making in product quality control. These improvements are enabling wider adoption across various industries, reinforcing the market's overall growth.
Report Scope & Segmentation Analysis
This report comprehensively analyzes the Asia Pacific industrial computed tomography market across various segments:
By Application: Flaw Detection and Inspection, Failure Analysis, Assembly Analysis, Other Applications. Each segment’s market size, growth projections, and competitive landscape are thoroughly examined.
By End-User Industry: Aerospace, Automotive, Electronics, Oil and Gas, Other End-User Industries. Growth projections and competitive dynamics are analyzed for each end-user segment, highlighting their unique market characteristics. Growth rates and market shares are predicted for each segment based on current trends and anticipated future developments.
Key Drivers of Asia Pacific Industrial Computed Tomography Market Growth
Several factors contribute to the market's growth:
- Technological advancements: The continuous improvement in CT system resolution, speed, and software capabilities drives market adoption.
- Stringent quality control requirements: Stricter regulations and industry standards in key sectors such as aerospace and automotive are promoting industrial CT adoption.
- Rising demand for improved product quality: Manufacturers are increasingly focused on improving product quality and reducing defects, making industrial CT a critical tool.
Challenges in the Asia Pacific Industrial Computed Tomography Market Sector
Several challenges hinder market growth:
- High initial investment costs: The acquisition and maintenance of advanced industrial CT systems can be expensive, posing a barrier for some companies.
- Specialized expertise required: Operating and interpreting data from industrial CT systems requires skilled personnel, which can limit adoption in some regions.
- Supply chain disruptions: The global supply chain continues to be unpredictable, affecting the availability and cost of components for industrial CT systems.
Emerging Opportunities in Asia Pacific Industrial Computed Tomography Market
Emerging opportunities include:
- Integration of AI and machine learning: This offers improved image analysis, automation, and decision-making capabilities.
- Miniaturization and portability: Smaller, more portable systems are broadening the accessibility and applications of industrial CT.
- Development of new applications: Expanding the application of industrial CT to new industries and processes holds immense potential for future growth.
Leading Players in the Asia Pacific Industrial Computed Tomography Market Market
- Comet Group Limited
- Nikon Corporation
- Hitachi Ltd
- Zeiss International
- Omron Corporation
- Thermo Fischer Scientific Inc
- Shimadzu Corporation
- Waygate Technologies (Baker Hughes Digital Solutions GmbH)
- Bruker Corporation
- Shimadzu Corporation
Key Developments in Asia Pacific Industrial Computed Tomography Market Industry
- May 2022: Shimadzu Corporation launched the XSeeker 8000 bench-top X-ray CT system, a compact and lightweight system offering high-quality imaging for various samples. This development enhances accessibility and broadens the market.
- November 2021: Omron Corporation unveiled the VT-X750-V3 system, claimed to be the fastest CT-type X-ray inspection device. This innovation increases inspection speed and efficiency in electronics manufacturing.
Strategic Outlook for Asia Pacific Industrial Computed Tomography Market Market
The Asia Pacific industrial computed tomography market presents significant growth potential. Ongoing technological advancements, increasing demand for high-quality products, and stringent quality control regulations will propel market growth. Strategic partnerships, focused R&D efforts, and expansion into new applications will be key factors for success in this rapidly evolving market. The market's future depends on continued technological innovation, wider adoption in emerging industries, and effective strategies to overcome cost and expertise barriers.
Asia Pacific Industrial Computed Tomography Market Segmentation
-
1. Application
- 1.1. Flaw Detection and Inspection
- 1.2. Failure Analysis
- 1.3. Assembly Analysis
- 1.4. Other Applications
-
2. End-User Industry
- 2.1. Aerospace
- 2.2. Automotive
- 2.3. Electronics
- 2.4. Oil and Gas
- 2.5. Other End-User Industries
Asia Pacific Industrial Computed Tomography Market Segmentation By Geography
-
1. Asia Pacific
- 1.1. China
- 1.2. Japan
- 1.3. South Korea
- 1.4. India
- 1.5. Australia
- 1.6. New Zealand
- 1.7. Indonesia
- 1.8. Malaysia
- 1.9. Singapore
- 1.10. Thailand
- 1.11. Vietnam
- 1.12. Philippines
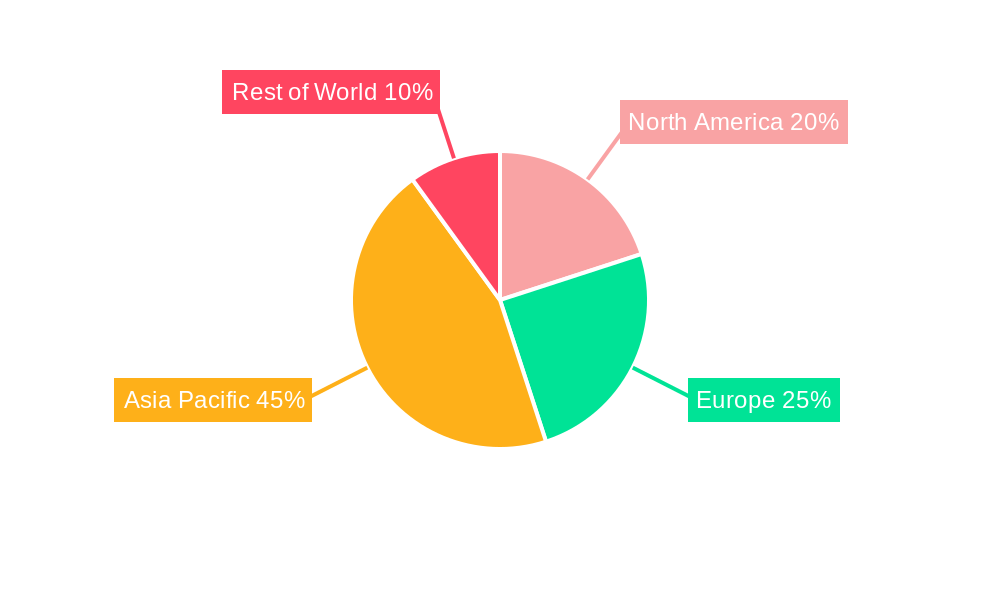
Asia Pacific Industrial Computed Tomography Market Regional Market Share
Geographic Coverage of Asia Pacific Industrial Computed Tomography Market
Asia Pacific Industrial Computed Tomography Market REPORT HIGHLIGHTS
| Aspects | Details |
|---|---|
| Study Period | 2020-2034 |
| Base Year | 2025 |
| Estimated Year | 2026 |
| Forecast Period | 2026-2034 |
| Historical Period | 2020-2025 |
| Growth Rate | CAGR of 19.04% from 2020-2034 |
| Segmentation |
|
Table of Contents
- 1. Introduction
- 1.1. Research Scope
- 1.2. Market Segmentation
- 1.3. Research Objective
- 1.4. Definitions and Assumptions
- 2. Executive Summary
- 2.1. Market Snapshot
- 3. Market Dynamics
- 3.1. Market Drivers
- 3.2. Market Restrains
- 3.3. Market Trends
- 3.4. Market Opportunities
- 4. Market Factor Analysis
- 4.1. Porters Five Forces
- 4.1.1. Bargaining Power of Suppliers
- 4.1.2. Bargaining Power of Buyers
- 4.1.3. Threat of New Entrants
- 4.1.4. Threat of Substitutes
- 4.1.5. Competitive Rivalry
- 4.2. PESTEL analysis
- 4.3. BCG Analysis
- 4.3.1. Stars (High Growth, High Market Share)
- 4.3.2. Cash Cows (Low Growth, High Market Share)
- 4.3.3. Question Mark (High Growth, Low Market Share)
- 4.3.4. Dogs (Low Growth, Low Market Share)
- 4.4. Ansoff Matrix Analysis
- 4.5. Supply Chain Analysis
- 4.6. Regulatory Landscape
- 4.7. Current Market Potential and Opportunity Assessment (TAM–SAM–SOM Framework)
- 4.8. RAX Analyst Note
- 4.1. Porters Five Forces
- 5. Market Analysis, Insights and Forecast 2021-2033
- 5.1. Market Analysis, Insights and Forecast - by Application
- 5.1.1. Flaw Detection and Inspection
- 5.1.2. Failure Analysis
- 5.1.3. Assembly Analysis
- 5.1.4. Other Applications
- 5.2. Market Analysis, Insights and Forecast - by End-User Industry
- 5.2.1. Aerospace
- 5.2.2. Automotive
- 5.2.3. Electronics
- 5.2.4. Oil and Gas
- 5.2.5. Other End-User Industries
- 5.3. Market Analysis, Insights and Forecast - by Region
- 5.3.1. Asia Pacific
- 5.1. Market Analysis, Insights and Forecast - by Application
- 6. Asia Pacific Industrial Computed Tomography Market Analysis, Insights and Forecast, 2021-2033
- 6.1. Market Analysis, Insights and Forecast - by Application
- 6.1.1. Flaw Detection and Inspection
- 6.1.2. Failure Analysis
- 6.1.3. Assembly Analysis
- 6.1.4. Other Applications
- 6.2. Market Analysis, Insights and Forecast - by End-User Industry
- 6.2.1. Aerospace
- 6.2.2. Automotive
- 6.2.3. Electronics
- 6.2.4. Oil and Gas
- 6.2.5. Other End-User Industries
- 6.1. Market Analysis, Insights and Forecast - by Application
- 7. Competitive Analysis
- 7.1. Company Profiles
- 7.1.1 Comet Group Limited
- 7.1.1.1. Company Overview
- 7.1.1.2. Products
- 7.1.1.3. Company Financials
- 7.1.1.4. SWOT Analysis
- 7.1.2 Nikon Corporation
- 7.1.2.1. Company Overview
- 7.1.2.2. Products
- 7.1.2.3. Company Financials
- 7.1.2.4. SWOT Analysis
- 7.1.3 Hitachi Ltd
- 7.1.3.1. Company Overview
- 7.1.3.2. Products
- 7.1.3.3. Company Financials
- 7.1.3.4. SWOT Analysis
- 7.1.4 Zeiss International
- 7.1.4.1. Company Overview
- 7.1.4.2. Products
- 7.1.4.3. Company Financials
- 7.1.4.4. SWOT Analysis
- 7.1.5 Omron Corporation
- 7.1.5.1. Company Overview
- 7.1.5.2. Products
- 7.1.5.3. Company Financials
- 7.1.5.4. SWOT Analysis
- 7.1.6 Thermo Fischer Scientific Inc
- 7.1.6.1. Company Overview
- 7.1.6.2. Products
- 7.1.6.3. Company Financials
- 7.1.6.4. SWOT Analysis
- 7.1.7 Shimadzu Corporation
- 7.1.7.1. Company Overview
- 7.1.7.2. Products
- 7.1.7.3. Company Financials
- 7.1.7.4. SWOT Analysis
- 7.1.8 Waygate Technologies (Baker Hughes Digital Solutions GmbH)
- 7.1.8.1. Company Overview
- 7.1.8.2. Products
- 7.1.8.3. Company Financials
- 7.1.8.4. SWOT Analysis
- 7.1.9 Bruker Corporation
- 7.1.9.1. Company Overview
- 7.1.9.2. Products
- 7.1.9.3. Company Financials
- 7.1.9.4. SWOT Analysis
- 7.1.10 Shimadzu Corporation
- 7.1.10.1. Company Overview
- 7.1.10.2. Products
- 7.1.10.3. Company Financials
- 7.1.10.4. SWOT Analysis
- 7.1.1 Comet Group Limited
- 7.2. Market Entropy
- 7.2.1 Company's Key Areas Served
- 7.2.2 Recent Developments
- 7.3. Company Market Share Analysis 2025
- 7.3.1 Top 5 Companies Market Share Analysis
- 7.3.2 Top 3 Companies Market Share Analysis
- 7.4. List of Potential Customers
- 8. Research Methodology
List of Figures
- Figure 1: Asia Pacific Industrial Computed Tomography Market Revenue Breakdown (million, %) by Product 2025 & 2033
- Figure 2: Asia Pacific Industrial Computed Tomography Market Share (%) by Company 2025
List of Tables
- Table 1: Asia Pacific Industrial Computed Tomography Market Revenue million Forecast, by Application 2020 & 2033
- Table 2: Asia Pacific Industrial Computed Tomography Market Revenue million Forecast, by End-User Industry 2020 & 2033
- Table 3: Asia Pacific Industrial Computed Tomography Market Revenue million Forecast, by Region 2020 & 2033
- Table 4: Asia Pacific Industrial Computed Tomography Market Revenue million Forecast, by Application 2020 & 2033
- Table 5: Asia Pacific Industrial Computed Tomography Market Revenue million Forecast, by End-User Industry 2020 & 2033
- Table 6: Asia Pacific Industrial Computed Tomography Market Revenue million Forecast, by Country 2020 & 2033
- Table 7: China Asia Pacific Industrial Computed Tomography Market Revenue (million) Forecast, by Application 2020 & 2033
- Table 8: Japan Asia Pacific Industrial Computed Tomography Market Revenue (million) Forecast, by Application 2020 & 2033
- Table 9: South Korea Asia Pacific Industrial Computed Tomography Market Revenue (million) Forecast, by Application 2020 & 2033
- Table 10: India Asia Pacific Industrial Computed Tomography Market Revenue (million) Forecast, by Application 2020 & 2033
- Table 11: Australia Asia Pacific Industrial Computed Tomography Market Revenue (million) Forecast, by Application 2020 & 2033
- Table 12: New Zealand Asia Pacific Industrial Computed Tomography Market Revenue (million) Forecast, by Application 2020 & 2033
- Table 13: Indonesia Asia Pacific Industrial Computed Tomography Market Revenue (million) Forecast, by Application 2020 & 2033
- Table 14: Malaysia Asia Pacific Industrial Computed Tomography Market Revenue (million) Forecast, by Application 2020 & 2033
- Table 15: Singapore Asia Pacific Industrial Computed Tomography Market Revenue (million) Forecast, by Application 2020 & 2033
- Table 16: Thailand Asia Pacific Industrial Computed Tomography Market Revenue (million) Forecast, by Application 2020 & 2033
- Table 17: Vietnam Asia Pacific Industrial Computed Tomography Market Revenue (million) Forecast, by Application 2020 & 2033
- Table 18: Philippines Asia Pacific Industrial Computed Tomography Market Revenue (million) Forecast, by Application 2020 & 2033
Frequently Asked Questions
1. What is the projected Compound Annual Growth Rate (CAGR) of the Asia Pacific Industrial Computed Tomography Market?
The projected CAGR is approximately 19.04%.
2. Which companies are prominent players in the Asia Pacific Industrial Computed Tomography Market?
Key companies in the market include Comet Group Limited, Nikon Corporation, Hitachi Ltd, Zeiss International, Omron Corporation, Thermo Fischer Scientific Inc, Shimadzu Corporation, Waygate Technologies (Baker Hughes Digital Solutions GmbH), Bruker Corporation, Shimadzu Corporation.
3. What are the main segments of the Asia Pacific Industrial Computed Tomography Market?
The market segments include Application, End-User Industry.
4. Can you provide details about the market size?
The market size is estimated to be USD 536 million as of 2022.
5. What are some drivers contributing to market growth?
Rising Demand for Portable Radiography Equipment; Technology Advancements in Resolution and Image Processing.
6. What are the notable trends driving market growth?
Automotive to Gain Significant Growth in the Region.
7. Are there any restraints impacting market growth?
High Installation Cost and Longer ROI Period; Longer Replacement Cycle of Water Meters.
8. Can you provide examples of recent developments in the market?
May 2022 - Shimadzu Corporation announced the release of the XSeeker 8000 bench-top X-ray CT system. It is considered to be the smallest and lightest X-ray system. It offers clear images of a variety of samples, from resin molded parts to aluminum die cast and other metallic elements.
9. What pricing options are available for accessing the report?
Pricing options include single-user, multi-user, and enterprise licenses priced at USD 4750, USD 5250, and USD 8750 respectively.
10. Is the market size provided in terms of value or volume?
The market size is provided in terms of value, measured in million.
11. Are there any specific market keywords associated with the report?
Yes, the market keyword associated with the report is "Asia Pacific Industrial Computed Tomography Market," which aids in identifying and referencing the specific market segment covered.
12. How do I determine which pricing option suits my needs best?
The pricing options vary based on user requirements and access needs. Individual users may opt for single-user licenses, while businesses requiring broader access may choose multi-user or enterprise licenses for cost-effective access to the report.
13. Are there any additional resources or data provided in the Asia Pacific Industrial Computed Tomography Market report?
While the report offers comprehensive insights, it's advisable to review the specific contents or supplementary materials provided to ascertain if additional resources or data are available.
14. How can I stay updated on further developments or reports in the Asia Pacific Industrial Computed Tomography Market?
To stay informed about further developments, trends, and reports in the Asia Pacific Industrial Computed Tomography Market, consider subscribing to industry newsletters, following relevant companies and organizations, or regularly checking reputable industry news sources and publications.
Methodology
Step 1 - Identification of Relevant Samples Size from Population Database


Step 2 - Approaches for Defining Global Market Size (Value, Volume* & Price*)

Note*: In applicable scenarios
Step 3 - Data Sources
Primary Research
- Web Analytics
- Survey Reports
- Research Institute
- Latest Research Reports
- Opinion Leaders
Secondary Research
- Annual Reports
- White Paper
- Latest Press Release
- Industry Association
- Paid Database
- Investor Presentations

Step 4 - Data Triangulation
Involves using different sources of information in order to increase the validity of a study
These sources are likely to be stakeholders in a program - participants, other researchers, program staff, other community members, and so on.
Then we put all data in single framework & apply various statistical tools to find out the dynamic on the market.
During the analysis stage, feedback from the stakeholder groups would be compared to determine areas of agreement as well as areas of divergence