

Key Insights
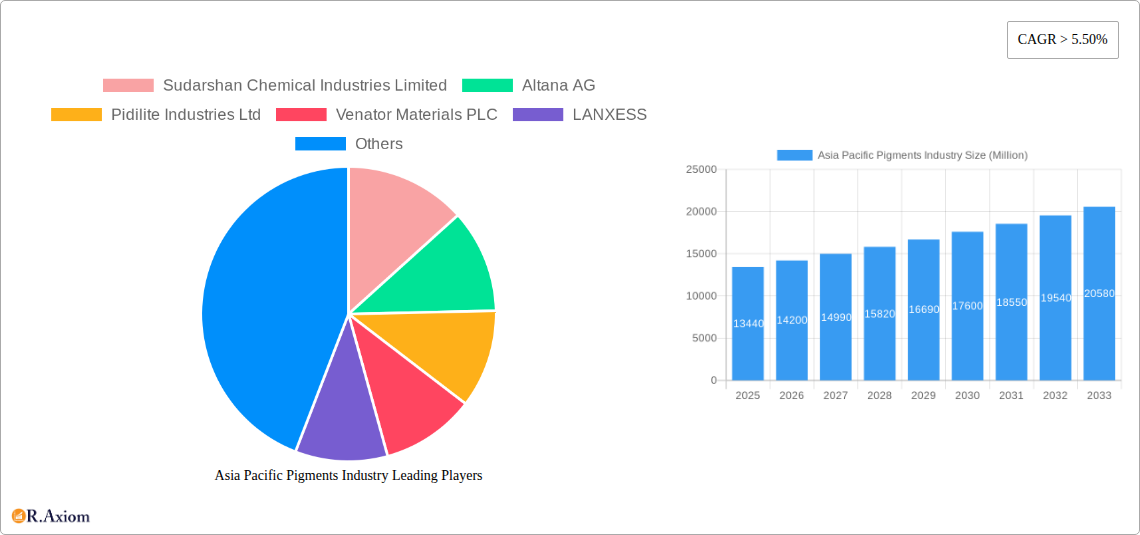
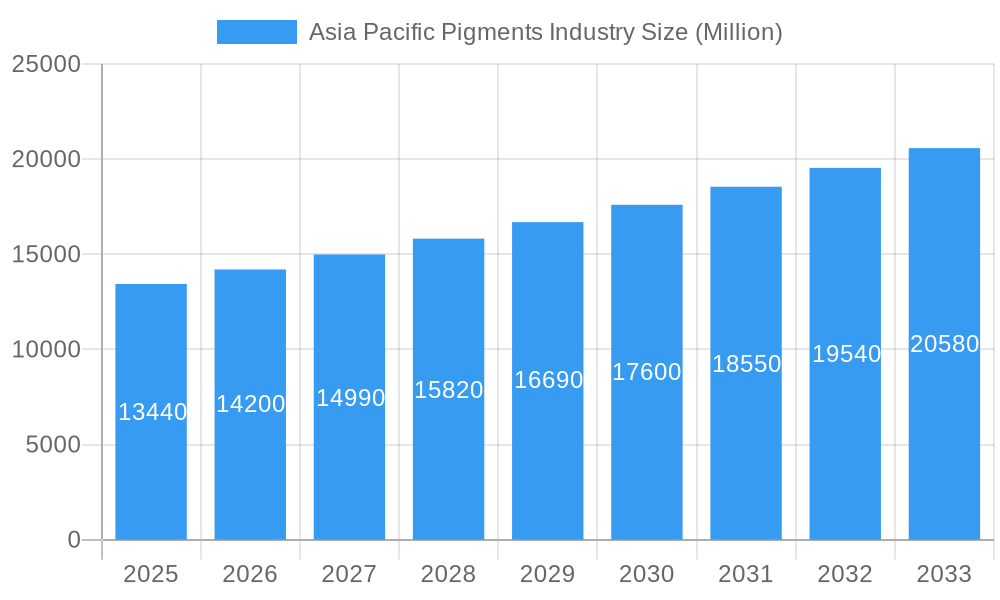
The Asia-Pacific pigments market, valued at $13.44 billion in 2025, is projected to experience robust growth, exceeding a 5.5% CAGR through 2033. This expansion is fueled by several key factors. Firstly, the burgeoning construction and automotive industries in rapidly developing economies like China and India are driving significant demand for paints and coatings, the largest application segment for pigments. Secondly, the increasing popularity of vibrant and durable textiles, particularly in fashion and home furnishings, is boosting the demand for organic and specialty pigments. Thirdly, advancements in printing technology and the growth of the packaging industry are further contributing to market expansion. The rising disposable income across the region is also a major driver, fueling consumer demand for products requiring pigments across diverse applications. While the market faces challenges such as fluctuating raw material prices and stringent environmental regulations, the overall positive economic outlook and increasing industrialization are expected to counterbalance these restraints. Competition among major players like Sudarshan Chemical Industries, Altana AG, and BASF SE is intense, driving innovation and product diversification. Within the product segments, inorganic pigments, due to their cost-effectiveness and performance characteristics, currently hold the largest market share, although organic and specialty pigments are experiencing faster growth rates driven by high-value applications. The regional breakdown shows China and India as the leading markets, reflecting their immense manufacturing capacity and high consumption rates.
Asia Pacific Pigments Industry Market Size (In Billion)
The forecast for the Asia-Pacific pigments market indicates continued growth, primarily driven by sustained economic development and increasing urbanization across the region. Significant opportunities exist for pigment manufacturers focused on sustainable and environmentally friendly products, catering to the rising consumer awareness of eco-conscious solutions. Innovation in pigment technology, especially in developing high-performance pigments with improved color stability and weather resistance, will play a crucial role in shaping the market landscape. Strategic partnerships and collaborations between pigment producers and downstream industries will be essential for securing long-term success. Furthermore, expansion into niche applications, such as cosmetics and electronics, presents promising avenues for growth. Understanding and effectively navigating the regulatory landscape relating to environmental and health standards will be crucial for sustained market success.
Asia Pacific Pigments Industry Company Market Share
Asia Pacific Pigments Industry: A Comprehensive Market Report (2019-2033)
This comprehensive report provides an in-depth analysis of the Asia Pacific pigments industry, offering valuable insights for stakeholders including manufacturers, investors, and industry professionals. Covering the period 2019-2033, with a focus on 2025, this report meticulously examines market dynamics, growth drivers, challenges, and emerging opportunities. The report leverages extensive data analysis and expert insights to deliver actionable intelligence for strategic decision-making.
Asia Pacific Pigments Industry Market Concentration & Innovation
The Asia Pacific pigments market exhibits a moderately concentrated structure, with several multinational players commanding significant market share. Key players such as Sudarshan Chemical Industries Limited, Altana AG, Pidilite Industries Ltd, Venator Materials PLC, LANXESS, BASF SE, Wellton Chemical Co Ltd, The Chemours Company, Tronox Holdings PLC, and DIC CORPORATION, contribute significantly to the overall market volume. However, the presence of several smaller regional players and emerging companies creates a competitive landscape.
Innovation in the industry is driven by the demand for sustainable, high-performance pigments, with a focus on enhanced color consistency, durability, and environmental friendliness. Stringent regulatory frameworks regarding environmental impact and worker safety are pushing innovation towards eco-friendly pigment production and formulations. Substitute products, such as digital printing technologies, pose a challenge, but the versatility and cost-effectiveness of pigments in various applications remain a key strength. M&A activities, such as the November 2022 acquisition of Venator Materials PLC's iron oxide pigment business by Cathay Industries (estimated value: xx Million USD), reflect the industry's consolidation trend and pursuit of economies of scale. These acquisitions often result in increased market share and expanded geographic reach for the acquiring companies. The value of such deals can range from tens to hundreds of Millions of USD, depending on the size and strategic importance of the target company.
Asia Pacific Pigments Industry Industry Trends & Insights
The Asia Pacific pigments market is projected to experience robust growth during the forecast period (2025-2033), with a Compound Annual Growth Rate (CAGR) estimated at xx%. This growth is fueled by several factors, including rising demand from key end-use sectors like paints and coatings, construction, and packaging. Technological advancements in pigment synthesis and formulation are driving the development of high-performance pigments with improved properties, such as lightfastness and weather resistance. Changing consumer preferences towards aesthetically pleasing products and sustainable practices are pushing demand for eco-friendly and bio-based pigments. Intense competition among manufacturers is resulting in continuous product innovation, improved price competitiveness, and enhanced customer service. Market penetration in emerging economies, particularly in Southeast Asia and India, is a significant growth driver, as rising disposable incomes and urbanization spur demand for pigmented products. The market penetration of organic pigments is anticipated to be higher than inorganic pigments given the rising demand for environment-friendly pigments which have significant benefits over inorganic pigments. The overall market size in 2025 is estimated at xx Million USD and is expected to reach xx Million USD by 2033.
Dominant Markets & Segments in Asia Pacific Pigments Industry
- Leading Region: China dominates the Asia Pacific pigments market, driven by its large manufacturing base, robust construction sector, and burgeoning automotive industry. India is another major market demonstrating strong growth potential.
- Leading Product Type: Inorganic pigments currently hold the largest market share, owing to their cost-effectiveness and diverse applications. However, the organic pigments segment is experiencing faster growth due to increasing demand for environment-friendly options.
- Leading Application: The paints and coatings industry remains the largest consumer of pigments, with significant demand from the construction, automotive, and industrial sectors. The textile and plastics industries also contribute substantially to the overall demand.
Key Drivers for Dominant Markets:
- China: Rapid industrialization, government infrastructure projects, and increasing consumer spending on durable goods contribute significantly to the high demand for pigments.
- India: Rising disposable incomes, urbanization, and growth in the construction and automotive sectors are driving pigment consumption.
- Paints & Coatings: The extensive use of paints and coatings in construction, automotive, and industrial applications creates a large and consistent demand for pigments.
The dominance of these segments is likely to persist in the forecast period.
Asia Pacific Pigments Industry Product Developments
Recent product innovations focus on developing high-performance pigments with enhanced properties like superior color strength, lightfastness, and weatherability. Nanotechnology is being utilized to create pigments with unique optical and functional properties, expanding their application range. The industry is also witnessing the development of sustainable and bio-based pigments to meet growing environmental concerns and consumer demand for eco-friendly products. These developments are enhancing the competitive landscape, driving market growth and creating new opportunities for players focusing on innovation.
Report Scope & Segmentation Analysis
This report segments the Asia Pacific pigments market by Product Type: Inorganic Pigments (Titanium Dioxide, Zinc Oxide, etc.), Other Inorganic Product Types (Iron Oxide, Chromium Oxide, etc.), Organic Pigments, Specialty Pigments, and Other Product Types (Metallic Pigments, Natural Pigments, etc.). It further segments by Application: Paints and Coatings, Textiles, Printing Inks, Plastics, Leather, and Other Applications (Cosmetics, Ceramics, Electronics, etc.). Each segment’s market size, growth projections, and competitive dynamics are analyzed in detail. Growth projections vary depending on the specific segment, influenced by factors like material costs, production capacity, and consumer demand trends.
Key Drivers of Asia Pacific Pigments Industry Growth
Several factors drive the growth of the Asia Pacific pigments market. Strong economic growth across the region, particularly in emerging economies, fuels demand for various pigment-consuming products. Government initiatives supporting infrastructure development, particularly in China and India, boost construction activities, thereby driving pigment demand. Technological advancements, including nanotechnology and bio-based pigment development, are broadening the range of applications and improving product performance. Favorable regulatory policies in some areas, promoting sustainable manufacturing practices, encourage eco-friendly pigment production and consumption.
Challenges in the Asia Pacific Pigments Industry Sector
The Asia Pacific pigments industry faces challenges such as fluctuating raw material prices, particularly for metal-based pigments. Supply chain disruptions can impact production and availability, leading to price volatility and potential shortages. Environmental regulations and safety standards are becoming increasingly stringent, necessitating investments in cleaner production technologies. Intense competition from both established players and new entrants creates pressure on pricing and margins. These factors can have a quantifiable negative impact on profitability and market growth.
Emerging Opportunities in Asia Pacific Pigments Industry
The Asia Pacific pigments market presents significant opportunities for growth. The increasing demand for high-performance and eco-friendly pigments creates opportunities for manufacturers developing sustainable solutions. Expansion into emerging markets with growing economies and infrastructure projects offers substantial growth potential. Technological advancements, such as 3D printing and digital printing technologies, open up new applications for specialized pigments. The focus on circular economy principles presents an opportunity to develop pigments from recycled materials or with bio-based ingredients.
Leading Players in the Asia Pacific Pigments Industry Market
- Sudarshan Chemical Industries Limited
- Altana AG
- Pidilite Industries Ltd
- Venator Materials PLC
- LANXESS
- BASF SE
- Wellton Chemical Co Ltd
- The Chemours Company
- Tronox Holdings PLC
- DIC CORPORATION
Key Developments in Asia Pacific Pigments Industry Industry
- November 2022: Cathay Industries acquired Venator Materials PLC's iron oxide pigment business, expanding its global manufacturing presence.
- January 2022: Clariant sold its pigments business to a consortium, retaining a 20% stake (USD 131.6 Million).
Strategic Outlook for Asia Pacific Pigments Industry Market
The Asia Pacific pigments market is poised for continued growth, driven by robust economic expansion, infrastructure development, and technological innovation. The focus on sustainability and the development of high-performance pigments will shape the future market landscape. Companies focusing on innovation, sustainable practices, and strategic partnerships are well-positioned to capitalize on the numerous growth opportunities presented by this dynamic market.
Asia Pacific Pigments Industry Segmentation
-
1. Product Type
-
1.1. Inorganic
- 1.1.1. Titanium Dioxide
- 1.1.2. Zinc Oxide
- 1.1.3. Other In
- 1.2. Organic
- 1.3. Specialty Pigments
- 1.4. Other Pr
-
1.1. Inorganic
-
2. Application
- 2.1. Paints and Coatings
- 2.2. Textiles
- 2.3. Printing Inks
- 2.4. Plastics
- 2.5. Leather
- 2.6. Other Ap
-
3. Geography
- 3.1. China
- 3.2. India
- 3.3. Japan
- 3.4. South Korea
- 3.5. Australia & New Zealand
- 3.6. Rest of Asia-Pacific
Asia Pacific Pigments Industry Segmentation By Geography
- 1. China
- 2. India
- 3. Japan
- 4. South Korea
- 5. Australia
- 6. Rest of Asia Pacific
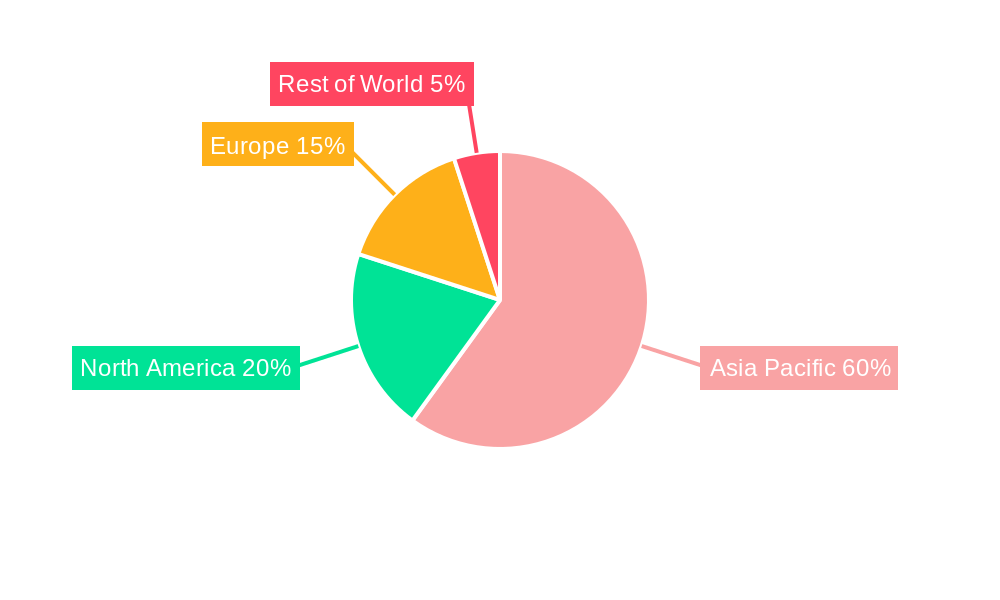
Asia Pacific Pigments Industry Regional Market Share
Geographic Coverage of Asia Pacific Pigments Industry
Asia Pacific Pigments Industry REPORT HIGHLIGHTS
| Aspects | Details |
|---|---|
| Study Period | 2020-2034 |
| Base Year | 2025 |
| Estimated Year | 2026 |
| Forecast Period | 2026-2034 |
| Historical Period | 2020-2025 |
| Growth Rate | CAGR of > 5.50% from 2020-2034 |
| Segmentation |
|
Table of Contents
- 1. Introduction
- 1.1. Research Scope
- 1.2. Market Segmentation
- 1.3. Research Objective
- 1.4. Definitions and Assumptions
- 2. Executive Summary
- 2.1. Market Snapshot
- 3. Market Dynamics
- 3.1. Market Drivers
- 3.2. Market Restrains
- 3.3. Market Trends
- 3.4. Market Opportunities
- 4. Market Factor Analysis
- 4.1. Porters Five Forces
- 4.1.1. Bargaining Power of Suppliers
- 4.1.2. Bargaining Power of Buyers
- 4.1.3. Threat of New Entrants
- 4.1.4. Threat of Substitutes
- 4.1.5. Competitive Rivalry
- 4.2. PESTEL analysis
- 4.3. BCG Analysis
- 4.3.1. Stars (High Growth, High Market Share)
- 4.3.2. Cash Cows (Low Growth, High Market Share)
- 4.3.3. Question Mark (High Growth, Low Market Share)
- 4.3.4. Dogs (Low Growth, Low Market Share)
- 4.4. Ansoff Matrix Analysis
- 4.5. Supply Chain Analysis
- 4.6. Regulatory Landscape
- 4.7. Current Market Potential and Opportunity Assessment (TAM–SAM–SOM Framework)
- 4.8. RAX Analyst Note
- 4.1. Porters Five Forces
- 5. Market Analysis, Insights and Forecast 2021-2033
- 5.1. Market Analysis, Insights and Forecast - by Product Type
- 5.1.1. Inorganic
- 5.1.1.1. Titanium Dioxide
- 5.1.1.2. Zinc Oxide
- 5.1.1.3. Other In
- 5.1.2. Organic
- 5.1.3. Specialty Pigments
- 5.1.4. Other Pr
- 5.1.1. Inorganic
- 5.2. Market Analysis, Insights and Forecast - by Application
- 5.2.1. Paints and Coatings
- 5.2.2. Textiles
- 5.2.3. Printing Inks
- 5.2.4. Plastics
- 5.2.5. Leather
- 5.2.6. Other Ap
- 5.3. Market Analysis, Insights and Forecast - by Geography
- 5.3.1. China
- 5.3.2. India
- 5.3.3. Japan
- 5.3.4. South Korea
- 5.3.5. Australia & New Zealand
- 5.3.6. Rest of Asia-Pacific
- 5.4. Market Analysis, Insights and Forecast - by Region
- 5.4.1. China
- 5.4.2. India
- 5.4.3. Japan
- 5.4.4. South Korea
- 5.4.5. Australia
- 5.4.6. Rest of Asia Pacific
- 5.1. Market Analysis, Insights and Forecast - by Product Type
- 6. Asia Pacific Pigments Industry Analysis, Insights and Forecast, 2021-2033
- 6.1. Market Analysis, Insights and Forecast - by Product Type
- 6.1.1. Inorganic
- 6.1.1.1. Titanium Dioxide
- 6.1.1.2. Zinc Oxide
- 6.1.1.3. Other In
- 6.1.2. Organic
- 6.1.3. Specialty Pigments
- 6.1.4. Other Pr
- 6.1.1. Inorganic
- 6.2. Market Analysis, Insights and Forecast - by Application
- 6.2.1. Paints and Coatings
- 6.2.2. Textiles
- 6.2.3. Printing Inks
- 6.2.4. Plastics
- 6.2.5. Leather
- 6.2.6. Other Ap
- 6.3. Market Analysis, Insights and Forecast - by Geography
- 6.3.1. China
- 6.3.2. India
- 6.3.3. Japan
- 6.3.4. South Korea
- 6.3.5. Australia & New Zealand
- 6.3.6. Rest of Asia-Pacific
- 6.1. Market Analysis, Insights and Forecast - by Product Type
- 7. China Asia Pacific Pigments Industry Analysis, Insights and Forecast, 2020-2032
- 7.1. Market Analysis, Insights and Forecast - by Product Type
- 7.1.1. Inorganic
- 7.1.1.1. Titanium Dioxide
- 7.1.1.2. Zinc Oxide
- 7.1.1.3. Other In
- 7.1.2. Organic
- 7.1.3. Specialty Pigments
- 7.1.4. Other Pr
- 7.1.1. Inorganic
- 7.2. Market Analysis, Insights and Forecast - by Application
- 7.2.1. Paints and Coatings
- 7.2.2. Textiles
- 7.2.3. Printing Inks
- 7.2.4. Plastics
- 7.2.5. Leather
- 7.2.6. Other Ap
- 7.3. Market Analysis, Insights and Forecast - by Geography
- 7.3.1. China
- 7.3.2. India
- 7.3.3. Japan
- 7.3.4. South Korea
- 7.3.5. Australia & New Zealand
- 7.3.6. Rest of Asia-Pacific
- 7.1. Market Analysis, Insights and Forecast - by Product Type
- 8. India Asia Pacific Pigments Industry Analysis, Insights and Forecast, 2020-2032
- 8.1. Market Analysis, Insights and Forecast - by Product Type
- 8.1.1. Inorganic
- 8.1.1.1. Titanium Dioxide
- 8.1.1.2. Zinc Oxide
- 8.1.1.3. Other In
- 8.1.2. Organic
- 8.1.3. Specialty Pigments
- 8.1.4. Other Pr
- 8.1.1. Inorganic
- 8.2. Market Analysis, Insights and Forecast - by Application
- 8.2.1. Paints and Coatings
- 8.2.2. Textiles
- 8.2.3. Printing Inks
- 8.2.4. Plastics
- 8.2.5. Leather
- 8.2.6. Other Ap
- 8.3. Market Analysis, Insights and Forecast - by Geography
- 8.3.1. China
- 8.3.2. India
- 8.3.3. Japan
- 8.3.4. South Korea
- 8.3.5. Australia & New Zealand
- 8.3.6. Rest of Asia-Pacific
- 8.1. Market Analysis, Insights and Forecast - by Product Type
- 9. Japan Asia Pacific Pigments Industry Analysis, Insights and Forecast, 2020-2032
- 9.1. Market Analysis, Insights and Forecast - by Product Type
- 9.1.1. Inorganic
- 9.1.1.1. Titanium Dioxide
- 9.1.1.2. Zinc Oxide
- 9.1.1.3. Other In
- 9.1.2. Organic
- 9.1.3. Specialty Pigments
- 9.1.4. Other Pr
- 9.1.1. Inorganic
- 9.2. Market Analysis, Insights and Forecast - by Application
- 9.2.1. Paints and Coatings
- 9.2.2. Textiles
- 9.2.3. Printing Inks
- 9.2.4. Plastics
- 9.2.5. Leather
- 9.2.6. Other Ap
- 9.3. Market Analysis, Insights and Forecast - by Geography
- 9.3.1. China
- 9.3.2. India
- 9.3.3. Japan
- 9.3.4. South Korea
- 9.3.5. Australia & New Zealand
- 9.3.6. Rest of Asia-Pacific
- 9.1. Market Analysis, Insights and Forecast - by Product Type
- 10. South Korea Asia Pacific Pigments Industry Analysis, Insights and Forecast, 2020-2032
- 10.1. Market Analysis, Insights and Forecast - by Product Type
- 10.1.1. Inorganic
- 10.1.1.1. Titanium Dioxide
- 10.1.1.2. Zinc Oxide
- 10.1.1.3. Other In
- 10.1.2. Organic
- 10.1.3. Specialty Pigments
- 10.1.4. Other Pr
- 10.1.1. Inorganic
- 10.2. Market Analysis, Insights and Forecast - by Application
- 10.2.1. Paints and Coatings
- 10.2.2. Textiles
- 10.2.3. Printing Inks
- 10.2.4. Plastics
- 10.2.5. Leather
- 10.2.6. Other Ap
- 10.3. Market Analysis, Insights and Forecast - by Geography
- 10.3.1. China
- 10.3.2. India
- 10.3.3. Japan
- 10.3.4. South Korea
- 10.3.5. Australia & New Zealand
- 10.3.6. Rest of Asia-Pacific
- 10.1. Market Analysis, Insights and Forecast - by Product Type
- 11. Australia Asia Pacific Pigments Industry Analysis, Insights and Forecast, 2020-2032
- 11.1. Market Analysis, Insights and Forecast - by Product Type
- 11.1.1. Inorganic
- 11.1.1.1. Titanium Dioxide
- 11.1.1.2. Zinc Oxide
- 11.1.1.3. Other In
- 11.1.2. Organic
- 11.1.3. Specialty Pigments
- 11.1.4. Other Pr
- 11.1.1. Inorganic
- 11.2. Market Analysis, Insights and Forecast - by Application
- 11.2.1. Paints and Coatings
- 11.2.2. Textiles
- 11.2.3. Printing Inks
- 11.2.4. Plastics
- 11.2.5. Leather
- 11.2.6. Other Ap
- 11.3. Market Analysis, Insights and Forecast - by Geography
- 11.3.1. China
- 11.3.2. India
- 11.3.3. Japan
- 11.3.4. South Korea
- 11.3.5. Australia & New Zealand
- 11.3.6. Rest of Asia-Pacific
- 11.1. Market Analysis, Insights and Forecast - by Product Type
- 12. Rest of Asia Pacific Asia Pacific Pigments Industry Analysis, Insights and Forecast, 2020-2032
- 12.1. Market Analysis, Insights and Forecast - by Product Type
- 12.1.1. Inorganic
- 12.1.1.1. Titanium Dioxide
- 12.1.1.2. Zinc Oxide
- 12.1.1.3. Other In
- 12.1.2. Organic
- 12.1.3. Specialty Pigments
- 12.1.4. Other Pr
- 12.1.1. Inorganic
- 12.2. Market Analysis, Insights and Forecast - by Application
- 12.2.1. Paints and Coatings
- 12.2.2. Textiles
- 12.2.3. Printing Inks
- 12.2.4. Plastics
- 12.2.5. Leather
- 12.2.6. Other Ap
- 12.3. Market Analysis, Insights and Forecast - by Geography
- 12.3.1. China
- 12.3.2. India
- 12.3.3. Japan
- 12.3.4. South Korea
- 12.3.5. Australia & New Zealand
- 12.3.6. Rest of Asia-Pacific
- 12.1. Market Analysis, Insights and Forecast - by Product Type
- 13. Competitive Analysis
- 13.1. Company Profiles
- 13.1.1 Sudarshan Chemical Industries Limited
- 13.1.1.1. Company Overview
- 13.1.1.2. Products
- 13.1.1.3. Company Financials
- 13.1.1.4. SWOT Analysis
- 13.1.2 Altana AG
- 13.1.2.1. Company Overview
- 13.1.2.2. Products
- 13.1.2.3. Company Financials
- 13.1.2.4. SWOT Analysis
- 13.1.3 Pidilite Industries Ltd
- 13.1.3.1. Company Overview
- 13.1.3.2. Products
- 13.1.3.3. Company Financials
- 13.1.3.4. SWOT Analysis
- 13.1.4 Venator Materials PLC
- 13.1.4.1. Company Overview
- 13.1.4.2. Products
- 13.1.4.3. Company Financials
- 13.1.4.4. SWOT Analysis
- 13.1.5 LANXESS
- 13.1.5.1. Company Overview
- 13.1.5.2. Products
- 13.1.5.3. Company Financials
- 13.1.5.4. SWOT Analysis
- 13.1.6 BASF SE
- 13.1.6.1. Company Overview
- 13.1.6.2. Products
- 13.1.6.3. Company Financials
- 13.1.6.4. SWOT Analysis
- 13.1.7 Wellton Chemical Co Ltd*List Not Exhaustive
- 13.1.7.1. Company Overview
- 13.1.7.2. Products
- 13.1.7.3. Company Financials
- 13.1.7.4. SWOT Analysis
- 13.1.8 The Chemours Company
- 13.1.8.1. Company Overview
- 13.1.8.2. Products
- 13.1.8.3. Company Financials
- 13.1.8.4. SWOT Analysis
- 13.1.9 Tronox Holdings PLC
- 13.1.9.1. Company Overview
- 13.1.9.2. Products
- 13.1.9.3. Company Financials
- 13.1.9.4. SWOT Analysis
- 13.1.10 DIC CORPORATION
- 13.1.10.1. Company Overview
- 13.1.10.2. Products
- 13.1.10.3. Company Financials
- 13.1.10.4. SWOT Analysis
- 13.1.1 Sudarshan Chemical Industries Limited
- 13.2. Market Entropy
- 13.2.1 Company's Key Areas Served
- 13.2.2 Recent Developments
- 13.3. Company Market Share Analysis 2025
- 13.3.1 Top 5 Companies Market Share Analysis
- 13.3.2 Top 3 Companies Market Share Analysis
- 13.4. List of Potential Customers
- 14. Research Methodology
List of Figures
- Figure 1: Asia Pacific Pigments Industry Revenue Breakdown (Million, %) by Product 2025 & 2033
- Figure 2: Asia Pacific Pigments Industry Share (%) by Company 2025
List of Tables
- Table 1: Asia Pacific Pigments Industry Revenue Million Forecast, by Product Type 2020 & 2033
- Table 2: Asia Pacific Pigments Industry Volume Kiloton Forecast, by Product Type 2020 & 2033
- Table 3: Asia Pacific Pigments Industry Revenue Million Forecast, by Application 2020 & 2033
- Table 4: Asia Pacific Pigments Industry Volume Kiloton Forecast, by Application 2020 & 2033
- Table 5: Asia Pacific Pigments Industry Revenue Million Forecast, by Geography 2020 & 2033
- Table 6: Asia Pacific Pigments Industry Volume Kiloton Forecast, by Geography 2020 & 2033
- Table 7: Asia Pacific Pigments Industry Revenue Million Forecast, by Region 2020 & 2033
- Table 8: Asia Pacific Pigments Industry Volume Kiloton Forecast, by Region 2020 & 2033
- Table 9: Asia Pacific Pigments Industry Revenue Million Forecast, by Product Type 2020 & 2033
- Table 10: Asia Pacific Pigments Industry Volume Kiloton Forecast, by Product Type 2020 & 2033
- Table 11: Asia Pacific Pigments Industry Revenue Million Forecast, by Application 2020 & 2033
- Table 12: Asia Pacific Pigments Industry Volume Kiloton Forecast, by Application 2020 & 2033
- Table 13: Asia Pacific Pigments Industry Revenue Million Forecast, by Geography 2020 & 2033
- Table 14: Asia Pacific Pigments Industry Volume Kiloton Forecast, by Geography 2020 & 2033
- Table 15: Asia Pacific Pigments Industry Revenue Million Forecast, by Country 2020 & 2033
- Table 16: Asia Pacific Pigments Industry Volume Kiloton Forecast, by Country 2020 & 2033
- Table 17: Asia Pacific Pigments Industry Revenue Million Forecast, by Product Type 2020 & 2033
- Table 18: Asia Pacific Pigments Industry Volume Kiloton Forecast, by Product Type 2020 & 2033
- Table 19: Asia Pacific Pigments Industry Revenue Million Forecast, by Application 2020 & 2033
- Table 20: Asia Pacific Pigments Industry Volume Kiloton Forecast, by Application 2020 & 2033
- Table 21: Asia Pacific Pigments Industry Revenue Million Forecast, by Geography 2020 & 2033
- Table 22: Asia Pacific Pigments Industry Volume Kiloton Forecast, by Geography 2020 & 2033
- Table 23: Asia Pacific Pigments Industry Revenue Million Forecast, by Country 2020 & 2033
- Table 24: Asia Pacific Pigments Industry Volume Kiloton Forecast, by Country 2020 & 2033
- Table 25: Asia Pacific Pigments Industry Revenue Million Forecast, by Product Type 2020 & 2033
- Table 26: Asia Pacific Pigments Industry Volume Kiloton Forecast, by Product Type 2020 & 2033
- Table 27: Asia Pacific Pigments Industry Revenue Million Forecast, by Application 2020 & 2033
- Table 28: Asia Pacific Pigments Industry Volume Kiloton Forecast, by Application 2020 & 2033
- Table 29: Asia Pacific Pigments Industry Revenue Million Forecast, by Geography 2020 & 2033
- Table 30: Asia Pacific Pigments Industry Volume Kiloton Forecast, by Geography 2020 & 2033
- Table 31: Asia Pacific Pigments Industry Revenue Million Forecast, by Country 2020 & 2033
- Table 32: Asia Pacific Pigments Industry Volume Kiloton Forecast, by Country 2020 & 2033
- Table 33: Asia Pacific Pigments Industry Revenue Million Forecast, by Product Type 2020 & 2033
- Table 34: Asia Pacific Pigments Industry Volume Kiloton Forecast, by Product Type 2020 & 2033
- Table 35: Asia Pacific Pigments Industry Revenue Million Forecast, by Application 2020 & 2033
- Table 36: Asia Pacific Pigments Industry Volume Kiloton Forecast, by Application 2020 & 2033
- Table 37: Asia Pacific Pigments Industry Revenue Million Forecast, by Geography 2020 & 2033
- Table 38: Asia Pacific Pigments Industry Volume Kiloton Forecast, by Geography 2020 & 2033
- Table 39: Asia Pacific Pigments Industry Revenue Million Forecast, by Country 2020 & 2033
- Table 40: Asia Pacific Pigments Industry Volume Kiloton Forecast, by Country 2020 & 2033
- Table 41: Asia Pacific Pigments Industry Revenue Million Forecast, by Product Type 2020 & 2033
- Table 42: Asia Pacific Pigments Industry Volume Kiloton Forecast, by Product Type 2020 & 2033
- Table 43: Asia Pacific Pigments Industry Revenue Million Forecast, by Application 2020 & 2033
- Table 44: Asia Pacific Pigments Industry Volume Kiloton Forecast, by Application 2020 & 2033
- Table 45: Asia Pacific Pigments Industry Revenue Million Forecast, by Geography 2020 & 2033
- Table 46: Asia Pacific Pigments Industry Volume Kiloton Forecast, by Geography 2020 & 2033
- Table 47: Asia Pacific Pigments Industry Revenue Million Forecast, by Country 2020 & 2033
- Table 48: Asia Pacific Pigments Industry Volume Kiloton Forecast, by Country 2020 & 2033
- Table 49: Asia Pacific Pigments Industry Revenue Million Forecast, by Product Type 2020 & 2033
- Table 50: Asia Pacific Pigments Industry Volume Kiloton Forecast, by Product Type 2020 & 2033
- Table 51: Asia Pacific Pigments Industry Revenue Million Forecast, by Application 2020 & 2033
- Table 52: Asia Pacific Pigments Industry Volume Kiloton Forecast, by Application 2020 & 2033
- Table 53: Asia Pacific Pigments Industry Revenue Million Forecast, by Geography 2020 & 2033
- Table 54: Asia Pacific Pigments Industry Volume Kiloton Forecast, by Geography 2020 & 2033
- Table 55: Asia Pacific Pigments Industry Revenue Million Forecast, by Country 2020 & 2033
- Table 56: Asia Pacific Pigments Industry Volume Kiloton Forecast, by Country 2020 & 2033
Frequently Asked Questions
1. What is the projected Compound Annual Growth Rate (CAGR) of the Asia Pacific Pigments Industry?
The projected CAGR is approximately > 5.50%.
2. Which companies are prominent players in the Asia Pacific Pigments Industry?
Key companies in the market include Sudarshan Chemical Industries Limited, Altana AG, Pidilite Industries Ltd, Venator Materials PLC, LANXESS, BASF SE, Wellton Chemical Co Ltd*List Not Exhaustive, The Chemours Company, Tronox Holdings PLC, DIC CORPORATION.
3. What are the main segments of the Asia Pacific Pigments Industry?
The market segments include Product Type, Application, Geography.
4. Can you provide details about the market size?
The market size is estimated to be USD 13.44 Million as of 2022.
5. What are some drivers contributing to market growth?
Growing Demand From the Paints and Coatings Industry; Rising Demand from the Textile Industry; The Increasing Demand for Pigments from Plastics Applications.
6. What are the notable trends driving market growth?
Increasing Demand from the Paints and Coatings Industry.
7. Are there any restraints impacting market growth?
Stringent Government Regulations on the usage of Pigments; High Cost Associated with the Organic Pigments.
8. Can you provide examples of recent developments in the market?
November 2022: Cathay Industries declared the successful acquisition of Venator Materials PLC's iron oxide pigment business. This strategic move is expected to facilitate the expansion of Cathay Industries' global manufacturing presence.
9. What pricing options are available for accessing the report?
Pricing options include single-user, multi-user, and enterprise licenses priced at USD 4750, USD 5250, and USD 8750 respectively.
10. Is the market size provided in terms of value or volume?
The market size is provided in terms of value, measured in Million and volume, measured in Kiloton.
11. Are there any specific market keywords associated with the report?
Yes, the market keyword associated with the report is "Asia Pacific Pigments Industry," which aids in identifying and referencing the specific market segment covered.
12. How do I determine which pricing option suits my needs best?
The pricing options vary based on user requirements and access needs. Individual users may opt for single-user licenses, while businesses requiring broader access may choose multi-user or enterprise licenses for cost-effective access to the report.
13. Are there any additional resources or data provided in the Asia Pacific Pigments Industry report?
While the report offers comprehensive insights, it's advisable to review the specific contents or supplementary materials provided to ascertain if additional resources or data are available.
14. How can I stay updated on further developments or reports in the Asia Pacific Pigments Industry?
To stay informed about further developments, trends, and reports in the Asia Pacific Pigments Industry, consider subscribing to industry newsletters, following relevant companies and organizations, or regularly checking reputable industry news sources and publications.
Methodology
Step 1 - Identification of Relevant Samples Size from Population Database


Step 2 - Approaches for Defining Global Market Size (Value, Volume* & Price*)

Note*: In applicable scenarios
Step 3 - Data Sources
Primary Research
- Web Analytics
- Survey Reports
- Research Institute
- Latest Research Reports
- Opinion Leaders
Secondary Research
- Annual Reports
- White Paper
- Latest Press Release
- Industry Association
- Paid Database
- Investor Presentations

Step 4 - Data Triangulation
Involves using different sources of information in order to increase the validity of a study
These sources are likely to be stakeholders in a program - participants, other researchers, program staff, other community members, and so on.
Then we put all data in single framework & apply various statistical tools to find out the dynamic on the market.
During the analysis stage, feedback from the stakeholder groups would be compared to determine areas of agreement as well as areas of divergence