

Key Insights
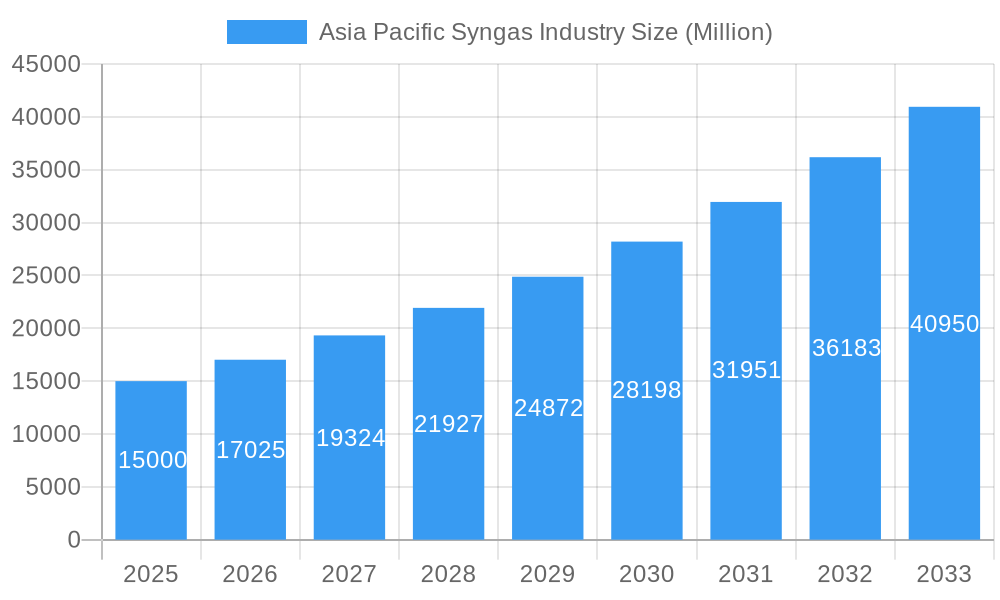
The Asia-Pacific syngas market is experiencing substantial growth, projected to expand at a CAGR of 6.4%. By 2033, the market is anticipated to reach a valuation of 44.39 billion. This growth is primarily driven by escalating energy requirements across the region, particularly in rapidly industrializing economies such as China and India. Syngas production in Asia-Pacific utilizes a variety of feedstocks, including coal, natural gas, petroleum, and biomass. Key technologies like steam reforming and partial oxidation are continuously being optimized for enhanced efficiency and reduced environmental impact. The expanding chemical and power generation sectors, which depend heavily on syngas as a vital feedstock, further propel market expansion. While steam reforming and coal are expected to maintain significant market shares, emerging trends indicate a growing preference for cleaner energy sources like biomass and the adoption of advanced gasification technologies. Market dynamics are influenced by volatile energy prices and increasingly stringent environmental regulations, driving the need for cleaner production methods and carbon capture solutions. Feedstock availability and cost across the Asia-Pacific region also significantly shape market progression.
Asia Pacific Syngas Industry Market Size (In Billion)
Leading market participants such as Haldor Topsoe, GE, and Air Products underscore the capital-intensive nature and technological sophistication inherent in syngas production. However, regional entities and innovative technologies are progressively challenging established players, leading to a more competitive market landscape. Future expansion will be contingent upon ongoing technological advancements, supportive governmental policies promoting renewable energy and sustainable industrial practices, and effective management of environmental concerns associated with syngas generation. This intricate interplay of factors suggests robust growth potential for the Asia-Pacific syngas market, with the pace influenced by evolving energy trends and the adept handling of associated environmental and economic challenges.
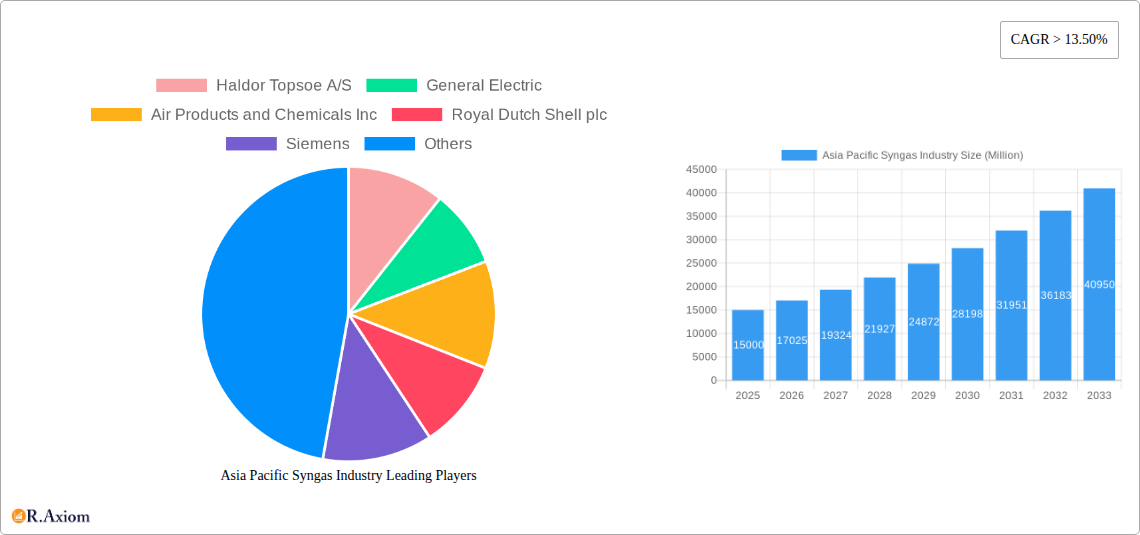
Asia Pacific Syngas Industry Company Market Share
This report offers a comprehensive analysis of the Asia-Pacific syngas industry, detailing market size, growth drivers, challenges, and future opportunities. The study period spans 2019-2033, with 2024 designated as the base year. The forecast period extends from 2025 to 2033, with historical data covering 2019-2024. This research is invaluable for industry stakeholders, investors, and businesses aiming to understand and navigate this dynamic market, providing actionable intelligence through extensive data analysis and expert insights.
Asia Pacific Syngas Industry Market Concentration & Innovation
This section analyzes the competitive landscape of the Asia Pacific syngas industry, encompassing market concentration, innovation drivers, regulatory frameworks, product substitutes, end-user trends, and M&A activities. The market is moderately concentrated, with several major players holding significant market share. However, the presence of numerous smaller players fosters innovation and competition.
Market Concentration: The top five players account for approximately xx% of the total market share in 2025, indicating a moderately concentrated market. This concentration is expected to remain relatively stable through 2033, with minor shifts based on strategic acquisitions and technological advancements.
Innovation Drivers: Several factors drive innovation in the industry, including:
- Stringent environmental regulations pushing for cleaner production methods.
- The growing demand for renewable energy sources and the development of biomass gasification technologies.
- Advancements in gasification technologies, leading to improved efficiency and lower costs.
- Continuous efforts to enhance the quality and versatility of syngas produced from diverse feedstocks.
Regulatory Frameworks: Government policies and regulations play a crucial role, incentivizing the adoption of cleaner technologies and influencing investment decisions. Varying policies across different Asia Pacific countries create a complex regulatory landscape.
Product Substitutes: The main substitutes for syngas include natural gas, electricity, and other alternative fuels. However, syngas retains its advantage in specific applications, owing to its versatility and unique properties.
End-User Trends: The growing demand for power generation, chemicals, and liquid fuels, especially in rapidly developing economies within the Asia Pacific region, is a primary driver for syngas market expansion.
M&A Activities: The Asia Pacific syngas industry has witnessed several mergers and acquisitions in recent years. Total deal values for M&A activities between 2019 and 2024 reached approximately xx Million USD. These activities are primarily driven by strategic expansion, technology acquisition, and consolidation within the market.
Asia Pacific Syngas Industry Industry Trends & Insights
The Asia Pacific syngas industry is poised for significant growth driven by several key factors. The market is expected to witness a CAGR of xx% during the forecast period (2025-2033). This robust growth is fueled by rising energy demand, increasing industrialization, and government initiatives promoting cleaner energy sources. Technological advancements, such as improved gasification technologies and the development of carbon capture and storage solutions, further contribute to the industry's expansion. Market penetration of syngas in diverse applications, like power generation and chemical manufacturing, is also expected to increase significantly. Competitive dynamics are shaped by technological innovation, cost efficiency, and strategic partnerships. The increasing adoption of renewable feedstocks like biomass is reshaping the competitive landscape, creating opportunities for companies investing in sustainable syngas production. Consumer preferences are shifting towards environmentally friendly energy solutions, prompting a greater focus on sustainability within the industry.
Dominant Markets & Segments in Asia Pacific Syngas Industry
This section analyzes the dominant regions, countries, and segments within the Asia Pacific syngas market. China and India emerge as dominant markets, driven by rapid industrialization and significant investments in energy infrastructure.
Dominant Feedstock: Natural gas currently holds the largest market share among feedstocks, due to its widespread availability and relatively lower cost. However, the increasing focus on sustainability is driving a shift towards biomass as a significant feedstock in the future.
Dominant Technology: Steam reforming remains the most prevalent technology due to its maturity and established infrastructure. However, partial oxidation and auto-thermal reforming are gaining traction due to their higher efficiency in certain applications.
Dominant Gasifier Type: Entrained flow gasifiers dominate due to their ability to handle a wider range of feedstocks and achieve higher throughput.
Dominant Application: Power generation currently holds the largest share of syngas applications, followed by the chemicals sector. The demand for syngas in both sectors is expected to rise significantly during the forecast period.
Key Drivers:
- Economic Policies: Government incentives and support for renewable energy and industrial development are key drivers.
- Infrastructure Development: Investments in gas pipelines and transportation networks support syngas utilization.
- Technological Advancements: Efficiency improvements and cost reductions in gasification technologies stimulate growth.
Asia Pacific Syngas Industry Product Developments
Recent product developments focus on enhanced efficiency, lower emissions, and broader feedstock flexibility. Innovations include advanced gasification technologies with integrated carbon capture, enabling cleaner and more sustainable syngas production. New applications are emerging in the production of liquid fuels and chemicals, expanding the market for syngas. The market fit is strong for these innovations due to growing environmental concerns and increasing demand for efficient and versatile energy sources.
Report Scope & Segmentation Analysis
This report provides a detailed analysis of the Asia Pacific syngas market across various segments.
Feedstock: Coal, Natural Gas, Petroleum, Pet Coke, Biomass – Each segment's market size, growth projections, and competitive dynamics are analyzed. Natural gas is the largest segment, followed by coal and biomass. Growth is projected to be highest in the biomass segment.
Technology: Steam Reforming, Partial Oxidation, Auto-thermal Reforming, Combined or Two-step Reforming, Biomass Gasification – Market share and growth projections are detailed for each technology. Steam reforming holds the largest share, but other technologies are gaining traction.
Gasifier Type: Fixed Bed, Entrained Flow, Fluidized Bed – Market share and growth projections are presented for each gasifier type, with entrained flow gasifiers showing the most significant growth.
Application: Power Generation, Chemicals, Dimethyl Ether: Liquid Fuels, Gaseous Fuels – Market analysis is provided for each application, with power generation currently dominating. Chemical applications are expected to show the highest growth.
Key Drivers of Asia Pacific Syngas Industry Growth
The Asia Pacific syngas market is driven by several key factors, including rising energy demand, government support for cleaner energy sources, technological advancements leading to higher efficiency and lower costs, and the increasing use of syngas in diverse industrial applications. Expanding industrialization, particularly in developing economies, further fuels this growth. Government policies supporting renewable energy and industrial development are also major growth stimulants.
Challenges in the Asia Pacific Syngas Industry Sector
The industry faces challenges such as stringent environmental regulations, fluctuating feedstock prices, and the need for significant capital investment in new plants and infrastructure. Supply chain disruptions and competition from alternative energy sources also pose considerable challenges. The overall impact of these challenges on market growth is estimated to be approximately xx Million USD annually.
Emerging Opportunities in Asia Pacific Syngas Industry
Emerging opportunities include the growing adoption of biomass gasification, which offers a sustainable and environmentally friendly alternative, and the development of new applications for syngas in chemicals and liquid fuels production. Expanding into new markets within the Asia Pacific region, particularly those with developing energy infrastructure, also presents significant opportunities.
Leading Players in the Asia Pacific Syngas Industry Market
- Haldor Topsoe A/S
- General Electric
- Air Products and Chemicals Inc
- Royal Dutch Shell plc
- Siemens
- KBR Inc
- BASF SE
- Sasol
- DuPont
- Linde plc
- SynGas Technology LLC
- Air Liquide
- BP plc
- TechnipFMC plc *List Not Exhaustive
Key Developments in Asia Pacific Syngas Industry Industry
- September 2023: BASF SE initiated the construction of its syngas plant in Zhanjiang, China, expanding its production capacity and strengthening its market position.
- December 2022: Reliance Industries Ltd announced plans to manufacture blue hydrogen, boosting the syngas market in India.
- December 2022: New Era Cleantech invested USD 2.5 Billion in a coal gasification plant in India, diversifying product offerings and expanding the syngas market.
Strategic Outlook for Asia Pacific Syngas Industry Market
The Asia Pacific syngas market exhibits substantial growth potential driven by increasing energy demand, industrialization, and the growing adoption of cleaner energy sources. Technological innovations and supportive government policies further contribute to this positive outlook. The market is expected to witness significant expansion across diverse applications, with opportunities for growth in both established and emerging markets within the region.
Asia Pacific Syngas Industry Segmentation
-
1. Feedstock
- 1.1. Coal
- 1.2. Natural Gas
- 1.3. Petroleum
- 1.4. Pet Coke
- 1.5. Biomass
-
2. Technology
- 2.1. Steam Reforming
- 2.2. Partial Oxidation
- 2.3. Auto-thermal Reforming
- 2.4. Combined or Two-step Reforming
- 2.5. Biomass Gasification
-
3. Gasifier Type
- 3.1. Fixed Bed
- 3.2. Entrained Flow
- 3.3. Fluidized Bed
-
4. Application
- 4.1. Power Generation
-
4.2. Chemicals
- 4.2.1. Methanol
- 4.2.2. Ammonia
- 4.2.3. Oxo Chemicals
- 4.2.4. n-Butanol
- 4.2.5. Hydrogen
- 4.2.6. Dimethyl Ether
- 4.3. Liquid Fuels
- 4.4. Gaseous Fuels
-
5. Geography
- 5.1. China
- 5.2. India
- 5.3. Japan
- 5.4. South Korea
- 5.5. Australia & New Zealand
- 5.6. Rest of Asia-Pacific
Asia Pacific Syngas Industry Segmentation By Geography
- 1. China
- 2. India
- 3. Japan
- 4. South Korea
- 5. Australia
- 6. Rest of Asia Pacific
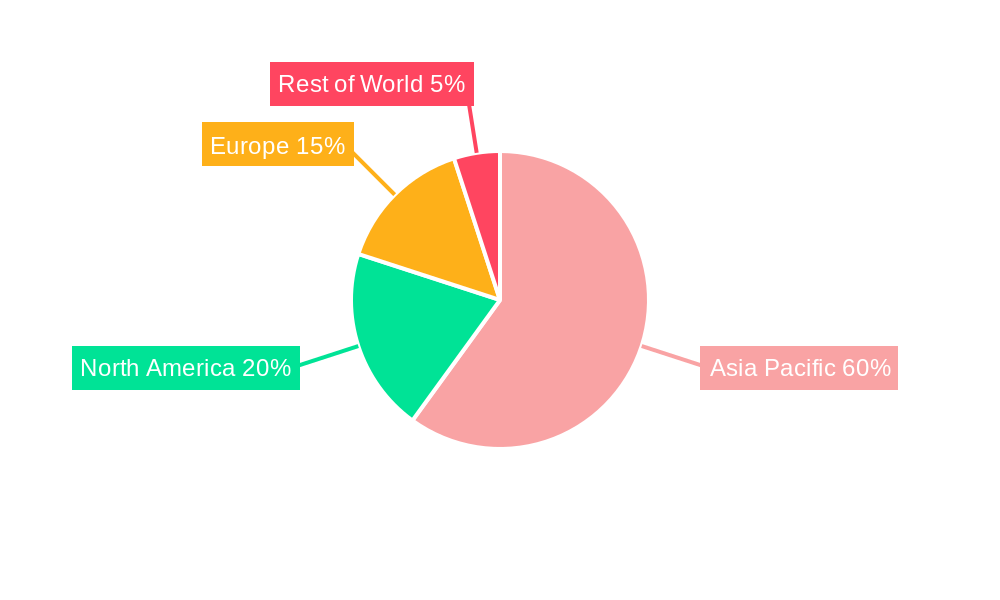
Asia Pacific Syngas Industry Regional Market Share
Geographic Coverage of Asia Pacific Syngas Industry
Asia Pacific Syngas Industry REPORT HIGHLIGHTS
| Aspects | Details |
|---|---|
| Study Period | 2020-2034 |
| Base Year | 2025 |
| Estimated Year | 2026 |
| Forecast Period | 2026-2034 |
| Historical Period | 2020-2025 |
| Growth Rate | CAGR of 6.4% from 2020-2034 |
| Segmentation |
|
Table of Contents
- 1. Introduction
- 1.1. Research Scope
- 1.2. Market Segmentation
- 1.3. Research Objective
- 1.4. Definitions and Assumptions
- 2. Executive Summary
- 2.1. Market Snapshot
- 3. Market Dynamics
- 3.1. Market Drivers
- 3.2. Market Restrains
- 3.3. Market Trends
- 3.4. Market Opportunities
- 4. Market Factor Analysis
- 4.1. Porters Five Forces
- 4.1.1. Bargaining Power of Suppliers
- 4.1.2. Bargaining Power of Buyers
- 4.1.3. Threat of New Entrants
- 4.1.4. Threat of Substitutes
- 4.1.5. Competitive Rivalry
- 4.2. PESTEL analysis
- 4.3. BCG Analysis
- 4.3.1. Stars (High Growth, High Market Share)
- 4.3.2. Cash Cows (Low Growth, High Market Share)
- 4.3.3. Question Mark (High Growth, Low Market Share)
- 4.3.4. Dogs (Low Growth, Low Market Share)
- 4.4. Ansoff Matrix Analysis
- 4.5. Supply Chain Analysis
- 4.6. Regulatory Landscape
- 4.7. Current Market Potential and Opportunity Assessment (TAM–SAM–SOM Framework)
- 4.8. RAX Analyst Note
- 4.1. Porters Five Forces
- 5. Market Analysis, Insights and Forecast 2021-2033
- 5.1. Market Analysis, Insights and Forecast - by Feedstock
- 5.1.1. Coal
- 5.1.2. Natural Gas
- 5.1.3. Petroleum
- 5.1.4. Pet Coke
- 5.1.5. Biomass
- 5.2. Market Analysis, Insights and Forecast - by Technology
- 5.2.1. Steam Reforming
- 5.2.2. Partial Oxidation
- 5.2.3. Auto-thermal Reforming
- 5.2.4. Combined or Two-step Reforming
- 5.2.5. Biomass Gasification
- 5.3. Market Analysis, Insights and Forecast - by Gasifier Type
- 5.3.1. Fixed Bed
- 5.3.2. Entrained Flow
- 5.3.3. Fluidized Bed
- 5.4. Market Analysis, Insights and Forecast - by Application
- 5.4.1. Power Generation
- 5.4.2. Chemicals
- 5.4.2.1. Methanol
- 5.4.2.2. Ammonia
- 5.4.2.3. Oxo Chemicals
- 5.4.2.4. n-Butanol
- 5.4.2.5. Hydrogen
- 5.4.2.6. Dimethyl Ether
- 5.4.3. Liquid Fuels
- 5.4.4. Gaseous Fuels
- 5.5. Market Analysis, Insights and Forecast - by Geography
- 5.5.1. China
- 5.5.2. India
- 5.5.3. Japan
- 5.5.4. South Korea
- 5.5.5. Australia & New Zealand
- 5.5.6. Rest of Asia-Pacific
- 5.6. Market Analysis, Insights and Forecast - by Region
- 5.6.1. China
- 5.6.2. India
- 5.6.3. Japan
- 5.6.4. South Korea
- 5.6.5. Australia
- 5.6.6. Rest of Asia Pacific
- 5.1. Market Analysis, Insights and Forecast - by Feedstock
- 6. Asia Pacific Syngas Industry Analysis, Insights and Forecast, 2021-2033
- 6.1. Market Analysis, Insights and Forecast - by Feedstock
- 6.1.1. Coal
- 6.1.2. Natural Gas
- 6.1.3. Petroleum
- 6.1.4. Pet Coke
- 6.1.5. Biomass
- 6.2. Market Analysis, Insights and Forecast - by Technology
- 6.2.1. Steam Reforming
- 6.2.2. Partial Oxidation
- 6.2.3. Auto-thermal Reforming
- 6.2.4. Combined or Two-step Reforming
- 6.2.5. Biomass Gasification
- 6.3. Market Analysis, Insights and Forecast - by Gasifier Type
- 6.3.1. Fixed Bed
- 6.3.2. Entrained Flow
- 6.3.3. Fluidized Bed
- 6.4. Market Analysis, Insights and Forecast - by Application
- 6.4.1. Power Generation
- 6.4.2. Chemicals
- 6.4.2.1. Methanol
- 6.4.2.2. Ammonia
- 6.4.2.3. Oxo Chemicals
- 6.4.2.4. n-Butanol
- 6.4.2.5. Hydrogen
- 6.4.2.6. Dimethyl Ether
- 6.4.3. Liquid Fuels
- 6.4.4. Gaseous Fuels
- 6.5. Market Analysis, Insights and Forecast - by Geography
- 6.5.1. China
- 6.5.2. India
- 6.5.3. Japan
- 6.5.4. South Korea
- 6.5.5. Australia & New Zealand
- 6.5.6. Rest of Asia-Pacific
- 6.1. Market Analysis, Insights and Forecast - by Feedstock
- 7. China Asia Pacific Syngas Industry Analysis, Insights and Forecast, 2020-2032
- 7.1. Market Analysis, Insights and Forecast - by Feedstock
- 7.1.1. Coal
- 7.1.2. Natural Gas
- 7.1.3. Petroleum
- 7.1.4. Pet Coke
- 7.1.5. Biomass
- 7.2. Market Analysis, Insights and Forecast - by Technology
- 7.2.1. Steam Reforming
- 7.2.2. Partial Oxidation
- 7.2.3. Auto-thermal Reforming
- 7.2.4. Combined or Two-step Reforming
- 7.2.5. Biomass Gasification
- 7.3. Market Analysis, Insights and Forecast - by Gasifier Type
- 7.3.1. Fixed Bed
- 7.3.2. Entrained Flow
- 7.3.3. Fluidized Bed
- 7.4. Market Analysis, Insights and Forecast - by Application
- 7.4.1. Power Generation
- 7.4.2. Chemicals
- 7.4.2.1. Methanol
- 7.4.2.2. Ammonia
- 7.4.2.3. Oxo Chemicals
- 7.4.2.4. n-Butanol
- 7.4.2.5. Hydrogen
- 7.4.2.6. Dimethyl Ether
- 7.4.3. Liquid Fuels
- 7.4.4. Gaseous Fuels
- 7.5. Market Analysis, Insights and Forecast - by Geography
- 7.5.1. China
- 7.5.2. India
- 7.5.3. Japan
- 7.5.4. South Korea
- 7.5.5. Australia & New Zealand
- 7.5.6. Rest of Asia-Pacific
- 7.1. Market Analysis, Insights and Forecast - by Feedstock
- 8. India Asia Pacific Syngas Industry Analysis, Insights and Forecast, 2020-2032
- 8.1. Market Analysis, Insights and Forecast - by Feedstock
- 8.1.1. Coal
- 8.1.2. Natural Gas
- 8.1.3. Petroleum
- 8.1.4. Pet Coke
- 8.1.5. Biomass
- 8.2. Market Analysis, Insights and Forecast - by Technology
- 8.2.1. Steam Reforming
- 8.2.2. Partial Oxidation
- 8.2.3. Auto-thermal Reforming
- 8.2.4. Combined or Two-step Reforming
- 8.2.5. Biomass Gasification
- 8.3. Market Analysis, Insights and Forecast - by Gasifier Type
- 8.3.1. Fixed Bed
- 8.3.2. Entrained Flow
- 8.3.3. Fluidized Bed
- 8.4. Market Analysis, Insights and Forecast - by Application
- 8.4.1. Power Generation
- 8.4.2. Chemicals
- 8.4.2.1. Methanol
- 8.4.2.2. Ammonia
- 8.4.2.3. Oxo Chemicals
- 8.4.2.4. n-Butanol
- 8.4.2.5. Hydrogen
- 8.4.2.6. Dimethyl Ether
- 8.4.3. Liquid Fuels
- 8.4.4. Gaseous Fuels
- 8.5. Market Analysis, Insights and Forecast - by Geography
- 8.5.1. China
- 8.5.2. India
- 8.5.3. Japan
- 8.5.4. South Korea
- 8.5.5. Australia & New Zealand
- 8.5.6. Rest of Asia-Pacific
- 8.1. Market Analysis, Insights and Forecast - by Feedstock
- 9. Japan Asia Pacific Syngas Industry Analysis, Insights and Forecast, 2020-2032
- 9.1. Market Analysis, Insights and Forecast - by Feedstock
- 9.1.1. Coal
- 9.1.2. Natural Gas
- 9.1.3. Petroleum
- 9.1.4. Pet Coke
- 9.1.5. Biomass
- 9.2. Market Analysis, Insights and Forecast - by Technology
- 9.2.1. Steam Reforming
- 9.2.2. Partial Oxidation
- 9.2.3. Auto-thermal Reforming
- 9.2.4. Combined or Two-step Reforming
- 9.2.5. Biomass Gasification
- 9.3. Market Analysis, Insights and Forecast - by Gasifier Type
- 9.3.1. Fixed Bed
- 9.3.2. Entrained Flow
- 9.3.3. Fluidized Bed
- 9.4. Market Analysis, Insights and Forecast - by Application
- 9.4.1. Power Generation
- 9.4.2. Chemicals
- 9.4.2.1. Methanol
- 9.4.2.2. Ammonia
- 9.4.2.3. Oxo Chemicals
- 9.4.2.4. n-Butanol
- 9.4.2.5. Hydrogen
- 9.4.2.6. Dimethyl Ether
- 9.4.3. Liquid Fuels
- 9.4.4. Gaseous Fuels
- 9.5. Market Analysis, Insights and Forecast - by Geography
- 9.5.1. China
- 9.5.2. India
- 9.5.3. Japan
- 9.5.4. South Korea
- 9.5.5. Australia & New Zealand
- 9.5.6. Rest of Asia-Pacific
- 9.1. Market Analysis, Insights and Forecast - by Feedstock
- 10. South Korea Asia Pacific Syngas Industry Analysis, Insights and Forecast, 2020-2032
- 10.1. Market Analysis, Insights and Forecast - by Feedstock
- 10.1.1. Coal
- 10.1.2. Natural Gas
- 10.1.3. Petroleum
- 10.1.4. Pet Coke
- 10.1.5. Biomass
- 10.2. Market Analysis, Insights and Forecast - by Technology
- 10.2.1. Steam Reforming
- 10.2.2. Partial Oxidation
- 10.2.3. Auto-thermal Reforming
- 10.2.4. Combined or Two-step Reforming
- 10.2.5. Biomass Gasification
- 10.3. Market Analysis, Insights and Forecast - by Gasifier Type
- 10.3.1. Fixed Bed
- 10.3.2. Entrained Flow
- 10.3.3. Fluidized Bed
- 10.4. Market Analysis, Insights and Forecast - by Application
- 10.4.1. Power Generation
- 10.4.2. Chemicals
- 10.4.2.1. Methanol
- 10.4.2.2. Ammonia
- 10.4.2.3. Oxo Chemicals
- 10.4.2.4. n-Butanol
- 10.4.2.5. Hydrogen
- 10.4.2.6. Dimethyl Ether
- 10.4.3. Liquid Fuels
- 10.4.4. Gaseous Fuels
- 10.5. Market Analysis, Insights and Forecast - by Geography
- 10.5.1. China
- 10.5.2. India
- 10.5.3. Japan
- 10.5.4. South Korea
- 10.5.5. Australia & New Zealand
- 10.5.6. Rest of Asia-Pacific
- 10.1. Market Analysis, Insights and Forecast - by Feedstock
- 11. Australia Asia Pacific Syngas Industry Analysis, Insights and Forecast, 2020-2032
- 11.1. Market Analysis, Insights and Forecast - by Feedstock
- 11.1.1. Coal
- 11.1.2. Natural Gas
- 11.1.3. Petroleum
- 11.1.4. Pet Coke
- 11.1.5. Biomass
- 11.2. Market Analysis, Insights and Forecast - by Technology
- 11.2.1. Steam Reforming
- 11.2.2. Partial Oxidation
- 11.2.3. Auto-thermal Reforming
- 11.2.4. Combined or Two-step Reforming
- 11.2.5. Biomass Gasification
- 11.3. Market Analysis, Insights and Forecast - by Gasifier Type
- 11.3.1. Fixed Bed
- 11.3.2. Entrained Flow
- 11.3.3. Fluidized Bed
- 11.4. Market Analysis, Insights and Forecast - by Application
- 11.4.1. Power Generation
- 11.4.2. Chemicals
- 11.4.2.1. Methanol
- 11.4.2.2. Ammonia
- 11.4.2.3. Oxo Chemicals
- 11.4.2.4. n-Butanol
- 11.4.2.5. Hydrogen
- 11.4.2.6. Dimethyl Ether
- 11.4.3. Liquid Fuels
- 11.4.4. Gaseous Fuels
- 11.5. Market Analysis, Insights and Forecast - by Geography
- 11.5.1. China
- 11.5.2. India
- 11.5.3. Japan
- 11.5.4. South Korea
- 11.5.5. Australia & New Zealand
- 11.5.6. Rest of Asia-Pacific
- 11.1. Market Analysis, Insights and Forecast - by Feedstock
- 12. Rest of Asia Pacific Asia Pacific Syngas Industry Analysis, Insights and Forecast, 2020-2032
- 12.1. Market Analysis, Insights and Forecast - by Feedstock
- 12.1.1. Coal
- 12.1.2. Natural Gas
- 12.1.3. Petroleum
- 12.1.4. Pet Coke
- 12.1.5. Biomass
- 12.2. Market Analysis, Insights and Forecast - by Technology
- 12.2.1. Steam Reforming
- 12.2.2. Partial Oxidation
- 12.2.3. Auto-thermal Reforming
- 12.2.4. Combined or Two-step Reforming
- 12.2.5. Biomass Gasification
- 12.3. Market Analysis, Insights and Forecast - by Gasifier Type
- 12.3.1. Fixed Bed
- 12.3.2. Entrained Flow
- 12.3.3. Fluidized Bed
- 12.4. Market Analysis, Insights and Forecast - by Application
- 12.4.1. Power Generation
- 12.4.2. Chemicals
- 12.4.2.1. Methanol
- 12.4.2.2. Ammonia
- 12.4.2.3. Oxo Chemicals
- 12.4.2.4. n-Butanol
- 12.4.2.5. Hydrogen
- 12.4.2.6. Dimethyl Ether
- 12.4.3. Liquid Fuels
- 12.4.4. Gaseous Fuels
- 12.5. Market Analysis, Insights and Forecast - by Geography
- 12.5.1. China
- 12.5.2. India
- 12.5.3. Japan
- 12.5.4. South Korea
- 12.5.5. Australia & New Zealand
- 12.5.6. Rest of Asia-Pacific
- 12.1. Market Analysis, Insights and Forecast - by Feedstock
- 13. Competitive Analysis
- 13.1. Company Profiles
- 13.1.1 Haldor Topsoe A/S
- 13.1.1.1. Company Overview
- 13.1.1.2. Products
- 13.1.1.3. Company Financials
- 13.1.1.4. SWOT Analysis
- 13.1.2 General Electric
- 13.1.2.1. Company Overview
- 13.1.2.2. Products
- 13.1.2.3. Company Financials
- 13.1.2.4. SWOT Analysis
- 13.1.3 Air Products and Chemicals Inc
- 13.1.3.1. Company Overview
- 13.1.3.2. Products
- 13.1.3.3. Company Financials
- 13.1.3.4. SWOT Analysis
- 13.1.4 Royal Dutch Shell plc
- 13.1.4.1. Company Overview
- 13.1.4.2. Products
- 13.1.4.3. Company Financials
- 13.1.4.4. SWOT Analysis
- 13.1.5 Siemens
- 13.1.5.1. Company Overview
- 13.1.5.2. Products
- 13.1.5.3. Company Financials
- 13.1.5.4. SWOT Analysis
- 13.1.6 KBR Inc
- 13.1.6.1. Company Overview
- 13.1.6.2. Products
- 13.1.6.3. Company Financials
- 13.1.6.4. SWOT Analysis
- 13.1.7 BASF SE
- 13.1.7.1. Company Overview
- 13.1.7.2. Products
- 13.1.7.3. Company Financials
- 13.1.7.4. SWOT Analysis
- 13.1.8 Sasol
- 13.1.8.1. Company Overview
- 13.1.8.2. Products
- 13.1.8.3. Company Financials
- 13.1.8.4. SWOT Analysis
- 13.1.9 DuPont
- 13.1.9.1. Company Overview
- 13.1.9.2. Products
- 13.1.9.3. Company Financials
- 13.1.9.4. SWOT Analysis
- 13.1.10 Linde plc
- 13.1.10.1. Company Overview
- 13.1.10.2. Products
- 13.1.10.3. Company Financials
- 13.1.10.4. SWOT Analysis
- 13.1.11 SynGas Technology LLC
- 13.1.11.1. Company Overview
- 13.1.11.2. Products
- 13.1.11.3. Company Financials
- 13.1.11.4. SWOT Analysis
- 13.1.12 Air Liquide
- 13.1.12.1. Company Overview
- 13.1.12.2. Products
- 13.1.12.3. Company Financials
- 13.1.12.4. SWOT Analysis
- 13.1.13 BP p l c
- 13.1.13.1. Company Overview
- 13.1.13.2. Products
- 13.1.13.3. Company Financials
- 13.1.13.4. SWOT Analysis
- 13.1.14 TechnipFMC plc*List Not Exhaustive
- 13.1.14.1. Company Overview
- 13.1.14.2. Products
- 13.1.14.3. Company Financials
- 13.1.14.4. SWOT Analysis
- 13.1.1 Haldor Topsoe A/S
- 13.2. Market Entropy
- 13.2.1 Company's Key Areas Served
- 13.2.2 Recent Developments
- 13.3. Company Market Share Analysis 2025
- 13.3.1 Top 5 Companies Market Share Analysis
- 13.3.2 Top 3 Companies Market Share Analysis
- 13.4. List of Potential Customers
- 14. Research Methodology
List of Figures
- Figure 1: Asia Pacific Syngas Industry Revenue Breakdown (billion, %) by Product 2025 & 2033
- Figure 2: Asia Pacific Syngas Industry Share (%) by Company 2025
List of Tables
- Table 1: Asia Pacific Syngas Industry Revenue billion Forecast, by Feedstock 2020 & 2033
- Table 2: Asia Pacific Syngas Industry Volume Million Forecast, by Feedstock 2020 & 2033
- Table 3: Asia Pacific Syngas Industry Revenue billion Forecast, by Technology 2020 & 2033
- Table 4: Asia Pacific Syngas Industry Volume Million Forecast, by Technology 2020 & 2033
- Table 5: Asia Pacific Syngas Industry Revenue billion Forecast, by Gasifier Type 2020 & 2033
- Table 6: Asia Pacific Syngas Industry Volume Million Forecast, by Gasifier Type 2020 & 2033
- Table 7: Asia Pacific Syngas Industry Revenue billion Forecast, by Application 2020 & 2033
- Table 8: Asia Pacific Syngas Industry Volume Million Forecast, by Application 2020 & 2033
- Table 9: Asia Pacific Syngas Industry Revenue billion Forecast, by Geography 2020 & 2033
- Table 10: Asia Pacific Syngas Industry Volume Million Forecast, by Geography 2020 & 2033
- Table 11: Asia Pacific Syngas Industry Revenue billion Forecast, by Region 2020 & 2033
- Table 12: Asia Pacific Syngas Industry Volume Million Forecast, by Region 2020 & 2033
- Table 13: Asia Pacific Syngas Industry Revenue billion Forecast, by Feedstock 2020 & 2033
- Table 14: Asia Pacific Syngas Industry Volume Million Forecast, by Feedstock 2020 & 2033
- Table 15: Asia Pacific Syngas Industry Revenue billion Forecast, by Technology 2020 & 2033
- Table 16: Asia Pacific Syngas Industry Volume Million Forecast, by Technology 2020 & 2033
- Table 17: Asia Pacific Syngas Industry Revenue billion Forecast, by Gasifier Type 2020 & 2033
- Table 18: Asia Pacific Syngas Industry Volume Million Forecast, by Gasifier Type 2020 & 2033
- Table 19: Asia Pacific Syngas Industry Revenue billion Forecast, by Application 2020 & 2033
- Table 20: Asia Pacific Syngas Industry Volume Million Forecast, by Application 2020 & 2033
- Table 21: Asia Pacific Syngas Industry Revenue billion Forecast, by Geography 2020 & 2033
- Table 22: Asia Pacific Syngas Industry Volume Million Forecast, by Geography 2020 & 2033
- Table 23: Asia Pacific Syngas Industry Revenue billion Forecast, by Country 2020 & 2033
- Table 24: Asia Pacific Syngas Industry Volume Million Forecast, by Country 2020 & 2033
- Table 25: Asia Pacific Syngas Industry Revenue billion Forecast, by Feedstock 2020 & 2033
- Table 26: Asia Pacific Syngas Industry Volume Million Forecast, by Feedstock 2020 & 2033
- Table 27: Asia Pacific Syngas Industry Revenue billion Forecast, by Technology 2020 & 2033
- Table 28: Asia Pacific Syngas Industry Volume Million Forecast, by Technology 2020 & 2033
- Table 29: Asia Pacific Syngas Industry Revenue billion Forecast, by Gasifier Type 2020 & 2033
- Table 30: Asia Pacific Syngas Industry Volume Million Forecast, by Gasifier Type 2020 & 2033
- Table 31: Asia Pacific Syngas Industry Revenue billion Forecast, by Application 2020 & 2033
- Table 32: Asia Pacific Syngas Industry Volume Million Forecast, by Application 2020 & 2033
- Table 33: Asia Pacific Syngas Industry Revenue billion Forecast, by Geography 2020 & 2033
- Table 34: Asia Pacific Syngas Industry Volume Million Forecast, by Geography 2020 & 2033
- Table 35: Asia Pacific Syngas Industry Revenue billion Forecast, by Country 2020 & 2033
- Table 36: Asia Pacific Syngas Industry Volume Million Forecast, by Country 2020 & 2033
- Table 37: Asia Pacific Syngas Industry Revenue billion Forecast, by Feedstock 2020 & 2033
- Table 38: Asia Pacific Syngas Industry Volume Million Forecast, by Feedstock 2020 & 2033
- Table 39: Asia Pacific Syngas Industry Revenue billion Forecast, by Technology 2020 & 2033
- Table 40: Asia Pacific Syngas Industry Volume Million Forecast, by Technology 2020 & 2033
- Table 41: Asia Pacific Syngas Industry Revenue billion Forecast, by Gasifier Type 2020 & 2033
- Table 42: Asia Pacific Syngas Industry Volume Million Forecast, by Gasifier Type 2020 & 2033
- Table 43: Asia Pacific Syngas Industry Revenue billion Forecast, by Application 2020 & 2033
- Table 44: Asia Pacific Syngas Industry Volume Million Forecast, by Application 2020 & 2033
- Table 45: Asia Pacific Syngas Industry Revenue billion Forecast, by Geography 2020 & 2033
- Table 46: Asia Pacific Syngas Industry Volume Million Forecast, by Geography 2020 & 2033
- Table 47: Asia Pacific Syngas Industry Revenue billion Forecast, by Country 2020 & 2033
- Table 48: Asia Pacific Syngas Industry Volume Million Forecast, by Country 2020 & 2033
- Table 49: Asia Pacific Syngas Industry Revenue billion Forecast, by Feedstock 2020 & 2033
- Table 50: Asia Pacific Syngas Industry Volume Million Forecast, by Feedstock 2020 & 2033
- Table 51: Asia Pacific Syngas Industry Revenue billion Forecast, by Technology 2020 & 2033
- Table 52: Asia Pacific Syngas Industry Volume Million Forecast, by Technology 2020 & 2033
- Table 53: Asia Pacific Syngas Industry Revenue billion Forecast, by Gasifier Type 2020 & 2033
- Table 54: Asia Pacific Syngas Industry Volume Million Forecast, by Gasifier Type 2020 & 2033
- Table 55: Asia Pacific Syngas Industry Revenue billion Forecast, by Application 2020 & 2033
- Table 56: Asia Pacific Syngas Industry Volume Million Forecast, by Application 2020 & 2033
- Table 57: Asia Pacific Syngas Industry Revenue billion Forecast, by Geography 2020 & 2033
- Table 58: Asia Pacific Syngas Industry Volume Million Forecast, by Geography 2020 & 2033
- Table 59: Asia Pacific Syngas Industry Revenue billion Forecast, by Country 2020 & 2033
- Table 60: Asia Pacific Syngas Industry Volume Million Forecast, by Country 2020 & 2033
- Table 61: Asia Pacific Syngas Industry Revenue billion Forecast, by Feedstock 2020 & 2033
- Table 62: Asia Pacific Syngas Industry Volume Million Forecast, by Feedstock 2020 & 2033
- Table 63: Asia Pacific Syngas Industry Revenue billion Forecast, by Technology 2020 & 2033
- Table 64: Asia Pacific Syngas Industry Volume Million Forecast, by Technology 2020 & 2033
- Table 65: Asia Pacific Syngas Industry Revenue billion Forecast, by Gasifier Type 2020 & 2033
- Table 66: Asia Pacific Syngas Industry Volume Million Forecast, by Gasifier Type 2020 & 2033
- Table 67: Asia Pacific Syngas Industry Revenue billion Forecast, by Application 2020 & 2033
- Table 68: Asia Pacific Syngas Industry Volume Million Forecast, by Application 2020 & 2033
- Table 69: Asia Pacific Syngas Industry Revenue billion Forecast, by Geography 2020 & 2033
- Table 70: Asia Pacific Syngas Industry Volume Million Forecast, by Geography 2020 & 2033
- Table 71: Asia Pacific Syngas Industry Revenue billion Forecast, by Country 2020 & 2033
- Table 72: Asia Pacific Syngas Industry Volume Million Forecast, by Country 2020 & 2033
- Table 73: Asia Pacific Syngas Industry Revenue billion Forecast, by Feedstock 2020 & 2033
- Table 74: Asia Pacific Syngas Industry Volume Million Forecast, by Feedstock 2020 & 2033
- Table 75: Asia Pacific Syngas Industry Revenue billion Forecast, by Technology 2020 & 2033
- Table 76: Asia Pacific Syngas Industry Volume Million Forecast, by Technology 2020 & 2033
- Table 77: Asia Pacific Syngas Industry Revenue billion Forecast, by Gasifier Type 2020 & 2033
- Table 78: Asia Pacific Syngas Industry Volume Million Forecast, by Gasifier Type 2020 & 2033
- Table 79: Asia Pacific Syngas Industry Revenue billion Forecast, by Application 2020 & 2033
- Table 80: Asia Pacific Syngas Industry Volume Million Forecast, by Application 2020 & 2033
- Table 81: Asia Pacific Syngas Industry Revenue billion Forecast, by Geography 2020 & 2033
- Table 82: Asia Pacific Syngas Industry Volume Million Forecast, by Geography 2020 & 2033
- Table 83: Asia Pacific Syngas Industry Revenue billion Forecast, by Country 2020 & 2033
- Table 84: Asia Pacific Syngas Industry Volume Million Forecast, by Country 2020 & 2033
Frequently Asked Questions
1. What is the projected Compound Annual Growth Rate (CAGR) of the Asia Pacific Syngas Industry?
The projected CAGR is approximately 6.4%.
2. Which companies are prominent players in the Asia Pacific Syngas Industry?
Key companies in the market include Haldor Topsoe A/S, General Electric, Air Products and Chemicals Inc, Royal Dutch Shell plc, Siemens, KBR Inc, BASF SE, Sasol, DuPont, Linde plc, SynGas Technology LLC, Air Liquide, BP p l c, TechnipFMC plc*List Not Exhaustive.
3. What are the main segments of the Asia Pacific Syngas Industry?
The market segments include Feedstock, Technology, Gasifier Type, Application, Geography.
4. Can you provide details about the market size?
The market size is estimated to be USD 44.39 billion as of 2022.
5. What are some drivers contributing to market growth?
Feedstock Flexibility for Syngas Production; Growing Demand in the Electricity and Chemical Industries; Increasing Hydrogen Demand for Fertilizers.
6. What are the notable trends driving market growth?
Ammonia Application Segment to Dominate the Market.
7. Are there any restraints impacting market growth?
High Capital Investment and Funding; Other Restraints.
8. Can you provide examples of recent developments in the market?
September 2023: BASF SE initiated the construction of its syngas plant at the Verbund site in Zhanjiang, China. Anticipated to become operational in 2025, this facility marks a strategic move by BASF SE to bolster its syngas production capacity in China.
9. What pricing options are available for accessing the report?
Pricing options include single-user, multi-user, and enterprise licenses priced at USD 4750, USD 5250, and USD 8750 respectively.
10. Is the market size provided in terms of value or volume?
The market size is provided in terms of value, measured in billion and volume, measured in Million.
11. Are there any specific market keywords associated with the report?
Yes, the market keyword associated with the report is "Asia Pacific Syngas Industry," which aids in identifying and referencing the specific market segment covered.
12. How do I determine which pricing option suits my needs best?
The pricing options vary based on user requirements and access needs. Individual users may opt for single-user licenses, while businesses requiring broader access may choose multi-user or enterprise licenses for cost-effective access to the report.
13. Are there any additional resources or data provided in the Asia Pacific Syngas Industry report?
While the report offers comprehensive insights, it's advisable to review the specific contents or supplementary materials provided to ascertain if additional resources or data are available.
14. How can I stay updated on further developments or reports in the Asia Pacific Syngas Industry?
To stay informed about further developments, trends, and reports in the Asia Pacific Syngas Industry, consider subscribing to industry newsletters, following relevant companies and organizations, or regularly checking reputable industry news sources and publications.
Methodology
Step 1 - Identification of Relevant Samples Size from Population Database


Step 2 - Approaches for Defining Global Market Size (Value, Volume* & Price*)

Note*: In applicable scenarios
Step 3 - Data Sources
Primary Research
- Web Analytics
- Survey Reports
- Research Institute
- Latest Research Reports
- Opinion Leaders
Secondary Research
- Annual Reports
- White Paper
- Latest Press Release
- Industry Association
- Paid Database
- Investor Presentations

Step 4 - Data Triangulation
Involves using different sources of information in order to increase the validity of a study
These sources are likely to be stakeholders in a program - participants, other researchers, program staff, other community members, and so on.
Then we put all data in single framework & apply various statistical tools to find out the dynamic on the market.
During the analysis stage, feedback from the stakeholder groups would be compared to determine areas of agreement as well as areas of divergence