

Key Insights
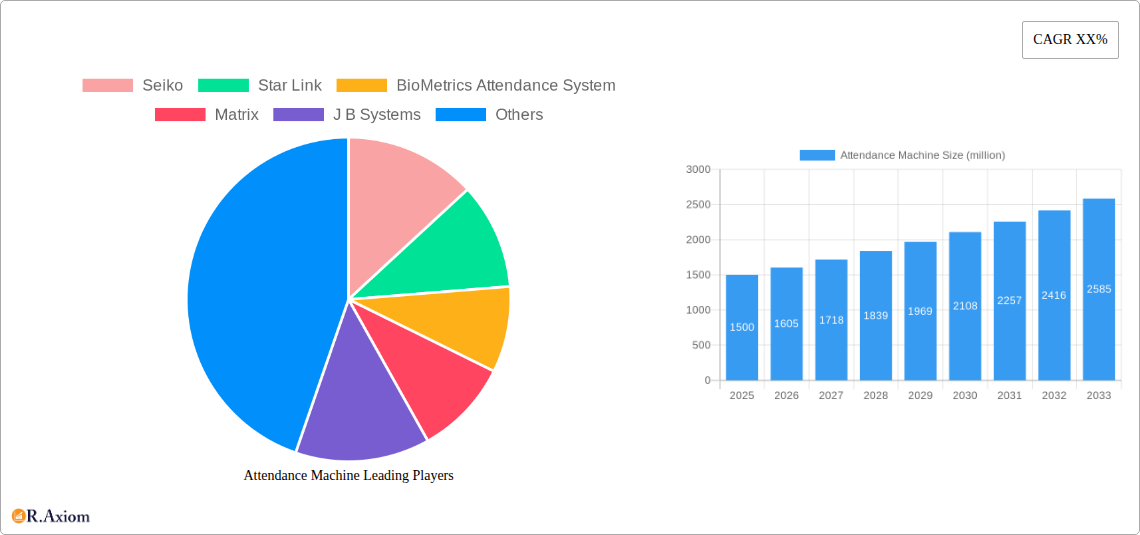
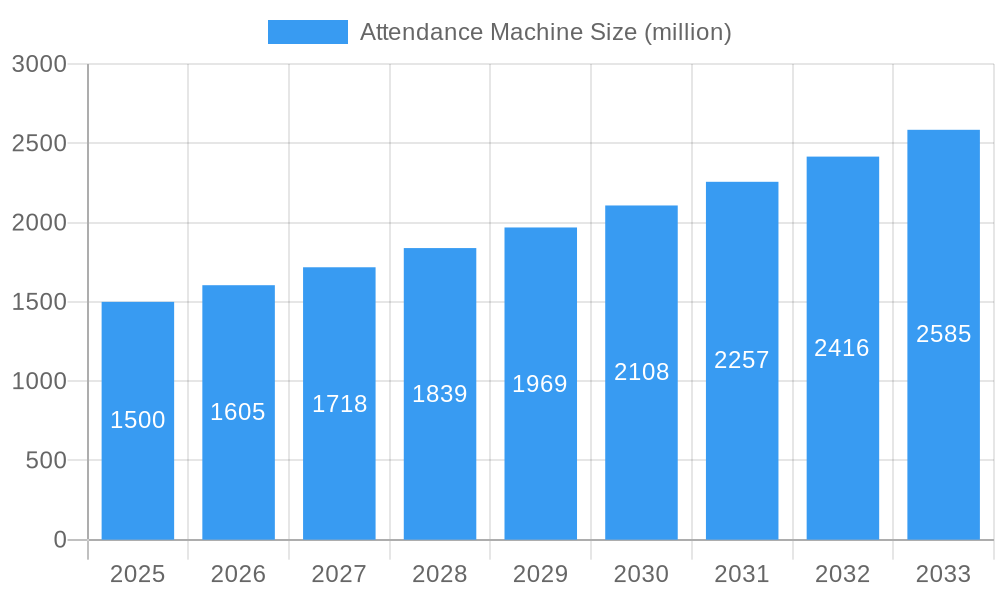
The global attendance machine market is experiencing robust growth, driven by increasing automation in workplaces and the need for efficient time and attendance management. The market, estimated at $1.5 billion in 2025, is projected to exhibit a Compound Annual Growth Rate (CAGR) of 7% from 2025 to 2033, reaching approximately $2.5 billion by 2033. This growth is fueled by several key factors, including the rising adoption of biometric attendance systems offering enhanced security and accuracy compared to traditional punch cards or manual methods. Furthermore, the integration of attendance machines with payroll and HR software streamlines processes and improves overall efficiency. The market is segmented by technology (biometric, fingerprint, facial recognition, card-based), deployment type (cloud-based, on-premise), and end-user industry (manufacturing, healthcare, education, retail). Companies such as Seiko, Star Link, BioMetrics Attendance System, Matrix, J B Systems, Chiptronics Solutions, HuiFan Technology, Deli, and Junrong are key players, constantly innovating to meet evolving market demands. The increasing adoption of cloud-based solutions, offering scalability and remote management capabilities, is a significant trend shaping the market. However, factors such as high initial investment costs for advanced systems and concerns regarding data security present challenges to market growth.
Attendance Machine Market Size (In Billion)
The competitive landscape is characterized by both established players and emerging technology providers. Major players are focusing on strategic partnerships, mergers and acquisitions, and product innovation to gain a competitive edge. The market is witnessing a shift towards more sophisticated solutions that integrate advanced analytics and reporting capabilities, providing businesses with valuable insights into workforce productivity and attendance patterns. Government regulations promoting workplace efficiency and accountability are also stimulating demand. The regional distribution of the market likely reflects the concentration of industries and the level of technological adoption across different geographical areas. North America and Europe are anticipated to hold a significant share, followed by Asia-Pacific, driven by rapid industrialization and urbanization in developing economies. However, growth opportunities exist across all regions as businesses increasingly prioritize efficient workforce management.
Attendance Machine Company Market Share
Attendance Machine Market Report: 2019-2033
This comprehensive report provides an in-depth analysis of the global Attendance Machine market, offering valuable insights for industry stakeholders, investors, and strategic decision-makers. The report covers the period 2019-2033, with a focus on the forecast period 2025-2033 and a base year of 2025. The market is valued at approximately $XX million in 2025 and is projected to reach $XX million by 2033, exhibiting a CAGR of XX%.
Attendance Machine Market Concentration & Innovation
The global Attendance Machine market exhibits a moderately concentrated landscape, with key players like Seiko, Star Link, BioMetrics Attendance System, Matrix, J B Systems, Chiptronics Solutions, HuiFan Technology, Deli, and Junrong holding significant market share. However, the market is also witnessing the emergence of smaller, innovative companies, particularly in niche segments. The market share of the top 5 players in 2025 is estimated at approximately XX%. Innovation is a key driver, with ongoing advancements in biometric technologies (fingerprint, facial recognition, iris scanning), cloud-based solutions, and integration with other HR and payroll systems. Regulatory frameworks, particularly concerning data privacy and security, are influencing market dynamics. Product substitutes, such as manual attendance tracking methods, are gradually becoming obsolete due to the increasing efficiency and accuracy of automated systems. End-user trends favor user-friendly interfaces, mobile accessibility, and robust data analytics capabilities. Mergers and acquisitions (M&A) activity has been moderate in recent years, with deal values totaling approximately $XX million between 2019 and 2024. Future M&A activity is expected to focus on consolidation and expansion into new geographic markets.
- Market Concentration: Top 5 players hold approximately XX% market share in 2025.
- Innovation Drivers: Biometric technology advancements, cloud integration, data analytics.
- Regulatory Impacts: Data privacy regulations influence product development and adoption.
- M&A Activity (2019-2024): Total deal value approximately $XX million.
Attendance Machine Industry Trends & Insights
The Attendance Machine market is experiencing robust growth, driven by several factors. The increasing adoption of automated systems in various industries to enhance operational efficiency and reduce manual errors is a major driver. Technological advancements, particularly in biometric technologies, are fueling market expansion, with facial recognition and fingerprint scanning gaining widespread acceptance. Consumer preferences are shifting towards user-friendly interfaces and mobile-accessible solutions, creating opportunities for companies that can deliver intuitive and flexible products. The competitive landscape is characterized by both established players and new entrants, leading to continuous innovation and price competition. Market penetration is steadily increasing across diverse industries, with significant growth expected in sectors such as education, healthcare, and manufacturing. The global market is projected to experience a compounded annual growth rate (CAGR) of XX% during the forecast period.
Dominant Markets & Segments in Attendance Machine
The Asia-Pacific region holds the largest share of the global Attendance Machine market, driven by factors like rapid economic growth, increasing urbanization, and significant investments in infrastructure development. Within the region, countries like China and India represent key markets.
- Key Drivers in Asia-Pacific:
- Rapid economic growth and urbanization.
- Growing adoption of advanced technologies.
- Favorable government policies supporting automation.
- Increasing investment in infrastructure development.
- Dominance Analysis: The region's large and rapidly growing workforce, coupled with increasing demand for efficient workforce management solutions, drives significant demand for attendance machines. The cost-effectiveness of these systems compared to manual attendance methods also contributes to their popularity.
Attendance Machine Product Developments
Recent product developments focus on integrating advanced biometric technologies, such as multi-modal authentication (combining fingerprint and facial recognition), improved accuracy and speed, enhanced security features, and seamless cloud connectivity for real-time data access and reporting. These innovations aim to cater to evolving user needs and industry requirements for secure and efficient workforce management.
Report Scope & Segmentation Analysis
The report segments the Attendance Machine market by technology (biometric, card-based, etc.), deployment type (cloud-based, on-premise), end-user (manufacturing, education, etc.), and geography. Each segment's growth projection, market size, and competitive dynamics are thoroughly analyzed. For example, the biometric segment is experiencing rapid growth driven by its enhanced security and accuracy.
Key Drivers of Attendance Machine Growth
Several factors drive the growth of the Attendance Machine market, including increasing automation across industries, rising labor costs prompting the need for efficient workforce management, stringent regulatory compliance mandates, and technological advancements leading to more accurate, secure, and user-friendly solutions. Governments in many countries are also pushing for digital transformation in various sectors, further boosting the adoption of Attendance Machines.
Challenges in the Attendance Machine Sector
Challenges faced by the Attendance Machine market include high initial investment costs, concerns related to data privacy and security, the need for robust cybersecurity measures, competition from low-cost providers, and integration complexities with existing HR and payroll systems. These factors can hinder market growth, especially in smaller businesses with limited budgets.
Emerging Opportunities in Attendance Machine
Emerging opportunities include the integration of AI and machine learning capabilities for enhanced data analytics, the adoption of advanced biometric technologies such as iris scanning and vein recognition, expansion into new geographic markets, particularly in developing economies, and the development of customized solutions for specific industry needs. The increasing use of mobile applications for attendance tracking also presents significant growth opportunities.
Leading Players in the Attendance Machine Market
- Seiko
- Star Link
- BioMetrics Attendance System
- Matrix
- J B Systems
- Chiptronics Solutions
- HuiFan Technology
- Deli
- Junrong
Key Developments in Attendance Machine Industry
- 2022 Q4: Seiko launched a new facial recognition attendance machine with advanced security features.
- 2023 Q1: BioMetrics Attendance System acquired a smaller competitor, expanding its market share.
- 2023 Q3: Matrix introduced a cloud-based attendance system with improved data analytics capabilities. (Further specific dates and details would need to be researched and added here).
Strategic Outlook for Attendance Machine Market
The Attendance Machine market is poised for sustained growth, driven by ongoing technological advancements, increasing automation across sectors, and a growing emphasis on efficient workforce management. The market offers attractive opportunities for businesses that can offer innovative, user-friendly, and secure attendance solutions tailored to specific industry needs. The focus on data security and privacy will continue to play a major role in shaping the future of the market.
Attendance Machine Segmentation
-
1. Application
- 1.1. Enterprise
- 1.2. State organs
- 1.3. Others
-
2. Types
- 2.1. IC Card Type
- 2.2. Identify Type
- 2.3. Camera Type
- 2.4. Others
Attendance Machine Segmentation By Geography
-
1. North America
- 1.1. United States
- 1.2. Canada
- 1.3. Mexico
-
2. South America
- 2.1. Brazil
- 2.2. Argentina
- 2.3. Rest of South America
-
3. Europe
- 3.1. United Kingdom
- 3.2. Germany
- 3.3. France
- 3.4. Italy
- 3.5. Spain
- 3.6. Russia
- 3.7. Benelux
- 3.8. Nordics
- 3.9. Rest of Europe
-
4. Middle East & Africa
- 4.1. Turkey
- 4.2. Israel
- 4.3. GCC
- 4.4. North Africa
- 4.5. South Africa
- 4.6. Rest of Middle East & Africa
-
5. Asia Pacific
- 5.1. China
- 5.2. India
- 5.3. Japan
- 5.4. South Korea
- 5.5. ASEAN
- 5.6. Oceania
- 5.7. Rest of Asia Pacific

Attendance Machine Regional Market Share
Geographic Coverage of Attendance Machine
Attendance Machine REPORT HIGHLIGHTS
| Aspects | Details |
|---|---|
| Study Period | 2020-2034 |
| Base Year | 2025 |
| Estimated Year | 2026 |
| Forecast Period | 2026-2034 |
| Historical Period | 2020-2025 |
| Growth Rate | CAGR of XX% from 2020-2034 |
| Segmentation |
|
Table of Contents
- 1. Introduction
- 1.1. Research Scope
- 1.2. Market Segmentation
- 1.3. Research Objective
- 1.4. Definitions and Assumptions
- 2. Executive Summary
- 2.1. Market Snapshot
- 3. Market Dynamics
- 3.1. Market Drivers
- 3.2. Market Restrains
- 3.3. Market Trends
- 3.4. Market Opportunities
- 4. Market Factor Analysis
- 4.1. Porters Five Forces
- 4.1.1. Bargaining Power of Suppliers
- 4.1.2. Bargaining Power of Buyers
- 4.1.3. Threat of New Entrants
- 4.1.4. Threat of Substitutes
- 4.1.5. Competitive Rivalry
- 4.2. PESTEL analysis
- 4.3. BCG Analysis
- 4.3.1. Stars (High Growth, High Market Share)
- 4.3.2. Cash Cows (Low Growth, High Market Share)
- 4.3.3. Question Mark (High Growth, Low Market Share)
- 4.3.4. Dogs (Low Growth, Low Market Share)
- 4.4. Ansoff Matrix Analysis
- 4.5. Supply Chain Analysis
- 4.6. Regulatory Landscape
- 4.7. Current Market Potential and Opportunity Assessment (TAM–SAM–SOM Framework)
- 4.8. RAX Analyst Note
- 4.1. Porters Five Forces
- 5. Market Analysis, Insights and Forecast 2021-2033
- 5.1. Market Analysis, Insights and Forecast - by Application
- 5.1.1. Enterprise
- 5.1.2. State organs
- 5.1.3. Others
- 5.2. Market Analysis, Insights and Forecast - by Types
- 5.2.1. IC Card Type
- 5.2.2. Identify Type
- 5.2.3. Camera Type
- 5.2.4. Others
- 5.3. Market Analysis, Insights and Forecast - by Region
- 5.3.1. North America
- 5.3.2. South America
- 5.3.3. Europe
- 5.3.4. Middle East & Africa
- 5.3.5. Asia Pacific
- 5.1. Market Analysis, Insights and Forecast - by Application
- 6. Global Attendance Machine Analysis, Insights and Forecast, 2021-2033
- 6.1. Market Analysis, Insights and Forecast - by Application
- 6.1.1. Enterprise
- 6.1.2. State organs
- 6.1.3. Others
- 6.2. Market Analysis, Insights and Forecast - by Types
- 6.2.1. IC Card Type
- 6.2.2. Identify Type
- 6.2.3. Camera Type
- 6.2.4. Others
- 6.1. Market Analysis, Insights and Forecast - by Application
- 7. North America Attendance Machine Analysis, Insights and Forecast, 2020-2032
- 7.1. Market Analysis, Insights and Forecast - by Application
- 7.1.1. Enterprise
- 7.1.2. State organs
- 7.1.3. Others
- 7.2. Market Analysis, Insights and Forecast - by Types
- 7.2.1. IC Card Type
- 7.2.2. Identify Type
- 7.2.3. Camera Type
- 7.2.4. Others
- 7.1. Market Analysis, Insights and Forecast - by Application
- 8. South America Attendance Machine Analysis, Insights and Forecast, 2020-2032
- 8.1. Market Analysis, Insights and Forecast - by Application
- 8.1.1. Enterprise
- 8.1.2. State organs
- 8.1.3. Others
- 8.2. Market Analysis, Insights and Forecast - by Types
- 8.2.1. IC Card Type
- 8.2.2. Identify Type
- 8.2.3. Camera Type
- 8.2.4. Others
- 8.1. Market Analysis, Insights and Forecast - by Application
- 9. Europe Attendance Machine Analysis, Insights and Forecast, 2020-2032
- 9.1. Market Analysis, Insights and Forecast - by Application
- 9.1.1. Enterprise
- 9.1.2. State organs
- 9.1.3. Others
- 9.2. Market Analysis, Insights and Forecast - by Types
- 9.2.1. IC Card Type
- 9.2.2. Identify Type
- 9.2.3. Camera Type
- 9.2.4. Others
- 9.1. Market Analysis, Insights and Forecast - by Application
- 10. Middle East & Africa Attendance Machine Analysis, Insights and Forecast, 2020-2032
- 10.1. Market Analysis, Insights and Forecast - by Application
- 10.1.1. Enterprise
- 10.1.2. State organs
- 10.1.3. Others
- 10.2. Market Analysis, Insights and Forecast - by Types
- 10.2.1. IC Card Type
- 10.2.2. Identify Type
- 10.2.3. Camera Type
- 10.2.4. Others
- 10.1. Market Analysis, Insights and Forecast - by Application
- 11. Asia Pacific Attendance Machine Analysis, Insights and Forecast, 2020-2032
- 11.1. Market Analysis, Insights and Forecast - by Application
- 11.1.1. Enterprise
- 11.1.2. State organs
- 11.1.3. Others
- 11.2. Market Analysis, Insights and Forecast - by Types
- 11.2.1. IC Card Type
- 11.2.2. Identify Type
- 11.2.3. Camera Type
- 11.2.4. Others
- 11.1. Market Analysis, Insights and Forecast - by Application
- 12. Competitive Analysis
- 12.1. Company Profiles
- 12.1.1 Seiko
- 12.1.1.1. Company Overview
- 12.1.1.2. Products
- 12.1.1.3. Company Financials
- 12.1.1.4. SWOT Analysis
- 12.1.2 Star Link
- 12.1.2.1. Company Overview
- 12.1.2.2. Products
- 12.1.2.3. Company Financials
- 12.1.2.4. SWOT Analysis
- 12.1.3 BioMetrics Attendance System
- 12.1.3.1. Company Overview
- 12.1.3.2. Products
- 12.1.3.3. Company Financials
- 12.1.3.4. SWOT Analysis
- 12.1.4 Matrix
- 12.1.4.1. Company Overview
- 12.1.4.2. Products
- 12.1.4.3. Company Financials
- 12.1.4.4. SWOT Analysis
- 12.1.5 J B Systems
- 12.1.5.1. Company Overview
- 12.1.5.2. Products
- 12.1.5.3. Company Financials
- 12.1.5.4. SWOT Analysis
- 12.1.6 Chiptronics Solutions
- 12.1.6.1. Company Overview
- 12.1.6.2. Products
- 12.1.6.3. Company Financials
- 12.1.6.4. SWOT Analysis
- 12.1.7 HuiFan Technology
- 12.1.7.1. Company Overview
- 12.1.7.2. Products
- 12.1.7.3. Company Financials
- 12.1.7.4. SWOT Analysis
- 12.1.8 Deli
- 12.1.8.1. Company Overview
- 12.1.8.2. Products
- 12.1.8.3. Company Financials
- 12.1.8.4. SWOT Analysis
- 12.1.9 Junrong
- 12.1.9.1. Company Overview
- 12.1.9.2. Products
- 12.1.9.3. Company Financials
- 12.1.9.4. SWOT Analysis
- 12.1.1 Seiko
- 12.2. Market Entropy
- 12.2.1 Company's Key Areas Served
- 12.2.2 Recent Developments
- 12.3. Company Market Share Analysis 2025
- 12.3.1 Top 5 Companies Market Share Analysis
- 12.3.2 Top 3 Companies Market Share Analysis
- 12.4. List of Potential Customers
- 13. Research Methodology
List of Figures
- Figure 1: Global Attendance Machine Revenue Breakdown (million, %) by Region 2025 & 2033
- Figure 2: Global Attendance Machine Volume Breakdown (K, %) by Region 2025 & 2033
- Figure 3: North America Attendance Machine Revenue (million), by Application 2025 & 2033
- Figure 4: North America Attendance Machine Volume (K), by Application 2025 & 2033
- Figure 5: North America Attendance Machine Revenue Share (%), by Application 2025 & 2033
- Figure 6: North America Attendance Machine Volume Share (%), by Application 2025 & 2033
- Figure 7: North America Attendance Machine Revenue (million), by Types 2025 & 2033
- Figure 8: North America Attendance Machine Volume (K), by Types 2025 & 2033
- Figure 9: North America Attendance Machine Revenue Share (%), by Types 2025 & 2033
- Figure 10: North America Attendance Machine Volume Share (%), by Types 2025 & 2033
- Figure 11: North America Attendance Machine Revenue (million), by Country 2025 & 2033
- Figure 12: North America Attendance Machine Volume (K), by Country 2025 & 2033
- Figure 13: North America Attendance Machine Revenue Share (%), by Country 2025 & 2033
- Figure 14: North America Attendance Machine Volume Share (%), by Country 2025 & 2033
- Figure 15: South America Attendance Machine Revenue (million), by Application 2025 & 2033
- Figure 16: South America Attendance Machine Volume (K), by Application 2025 & 2033
- Figure 17: South America Attendance Machine Revenue Share (%), by Application 2025 & 2033
- Figure 18: South America Attendance Machine Volume Share (%), by Application 2025 & 2033
- Figure 19: South America Attendance Machine Revenue (million), by Types 2025 & 2033
- Figure 20: South America Attendance Machine Volume (K), by Types 2025 & 2033
- Figure 21: South America Attendance Machine Revenue Share (%), by Types 2025 & 2033
- Figure 22: South America Attendance Machine Volume Share (%), by Types 2025 & 2033
- Figure 23: South America Attendance Machine Revenue (million), by Country 2025 & 2033
- Figure 24: South America Attendance Machine Volume (K), by Country 2025 & 2033
- Figure 25: South America Attendance Machine Revenue Share (%), by Country 2025 & 2033
- Figure 26: South America Attendance Machine Volume Share (%), by Country 2025 & 2033
- Figure 27: Europe Attendance Machine Revenue (million), by Application 2025 & 2033
- Figure 28: Europe Attendance Machine Volume (K), by Application 2025 & 2033
- Figure 29: Europe Attendance Machine Revenue Share (%), by Application 2025 & 2033
- Figure 30: Europe Attendance Machine Volume Share (%), by Application 2025 & 2033
- Figure 31: Europe Attendance Machine Revenue (million), by Types 2025 & 2033
- Figure 32: Europe Attendance Machine Volume (K), by Types 2025 & 2033
- Figure 33: Europe Attendance Machine Revenue Share (%), by Types 2025 & 2033
- Figure 34: Europe Attendance Machine Volume Share (%), by Types 2025 & 2033
- Figure 35: Europe Attendance Machine Revenue (million), by Country 2025 & 2033
- Figure 36: Europe Attendance Machine Volume (K), by Country 2025 & 2033
- Figure 37: Europe Attendance Machine Revenue Share (%), by Country 2025 & 2033
- Figure 38: Europe Attendance Machine Volume Share (%), by Country 2025 & 2033
- Figure 39: Middle East & Africa Attendance Machine Revenue (million), by Application 2025 & 2033
- Figure 40: Middle East & Africa Attendance Machine Volume (K), by Application 2025 & 2033
- Figure 41: Middle East & Africa Attendance Machine Revenue Share (%), by Application 2025 & 2033
- Figure 42: Middle East & Africa Attendance Machine Volume Share (%), by Application 2025 & 2033
- Figure 43: Middle East & Africa Attendance Machine Revenue (million), by Types 2025 & 2033
- Figure 44: Middle East & Africa Attendance Machine Volume (K), by Types 2025 & 2033
- Figure 45: Middle East & Africa Attendance Machine Revenue Share (%), by Types 2025 & 2033
- Figure 46: Middle East & Africa Attendance Machine Volume Share (%), by Types 2025 & 2033
- Figure 47: Middle East & Africa Attendance Machine Revenue (million), by Country 2025 & 2033
- Figure 48: Middle East & Africa Attendance Machine Volume (K), by Country 2025 & 2033
- Figure 49: Middle East & Africa Attendance Machine Revenue Share (%), by Country 2025 & 2033
- Figure 50: Middle East & Africa Attendance Machine Volume Share (%), by Country 2025 & 2033
- Figure 51: Asia Pacific Attendance Machine Revenue (million), by Application 2025 & 2033
- Figure 52: Asia Pacific Attendance Machine Volume (K), by Application 2025 & 2033
- Figure 53: Asia Pacific Attendance Machine Revenue Share (%), by Application 2025 & 2033
- Figure 54: Asia Pacific Attendance Machine Volume Share (%), by Application 2025 & 2033
- Figure 55: Asia Pacific Attendance Machine Revenue (million), by Types 2025 & 2033
- Figure 56: Asia Pacific Attendance Machine Volume (K), by Types 2025 & 2033
- Figure 57: Asia Pacific Attendance Machine Revenue Share (%), by Types 2025 & 2033
- Figure 58: Asia Pacific Attendance Machine Volume Share (%), by Types 2025 & 2033
- Figure 59: Asia Pacific Attendance Machine Revenue (million), by Country 2025 & 2033
- Figure 60: Asia Pacific Attendance Machine Volume (K), by Country 2025 & 2033
- Figure 61: Asia Pacific Attendance Machine Revenue Share (%), by Country 2025 & 2033
- Figure 62: Asia Pacific Attendance Machine Volume Share (%), by Country 2025 & 2033
List of Tables
- Table 1: Global Attendance Machine Revenue million Forecast, by Application 2020 & 2033
- Table 2: Global Attendance Machine Volume K Forecast, by Application 2020 & 2033
- Table 3: Global Attendance Machine Revenue million Forecast, by Types 2020 & 2033
- Table 4: Global Attendance Machine Volume K Forecast, by Types 2020 & 2033
- Table 5: Global Attendance Machine Revenue million Forecast, by Region 2020 & 2033
- Table 6: Global Attendance Machine Volume K Forecast, by Region 2020 & 2033
- Table 7: Global Attendance Machine Revenue million Forecast, by Application 2020 & 2033
- Table 8: Global Attendance Machine Volume K Forecast, by Application 2020 & 2033
- Table 9: Global Attendance Machine Revenue million Forecast, by Types 2020 & 2033
- Table 10: Global Attendance Machine Volume K Forecast, by Types 2020 & 2033
- Table 11: Global Attendance Machine Revenue million Forecast, by Country 2020 & 2033
- Table 12: Global Attendance Machine Volume K Forecast, by Country 2020 & 2033
- Table 13: United States Attendance Machine Revenue (million) Forecast, by Application 2020 & 2033
- Table 14: United States Attendance Machine Volume (K) Forecast, by Application 2020 & 2033
- Table 15: Canada Attendance Machine Revenue (million) Forecast, by Application 2020 & 2033
- Table 16: Canada Attendance Machine Volume (K) Forecast, by Application 2020 & 2033
- Table 17: Mexico Attendance Machine Revenue (million) Forecast, by Application 2020 & 2033
- Table 18: Mexico Attendance Machine Volume (K) Forecast, by Application 2020 & 2033
- Table 19: Global Attendance Machine Revenue million Forecast, by Application 2020 & 2033
- Table 20: Global Attendance Machine Volume K Forecast, by Application 2020 & 2033
- Table 21: Global Attendance Machine Revenue million Forecast, by Types 2020 & 2033
- Table 22: Global Attendance Machine Volume K Forecast, by Types 2020 & 2033
- Table 23: Global Attendance Machine Revenue million Forecast, by Country 2020 & 2033
- Table 24: Global Attendance Machine Volume K Forecast, by Country 2020 & 2033
- Table 25: Brazil Attendance Machine Revenue (million) Forecast, by Application 2020 & 2033
- Table 26: Brazil Attendance Machine Volume (K) Forecast, by Application 2020 & 2033
- Table 27: Argentina Attendance Machine Revenue (million) Forecast, by Application 2020 & 2033
- Table 28: Argentina Attendance Machine Volume (K) Forecast, by Application 2020 & 2033
- Table 29: Rest of South America Attendance Machine Revenue (million) Forecast, by Application 2020 & 2033
- Table 30: Rest of South America Attendance Machine Volume (K) Forecast, by Application 2020 & 2033
- Table 31: Global Attendance Machine Revenue million Forecast, by Application 2020 & 2033
- Table 32: Global Attendance Machine Volume K Forecast, by Application 2020 & 2033
- Table 33: Global Attendance Machine Revenue million Forecast, by Types 2020 & 2033
- Table 34: Global Attendance Machine Volume K Forecast, by Types 2020 & 2033
- Table 35: Global Attendance Machine Revenue million Forecast, by Country 2020 & 2033
- Table 36: Global Attendance Machine Volume K Forecast, by Country 2020 & 2033
- Table 37: United Kingdom Attendance Machine Revenue (million) Forecast, by Application 2020 & 2033
- Table 38: United Kingdom Attendance Machine Volume (K) Forecast, by Application 2020 & 2033
- Table 39: Germany Attendance Machine Revenue (million) Forecast, by Application 2020 & 2033
- Table 40: Germany Attendance Machine Volume (K) Forecast, by Application 2020 & 2033
- Table 41: France Attendance Machine Revenue (million) Forecast, by Application 2020 & 2033
- Table 42: France Attendance Machine Volume (K) Forecast, by Application 2020 & 2033
- Table 43: Italy Attendance Machine Revenue (million) Forecast, by Application 2020 & 2033
- Table 44: Italy Attendance Machine Volume (K) Forecast, by Application 2020 & 2033
- Table 45: Spain Attendance Machine Revenue (million) Forecast, by Application 2020 & 2033
- Table 46: Spain Attendance Machine Volume (K) Forecast, by Application 2020 & 2033
- Table 47: Russia Attendance Machine Revenue (million) Forecast, by Application 2020 & 2033
- Table 48: Russia Attendance Machine Volume (K) Forecast, by Application 2020 & 2033
- Table 49: Benelux Attendance Machine Revenue (million) Forecast, by Application 2020 & 2033
- Table 50: Benelux Attendance Machine Volume (K) Forecast, by Application 2020 & 2033
- Table 51: Nordics Attendance Machine Revenue (million) Forecast, by Application 2020 & 2033
- Table 52: Nordics Attendance Machine Volume (K) Forecast, by Application 2020 & 2033
- Table 53: Rest of Europe Attendance Machine Revenue (million) Forecast, by Application 2020 & 2033
- Table 54: Rest of Europe Attendance Machine Volume (K) Forecast, by Application 2020 & 2033
- Table 55: Global Attendance Machine Revenue million Forecast, by Application 2020 & 2033
- Table 56: Global Attendance Machine Volume K Forecast, by Application 2020 & 2033
- Table 57: Global Attendance Machine Revenue million Forecast, by Types 2020 & 2033
- Table 58: Global Attendance Machine Volume K Forecast, by Types 2020 & 2033
- Table 59: Global Attendance Machine Revenue million Forecast, by Country 2020 & 2033
- Table 60: Global Attendance Machine Volume K Forecast, by Country 2020 & 2033
- Table 61: Turkey Attendance Machine Revenue (million) Forecast, by Application 2020 & 2033
- Table 62: Turkey Attendance Machine Volume (K) Forecast, by Application 2020 & 2033
- Table 63: Israel Attendance Machine Revenue (million) Forecast, by Application 2020 & 2033
- Table 64: Israel Attendance Machine Volume (K) Forecast, by Application 2020 & 2033
- Table 65: GCC Attendance Machine Revenue (million) Forecast, by Application 2020 & 2033
- Table 66: GCC Attendance Machine Volume (K) Forecast, by Application 2020 & 2033
- Table 67: North Africa Attendance Machine Revenue (million) Forecast, by Application 2020 & 2033
- Table 68: North Africa Attendance Machine Volume (K) Forecast, by Application 2020 & 2033
- Table 69: South Africa Attendance Machine Revenue (million) Forecast, by Application 2020 & 2033
- Table 70: South Africa Attendance Machine Volume (K) Forecast, by Application 2020 & 2033
- Table 71: Rest of Middle East & Africa Attendance Machine Revenue (million) Forecast, by Application 2020 & 2033
- Table 72: Rest of Middle East & Africa Attendance Machine Volume (K) Forecast, by Application 2020 & 2033
- Table 73: Global Attendance Machine Revenue million Forecast, by Application 2020 & 2033
- Table 74: Global Attendance Machine Volume K Forecast, by Application 2020 & 2033
- Table 75: Global Attendance Machine Revenue million Forecast, by Types 2020 & 2033
- Table 76: Global Attendance Machine Volume K Forecast, by Types 2020 & 2033
- Table 77: Global Attendance Machine Revenue million Forecast, by Country 2020 & 2033
- Table 78: Global Attendance Machine Volume K Forecast, by Country 2020 & 2033
- Table 79: China Attendance Machine Revenue (million) Forecast, by Application 2020 & 2033
- Table 80: China Attendance Machine Volume (K) Forecast, by Application 2020 & 2033
- Table 81: India Attendance Machine Revenue (million) Forecast, by Application 2020 & 2033
- Table 82: India Attendance Machine Volume (K) Forecast, by Application 2020 & 2033
- Table 83: Japan Attendance Machine Revenue (million) Forecast, by Application 2020 & 2033
- Table 84: Japan Attendance Machine Volume (K) Forecast, by Application 2020 & 2033
- Table 85: South Korea Attendance Machine Revenue (million) Forecast, by Application 2020 & 2033
- Table 86: South Korea Attendance Machine Volume (K) Forecast, by Application 2020 & 2033
- Table 87: ASEAN Attendance Machine Revenue (million) Forecast, by Application 2020 & 2033
- Table 88: ASEAN Attendance Machine Volume (K) Forecast, by Application 2020 & 2033
- Table 89: Oceania Attendance Machine Revenue (million) Forecast, by Application 2020 & 2033
- Table 90: Oceania Attendance Machine Volume (K) Forecast, by Application 2020 & 2033
- Table 91: Rest of Asia Pacific Attendance Machine Revenue (million) Forecast, by Application 2020 & 2033
- Table 92: Rest of Asia Pacific Attendance Machine Volume (K) Forecast, by Application 2020 & 2033
Frequently Asked Questions
1. What is the projected Compound Annual Growth Rate (CAGR) of the Attendance Machine?
The projected CAGR is approximately XX%.
2. Which companies are prominent players in the Attendance Machine?
Key companies in the market include Seiko, Star Link, BioMetrics Attendance System, Matrix, J B Systems, Chiptronics Solutions, HuiFan Technology, Deli, Junrong.
3. What are the main segments of the Attendance Machine?
The market segments include Application, Types.
4. Can you provide details about the market size?
The market size is estimated to be USD XXX million as of 2022.
5. What are some drivers contributing to market growth?
N/A
6. What are the notable trends driving market growth?
N/A
7. Are there any restraints impacting market growth?
N/A
8. Can you provide examples of recent developments in the market?
N/A
9. What pricing options are available for accessing the report?
Pricing options include single-user, multi-user, and enterprise licenses priced at USD 3350.00, USD 5025.00, and USD 6700.00 respectively.
10. Is the market size provided in terms of value or volume?
The market size is provided in terms of value, measured in million and volume, measured in K.
11. Are there any specific market keywords associated with the report?
Yes, the market keyword associated with the report is "Attendance Machine," which aids in identifying and referencing the specific market segment covered.
12. How do I determine which pricing option suits my needs best?
The pricing options vary based on user requirements and access needs. Individual users may opt for single-user licenses, while businesses requiring broader access may choose multi-user or enterprise licenses for cost-effective access to the report.
13. Are there any additional resources or data provided in the Attendance Machine report?
While the report offers comprehensive insights, it's advisable to review the specific contents or supplementary materials provided to ascertain if additional resources or data are available.
14. How can I stay updated on further developments or reports in the Attendance Machine?
To stay informed about further developments, trends, and reports in the Attendance Machine, consider subscribing to industry newsletters, following relevant companies and organizations, or regularly checking reputable industry news sources and publications.
Methodology
Step 1 - Identification of Relevant Samples Size from Population Database


Step 2 - Approaches for Defining Global Market Size (Value, Volume* & Price*)

Note*: In applicable scenarios
Step 3 - Data Sources
Primary Research
- Web Analytics
- Survey Reports
- Research Institute
- Latest Research Reports
- Opinion Leaders
Secondary Research
- Annual Reports
- White Paper
- Latest Press Release
- Industry Association
- Paid Database
- Investor Presentations

Step 4 - Data Triangulation
Involves using different sources of information in order to increase the validity of a study
These sources are likely to be stakeholders in a program - participants, other researchers, program staff, other community members, and so on.
Then we put all data in single framework & apply various statistical tools to find out the dynamic on the market.
During the analysis stage, feedback from the stakeholder groups would be compared to determine areas of agreement as well as areas of divergence