

Key Insights
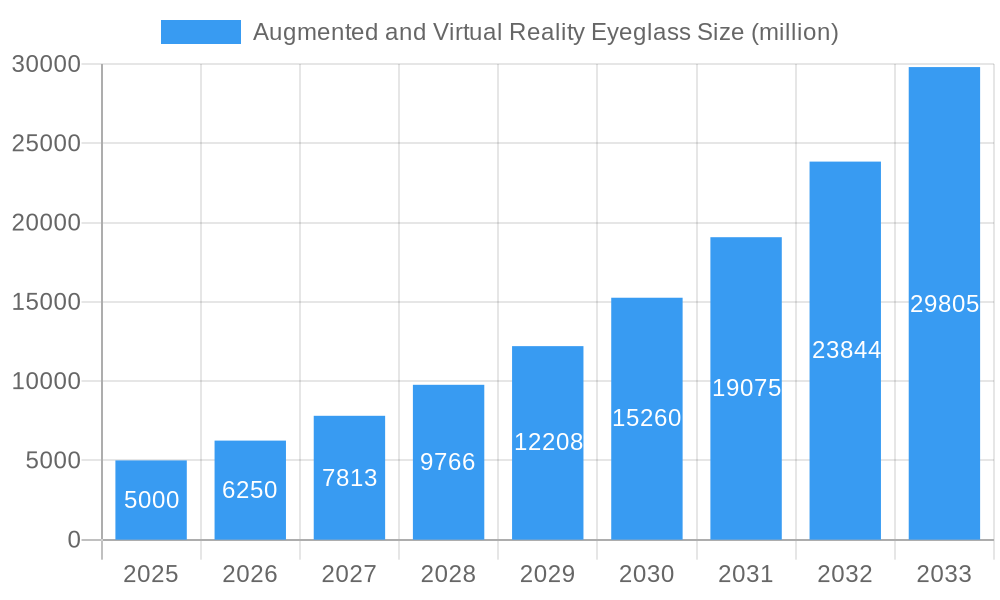
The Augmented and Virtual Reality (AR/VR) eyeglass market is projected for substantial expansion, propelled by innovations in display technology, component miniaturization, and escalating consumer desire for immersive digital interactions. The market, with an estimated size of $15.44 billion in the 2025 base year, is anticipated to grow at a Compound Annual Growth Rate (CAGR) of 8.51% from 2025 to 2033. This significant trajectory is underpinned by several pivotal drivers. Firstly, the integration of AR/VR technology across diverse sectors, including entertainment, healthcare, education, and industrial applications, broadens the market's reach. Secondly, continuous enhancements in display resolution, field of view, and user comfort are increasing the appeal of AR/VR eyewear. Thirdly, declining production costs, driven by technological progress and economies of scale, are enhancing accessibility for a wider demographic. Leading technology firms are actively investing in research and development, stimulating market growth and fostering competition.
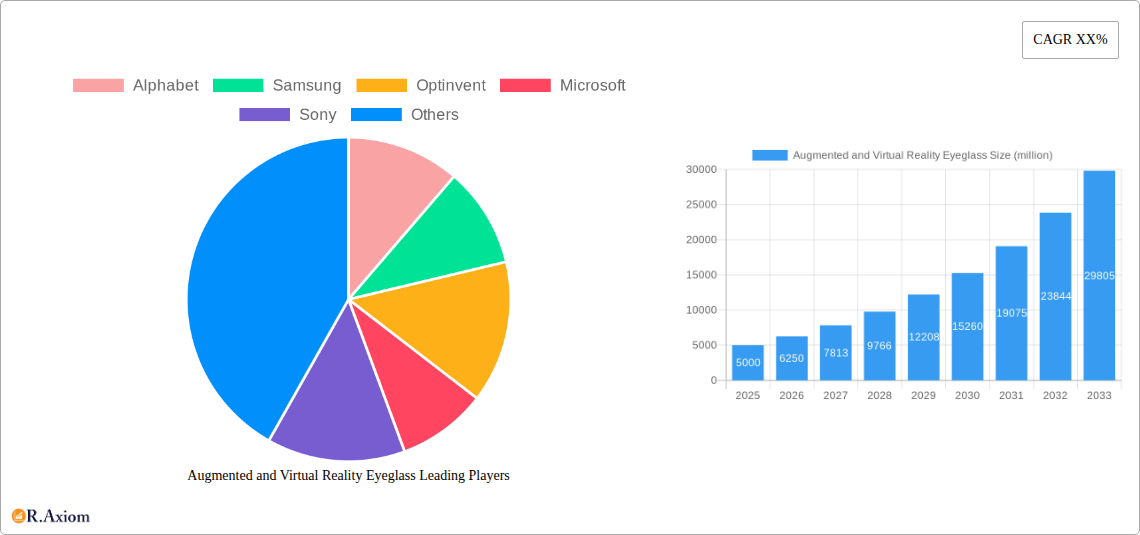
Augmented and Virtual Reality Eyeglass Market Size (In Billion)
Despite this promising outlook, the market faces several hurdles. High initial investment, limited battery longevity, and potential health considerations, such as visual fatigue and motion sickness, could temper growth. Moreover, the establishment of robust content libraries and intuitive applications is vital for widespread adoption. Nevertheless, the long-term prospects for the AR/VR eyeglass market remain robust, with the potential for transformative impact across numerous industries. Market segmentation is expected to diversify, featuring specialized devices for industry-specific demands alongside versatile consumer models. This evolution towards specialization, coupled with ongoing technological advancements, will continue to define the market's future trajectory.
Augmented and Virtual Reality Eyeglass Company Market Share
Augmented and Virtual Reality Eyeglass Market Report: 2019-2033
This comprehensive report provides a detailed analysis of the Augmented and Virtual Reality (AR/VR) Eyeglass market, offering invaluable insights for stakeholders across the value chain. Covering the period from 2019 to 2033, with a focus on 2025, this report unveils market trends, competitive dynamics, and future growth prospects. The report incorporates data on market size (in millions), CAGR, market penetration, and M&A activity, presenting actionable intelligence for strategic decision-making.
Augmented and Virtual Reality Eyeglass Market Concentration & Innovation
The AR/VR eyeglass market is characterized by a dynamic interplay of established tech giants and emerging players. While companies like Alphabet, Samsung, and Microsoft hold significant market share, smaller innovative companies such as Optinvent and others are contributing significantly to product diversification and technological advancements. Market concentration is moderate, with the top five players commanding approximately xx% of the market share in 2025. Innovation is driven by advancements in display technology, miniaturization of components, improved battery life, and the development of sophisticated software applications. Regulatory frameworks, particularly concerning data privacy and safety, are constantly evolving and impacting market development. The market also sees continuous innovation in areas like eye-tracking, gesture recognition, and haptic feedback. Significant M&A activity, with total deal values exceeding $xx million in 2024, further shapes the competitive landscape. Key acquisitions are driving consolidation and expansion into new market segments. Substitutes include traditional eyewear with integrated functionalities, but the unique immersive experiences of AR/VR glasses are maintaining their competitive edge. End-user trends show increasing demand for lightweight, comfortable, and aesthetically pleasing designs with seamless integration into daily life.
- Market Share (2025): Top 5 players: xx%
- M&A Deal Value (2024): > $xx million
Augmented and Virtual Reality Eyeglass Industry Trends & Insights
The AR/VR eyeglass market is experiencing robust growth, driven by several factors. Technological advancements, including improved processing power, enhanced display resolutions, and lighter weight designs, are significantly boosting market appeal. Consumer preferences are shifting towards seamless integration of AR/VR technology into their daily routines, fueling demand for diverse applications ranging from gaming and entertainment to healthcare and education. The market is also witnessing increased consumer acceptance as the technology becomes more affordable and accessible. Competitive dynamics are intense, with companies continuously striving to differentiate their offerings through innovative features and superior user experiences. The Compound Annual Growth Rate (CAGR) for the forecast period (2025-2033) is estimated to be xx%, with market penetration expected to reach xx% by 2033. This signifies a substantial increase from the xx% penetration observed in 2024. However, challenges remain in terms of addressing consumer concerns about privacy, battery life, and potential health risks associated with prolonged use.
Dominant Markets & Segments in Augmented and Virtual Reality Eyeglass
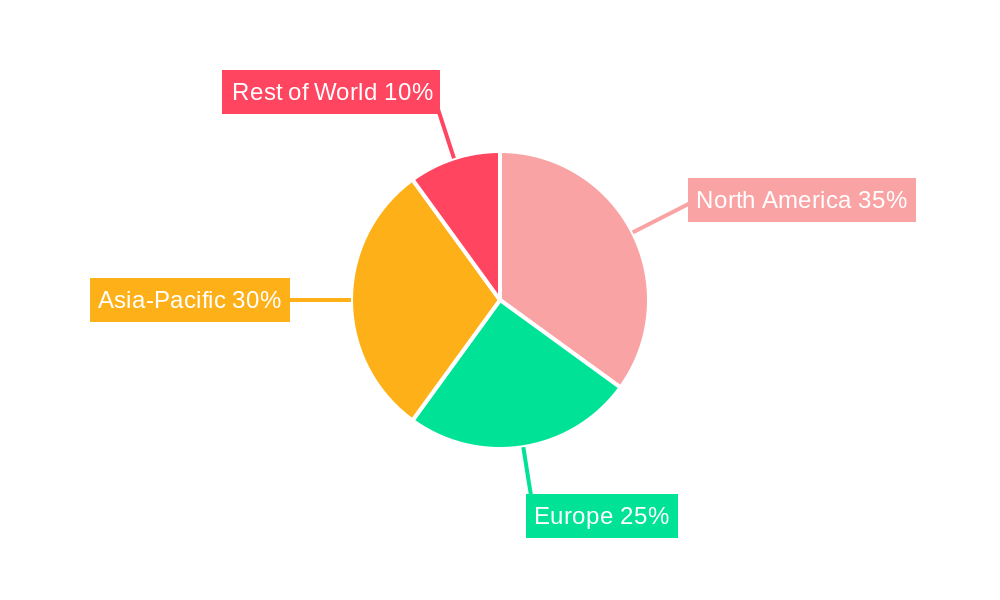
The North American market currently holds the leading position in the AR/VR eyeglass market, driven by factors such as strong technological innovation, high consumer adoption rates, and favorable regulatory environments. Significant economic investments in R&D and a well-established infrastructure further enhance the region's dominance.
- Key Drivers in North America:
- Strong technological innovation and early adoption of new technologies.
- High disposable income and consumer willingness to spend on premium electronics.
- Robust regulatory framework promoting technological advancements.
- Well-established infrastructure and strong supply chain networks.
- Significant investments in R&D and government support.
The dominance of North America is expected to continue throughout the forecast period, although other regions, such as Asia-Pacific, will experience considerable growth due to increasing consumer demand and favorable government policies promoting digitalization. Europe is also expected to show significant growth due to increasing technological advancements and government support.
Augmented and Virtual Reality Eyeglass Product Developments
Recent product developments are focused on enhancing user comfort, improving display quality, and expanding application capabilities. Lightweight designs, improved field of view, and advanced eye-tracking technologies are key innovations driving market growth. Integration with smartphones and other smart devices enables seamless access to information and services. The market is witnessing a shift toward more versatile devices catering to both consumer and enterprise applications.
Report Scope & Segmentation Analysis
This report segments the AR/VR eyeglass market based on several parameters, including product type (AR glasses, VR glasses, hybrid), application (gaming, entertainment, healthcare, industrial, education), technology (optical see-through, video see-through), and geography (North America, Europe, Asia-Pacific, and Rest of the World). Each segment’s growth trajectory and competitive landscape are thoroughly analyzed. Market size projections and growth rates are provided for each segment, accounting for variations in regional adoption and technological trends. The competitive landscape differs across segments, with some dominated by a few major players, while others exhibit more fragmented competition.
Key Drivers of Augmented and Virtual Reality Eyeglass Growth
Several factors are driving the growth of the AR/VR eyeglass market. These include advancements in display technology leading to improved resolution and clarity, miniaturization of components enabling more compact and comfortable designs, and the development of advanced software applications creating immersive and engaging experiences. Furthermore, the increasing adoption of 5G networks is providing the necessary bandwidth for high-quality AR/VR experiences. Favorable government policies and incentives promoting technological innovation in various sectors also contribute significantly to market expansion. The growing demand for AR/VR solutions in various industries, such as healthcare, education, and manufacturing, is also fueling market growth.
Challenges in the Augmented and Virtual Reality Eyeglass Sector
The AR/VR eyeglass sector faces several challenges. High manufacturing costs limit the accessibility of the technology to a wider consumer base. Concerns about potential health risks associated with prolonged use, such as eye strain and motion sickness, represent significant barriers. Supply chain disruptions and the availability of critical components, especially specialized microprocessors and displays, also pose considerable challenges. Stringent regulatory requirements regarding data privacy and security add further complexity. These factors together limit market expansion and increase the cost of production.
Emerging Opportunities in Augmented and Virtual Reality Eyeglass
Emerging opportunities in the AR/VR eyeglass market include the expansion into new applications, such as remote collaboration, augmented reality for retail, and personalized healthcare solutions. The development of innovative materials and manufacturing processes for more durable and sustainable devices holds significant potential. Growing consumer demand for improved comfort and aesthetics creates opportunities for enhanced design and ergonomics. The integration of advanced features like artificial intelligence and machine learning presents further opportunities to personalize user experiences and develop sophisticated applications.
Leading Players in the Augmented and Virtual Reality Eyeglass Market
- Alphabet
- Samsung
- Optinvent
- Microsoft
- Sony
- Epson
- HP
- Toshiba
- Facebook (Meta)
- HTC
Key Developments in Augmented and Virtual Reality Eyeglass Industry
- 2024 Q4: Samsung launched the Galaxy XR, featuring improved battery life and a wider field of view.
- 2023 Q3: Alphabet unveiled new software updates for its AR glasses, enhancing compatibility with various applications.
- 2022 Q2: Microsoft partnered with a major healthcare provider to pilot AR glasses in surgical procedures.
- 2021 Q1: A significant merger between two AR/VR component manufacturers consolidated the supply chain.
Strategic Outlook for Augmented and Virtual Reality Eyeglass Market
The AR/VR eyeglass market exhibits immense growth potential, driven by ongoing technological advancements, increasing consumer demand, and expanding applications across various sectors. The convergence of AR and VR technologies, coupled with the integration of artificial intelligence and machine learning, will drive further innovation and market expansion. The development of lightweight, comfortable, and aesthetically pleasing devices will be crucial in expanding consumer adoption. Addressing consumer concerns regarding health and privacy is crucial for realizing the full market potential. The strategic focus should be on driving innovation, improving affordability, and ensuring a seamless user experience to further accelerate market penetration and solidify its position in the future technology landscape.
Augmented and Virtual Reality Eyeglass Segmentation
-
1. Application
- 1.1. Aerospace & Defense
- 1.2. Tourism
- 1.3. Gaming
- 1.4. Medicine
- 1.5. E-Commerce
- 1.6. Education
- 1.7. Art & Entertainment
- 1.8. Business
- 1.9. Others
-
2. Types
- 2.1. AR
- 2.2. VR
- 2.3. Dual Compatible
Augmented and Virtual Reality Eyeglass Segmentation By Geography
-
1. North America
- 1.1. United States
- 1.2. Canada
- 1.3. Mexico
-
2. South America
- 2.1. Brazil
- 2.2. Argentina
- 2.3. Rest of South America
-
3. Europe
- 3.1. United Kingdom
- 3.2. Germany
- 3.3. France
- 3.4. Italy
- 3.5. Spain
- 3.6. Russia
- 3.7. Benelux
- 3.8. Nordics
- 3.9. Rest of Europe
-
4. Middle East & Africa
- 4.1. Turkey
- 4.2. Israel
- 4.3. GCC
- 4.4. North Africa
- 4.5. South Africa
- 4.6. Rest of Middle East & Africa
-
5. Asia Pacific
- 5.1. China
- 5.2. India
- 5.3. Japan
- 5.4. South Korea
- 5.5. ASEAN
- 5.6. Oceania
- 5.7. Rest of Asia Pacific
Augmented and Virtual Reality Eyeglass Regional Market Share
Geographic Coverage of Augmented and Virtual Reality Eyeglass
Augmented and Virtual Reality Eyeglass REPORT HIGHLIGHTS
| Aspects | Details |
|---|---|
| Study Period | 2020-2034 |
| Base Year | 2025 |
| Estimated Year | 2026 |
| Forecast Period | 2026-2034 |
| Historical Period | 2020-2025 |
| Growth Rate | CAGR of 8.51% from 2020-2034 |
| Segmentation |
|
Table of Contents
- 1. Introduction
- 1.1. Research Scope
- 1.2. Market Segmentation
- 1.3. Research Objective
- 1.4. Definitions and Assumptions
- 2. Executive Summary
- 2.1. Market Snapshot
- 3. Market Dynamics
- 3.1. Market Drivers
- 3.2. Market Restrains
- 3.3. Market Trends
- 3.4. Market Opportunities
- 4. Market Factor Analysis
- 4.1. Porters Five Forces
- 4.1.1. Bargaining Power of Suppliers
- 4.1.2. Bargaining Power of Buyers
- 4.1.3. Threat of New Entrants
- 4.1.4. Threat of Substitutes
- 4.1.5. Competitive Rivalry
- 4.2. PESTEL analysis
- 4.3. BCG Analysis
- 4.3.1. Stars (High Growth, High Market Share)
- 4.3.2. Cash Cows (Low Growth, High Market Share)
- 4.3.3. Question Mark (High Growth, Low Market Share)
- 4.3.4. Dogs (Low Growth, Low Market Share)
- 4.4. Ansoff Matrix Analysis
- 4.5. Supply Chain Analysis
- 4.6. Regulatory Landscape
- 4.7. Current Market Potential and Opportunity Assessment (TAM–SAM–SOM Framework)
- 4.8. RAX Analyst Note
- 4.1. Porters Five Forces
- 5. Market Analysis, Insights and Forecast 2021-2033
- 5.1. Market Analysis, Insights and Forecast - by Application
- 5.1.1. Aerospace & Defense
- 5.1.2. Tourism
- 5.1.3. Gaming
- 5.1.4. Medicine
- 5.1.5. E-Commerce
- 5.1.6. Education
- 5.1.7. Art & Entertainment
- 5.1.8. Business
- 5.1.9. Others
- 5.2. Market Analysis, Insights and Forecast - by Types
- 5.2.1. AR
- 5.2.2. VR
- 5.2.3. Dual Compatible
- 5.3. Market Analysis, Insights and Forecast - by Region
- 5.3.1. North America
- 5.3.2. South America
- 5.3.3. Europe
- 5.3.4. Middle East & Africa
- 5.3.5. Asia Pacific
- 5.1. Market Analysis, Insights and Forecast - by Application
- 6. Global Augmented and Virtual Reality Eyeglass Analysis, Insights and Forecast, 2021-2033
- 6.1. Market Analysis, Insights and Forecast - by Application
- 6.1.1. Aerospace & Defense
- 6.1.2. Tourism
- 6.1.3. Gaming
- 6.1.4. Medicine
- 6.1.5. E-Commerce
- 6.1.6. Education
- 6.1.7. Art & Entertainment
- 6.1.8. Business
- 6.1.9. Others
- 6.2. Market Analysis, Insights and Forecast - by Types
- 6.2.1. AR
- 6.2.2. VR
- 6.2.3. Dual Compatible
- 6.1. Market Analysis, Insights and Forecast - by Application
- 7. North America Augmented and Virtual Reality Eyeglass Analysis, Insights and Forecast, 2020-2032
- 7.1. Market Analysis, Insights and Forecast - by Application
- 7.1.1. Aerospace & Defense
- 7.1.2. Tourism
- 7.1.3. Gaming
- 7.1.4. Medicine
- 7.1.5. E-Commerce
- 7.1.6. Education
- 7.1.7. Art & Entertainment
- 7.1.8. Business
- 7.1.9. Others
- 7.2. Market Analysis, Insights and Forecast - by Types
- 7.2.1. AR
- 7.2.2. VR
- 7.2.3. Dual Compatible
- 7.1. Market Analysis, Insights and Forecast - by Application
- 8. South America Augmented and Virtual Reality Eyeglass Analysis, Insights and Forecast, 2020-2032
- 8.1. Market Analysis, Insights and Forecast - by Application
- 8.1.1. Aerospace & Defense
- 8.1.2. Tourism
- 8.1.3. Gaming
- 8.1.4. Medicine
- 8.1.5. E-Commerce
- 8.1.6. Education
- 8.1.7. Art & Entertainment
- 8.1.8. Business
- 8.1.9. Others
- 8.2. Market Analysis, Insights and Forecast - by Types
- 8.2.1. AR
- 8.2.2. VR
- 8.2.3. Dual Compatible
- 8.1. Market Analysis, Insights and Forecast - by Application
- 9. Europe Augmented and Virtual Reality Eyeglass Analysis, Insights and Forecast, 2020-2032
- 9.1. Market Analysis, Insights and Forecast - by Application
- 9.1.1. Aerospace & Defense
- 9.1.2. Tourism
- 9.1.3. Gaming
- 9.1.4. Medicine
- 9.1.5. E-Commerce
- 9.1.6. Education
- 9.1.7. Art & Entertainment
- 9.1.8. Business
- 9.1.9. Others
- 9.2. Market Analysis, Insights and Forecast - by Types
- 9.2.1. AR
- 9.2.2. VR
- 9.2.3. Dual Compatible
- 9.1. Market Analysis, Insights and Forecast - by Application
- 10. Middle East & Africa Augmented and Virtual Reality Eyeglass Analysis, Insights and Forecast, 2020-2032
- 10.1. Market Analysis, Insights and Forecast - by Application
- 10.1.1. Aerospace & Defense
- 10.1.2. Tourism
- 10.1.3. Gaming
- 10.1.4. Medicine
- 10.1.5. E-Commerce
- 10.1.6. Education
- 10.1.7. Art & Entertainment
- 10.1.8. Business
- 10.1.9. Others
- 10.2. Market Analysis, Insights and Forecast - by Types
- 10.2.1. AR
- 10.2.2. VR
- 10.2.3. Dual Compatible
- 10.1. Market Analysis, Insights and Forecast - by Application
- 11. Asia Pacific Augmented and Virtual Reality Eyeglass Analysis, Insights and Forecast, 2020-2032
- 11.1. Market Analysis, Insights and Forecast - by Application
- 11.1.1. Aerospace & Defense
- 11.1.2. Tourism
- 11.1.3. Gaming
- 11.1.4. Medicine
- 11.1.5. E-Commerce
- 11.1.6. Education
- 11.1.7. Art & Entertainment
- 11.1.8. Business
- 11.1.9. Others
- 11.2. Market Analysis, Insights and Forecast - by Types
- 11.2.1. AR
- 11.2.2. VR
- 11.2.3. Dual Compatible
- 11.1. Market Analysis, Insights and Forecast - by Application
- 12. Competitive Analysis
- 12.1. Company Profiles
- 12.1.1 Alphabet
- 12.1.1.1. Company Overview
- 12.1.1.2. Products
- 12.1.1.3. Company Financials
- 12.1.1.4. SWOT Analysis
- 12.1.2 Samsung
- 12.1.2.1. Company Overview
- 12.1.2.2. Products
- 12.1.2.3. Company Financials
- 12.1.2.4. SWOT Analysis
- 12.1.3 Optinvent
- 12.1.3.1. Company Overview
- 12.1.3.2. Products
- 12.1.3.3. Company Financials
- 12.1.3.4. SWOT Analysis
- 12.1.4 Microsoft
- 12.1.4.1. Company Overview
- 12.1.4.2. Products
- 12.1.4.3. Company Financials
- 12.1.4.4. SWOT Analysis
- 12.1.5 Sony
- 12.1.5.1. Company Overview
- 12.1.5.2. Products
- 12.1.5.3. Company Financials
- 12.1.5.4. SWOT Analysis
- 12.1.6 Epson
- 12.1.6.1. Company Overview
- 12.1.6.2. Products
- 12.1.6.3. Company Financials
- 12.1.6.4. SWOT Analysis
- 12.1.7 HP
- 12.1.7.1. Company Overview
- 12.1.7.2. Products
- 12.1.7.3. Company Financials
- 12.1.7.4. SWOT Analysis
- 12.1.8 Toshiba
- 12.1.8.1. Company Overview
- 12.1.8.2. Products
- 12.1.8.3. Company Financials
- 12.1.8.4. SWOT Analysis
- 12.1.9 Facebook
- 12.1.9.1. Company Overview
- 12.1.9.2. Products
- 12.1.9.3. Company Financials
- 12.1.9.4. SWOT Analysis
- 12.1.10 HTC
- 12.1.10.1. Company Overview
- 12.1.10.2. Products
- 12.1.10.3. Company Financials
- 12.1.10.4. SWOT Analysis
- 12.1.1 Alphabet
- 12.2. Market Entropy
- 12.2.1 Company's Key Areas Served
- 12.2.2 Recent Developments
- 12.3. Company Market Share Analysis 2025
- 12.3.1 Top 5 Companies Market Share Analysis
- 12.3.2 Top 3 Companies Market Share Analysis
- 12.4. List of Potential Customers
- 13. Research Methodology
List of Figures
- Figure 1: Global Augmented and Virtual Reality Eyeglass Revenue Breakdown (billion, %) by Region 2025 & 2033
- Figure 2: Global Augmented and Virtual Reality Eyeglass Volume Breakdown (K, %) by Region 2025 & 2033
- Figure 3: North America Augmented and Virtual Reality Eyeglass Revenue (billion), by Application 2025 & 2033
- Figure 4: North America Augmented and Virtual Reality Eyeglass Volume (K), by Application 2025 & 2033
- Figure 5: North America Augmented and Virtual Reality Eyeglass Revenue Share (%), by Application 2025 & 2033
- Figure 6: North America Augmented and Virtual Reality Eyeglass Volume Share (%), by Application 2025 & 2033
- Figure 7: North America Augmented and Virtual Reality Eyeglass Revenue (billion), by Types 2025 & 2033
- Figure 8: North America Augmented and Virtual Reality Eyeglass Volume (K), by Types 2025 & 2033
- Figure 9: North America Augmented and Virtual Reality Eyeglass Revenue Share (%), by Types 2025 & 2033
- Figure 10: North America Augmented and Virtual Reality Eyeglass Volume Share (%), by Types 2025 & 2033
- Figure 11: North America Augmented and Virtual Reality Eyeglass Revenue (billion), by Country 2025 & 2033
- Figure 12: North America Augmented and Virtual Reality Eyeglass Volume (K), by Country 2025 & 2033
- Figure 13: North America Augmented and Virtual Reality Eyeglass Revenue Share (%), by Country 2025 & 2033
- Figure 14: North America Augmented and Virtual Reality Eyeglass Volume Share (%), by Country 2025 & 2033
- Figure 15: South America Augmented and Virtual Reality Eyeglass Revenue (billion), by Application 2025 & 2033
- Figure 16: South America Augmented and Virtual Reality Eyeglass Volume (K), by Application 2025 & 2033
- Figure 17: South America Augmented and Virtual Reality Eyeglass Revenue Share (%), by Application 2025 & 2033
- Figure 18: South America Augmented and Virtual Reality Eyeglass Volume Share (%), by Application 2025 & 2033
- Figure 19: South America Augmented and Virtual Reality Eyeglass Revenue (billion), by Types 2025 & 2033
- Figure 20: South America Augmented and Virtual Reality Eyeglass Volume (K), by Types 2025 & 2033
- Figure 21: South America Augmented and Virtual Reality Eyeglass Revenue Share (%), by Types 2025 & 2033
- Figure 22: South America Augmented and Virtual Reality Eyeglass Volume Share (%), by Types 2025 & 2033
- Figure 23: South America Augmented and Virtual Reality Eyeglass Revenue (billion), by Country 2025 & 2033
- Figure 24: South America Augmented and Virtual Reality Eyeglass Volume (K), by Country 2025 & 2033
- Figure 25: South America Augmented and Virtual Reality Eyeglass Revenue Share (%), by Country 2025 & 2033
- Figure 26: South America Augmented and Virtual Reality Eyeglass Volume Share (%), by Country 2025 & 2033
- Figure 27: Europe Augmented and Virtual Reality Eyeglass Revenue (billion), by Application 2025 & 2033
- Figure 28: Europe Augmented and Virtual Reality Eyeglass Volume (K), by Application 2025 & 2033
- Figure 29: Europe Augmented and Virtual Reality Eyeglass Revenue Share (%), by Application 2025 & 2033
- Figure 30: Europe Augmented and Virtual Reality Eyeglass Volume Share (%), by Application 2025 & 2033
- Figure 31: Europe Augmented and Virtual Reality Eyeglass Revenue (billion), by Types 2025 & 2033
- Figure 32: Europe Augmented and Virtual Reality Eyeglass Volume (K), by Types 2025 & 2033
- Figure 33: Europe Augmented and Virtual Reality Eyeglass Revenue Share (%), by Types 2025 & 2033
- Figure 34: Europe Augmented and Virtual Reality Eyeglass Volume Share (%), by Types 2025 & 2033
- Figure 35: Europe Augmented and Virtual Reality Eyeglass Revenue (billion), by Country 2025 & 2033
- Figure 36: Europe Augmented and Virtual Reality Eyeglass Volume (K), by Country 2025 & 2033
- Figure 37: Europe Augmented and Virtual Reality Eyeglass Revenue Share (%), by Country 2025 & 2033
- Figure 38: Europe Augmented and Virtual Reality Eyeglass Volume Share (%), by Country 2025 & 2033
- Figure 39: Middle East & Africa Augmented and Virtual Reality Eyeglass Revenue (billion), by Application 2025 & 2033
- Figure 40: Middle East & Africa Augmented and Virtual Reality Eyeglass Volume (K), by Application 2025 & 2033
- Figure 41: Middle East & Africa Augmented and Virtual Reality Eyeglass Revenue Share (%), by Application 2025 & 2033
- Figure 42: Middle East & Africa Augmented and Virtual Reality Eyeglass Volume Share (%), by Application 2025 & 2033
- Figure 43: Middle East & Africa Augmented and Virtual Reality Eyeglass Revenue (billion), by Types 2025 & 2033
- Figure 44: Middle East & Africa Augmented and Virtual Reality Eyeglass Volume (K), by Types 2025 & 2033
- Figure 45: Middle East & Africa Augmented and Virtual Reality Eyeglass Revenue Share (%), by Types 2025 & 2033
- Figure 46: Middle East & Africa Augmented and Virtual Reality Eyeglass Volume Share (%), by Types 2025 & 2033
- Figure 47: Middle East & Africa Augmented and Virtual Reality Eyeglass Revenue (billion), by Country 2025 & 2033
- Figure 48: Middle East & Africa Augmented and Virtual Reality Eyeglass Volume (K), by Country 2025 & 2033
- Figure 49: Middle East & Africa Augmented and Virtual Reality Eyeglass Revenue Share (%), by Country 2025 & 2033
- Figure 50: Middle East & Africa Augmented and Virtual Reality Eyeglass Volume Share (%), by Country 2025 & 2033
- Figure 51: Asia Pacific Augmented and Virtual Reality Eyeglass Revenue (billion), by Application 2025 & 2033
- Figure 52: Asia Pacific Augmented and Virtual Reality Eyeglass Volume (K), by Application 2025 & 2033
- Figure 53: Asia Pacific Augmented and Virtual Reality Eyeglass Revenue Share (%), by Application 2025 & 2033
- Figure 54: Asia Pacific Augmented and Virtual Reality Eyeglass Volume Share (%), by Application 2025 & 2033
- Figure 55: Asia Pacific Augmented and Virtual Reality Eyeglass Revenue (billion), by Types 2025 & 2033
- Figure 56: Asia Pacific Augmented and Virtual Reality Eyeglass Volume (K), by Types 2025 & 2033
- Figure 57: Asia Pacific Augmented and Virtual Reality Eyeglass Revenue Share (%), by Types 2025 & 2033
- Figure 58: Asia Pacific Augmented and Virtual Reality Eyeglass Volume Share (%), by Types 2025 & 2033
- Figure 59: Asia Pacific Augmented and Virtual Reality Eyeglass Revenue (billion), by Country 2025 & 2033
- Figure 60: Asia Pacific Augmented and Virtual Reality Eyeglass Volume (K), by Country 2025 & 2033
- Figure 61: Asia Pacific Augmented and Virtual Reality Eyeglass Revenue Share (%), by Country 2025 & 2033
- Figure 62: Asia Pacific Augmented and Virtual Reality Eyeglass Volume Share (%), by Country 2025 & 2033
List of Tables
- Table 1: Global Augmented and Virtual Reality Eyeglass Revenue billion Forecast, by Application 2020 & 2033
- Table 2: Global Augmented and Virtual Reality Eyeglass Volume K Forecast, by Application 2020 & 2033
- Table 3: Global Augmented and Virtual Reality Eyeglass Revenue billion Forecast, by Types 2020 & 2033
- Table 4: Global Augmented and Virtual Reality Eyeglass Volume K Forecast, by Types 2020 & 2033
- Table 5: Global Augmented and Virtual Reality Eyeglass Revenue billion Forecast, by Region 2020 & 2033
- Table 6: Global Augmented and Virtual Reality Eyeglass Volume K Forecast, by Region 2020 & 2033
- Table 7: Global Augmented and Virtual Reality Eyeglass Revenue billion Forecast, by Application 2020 & 2033
- Table 8: Global Augmented and Virtual Reality Eyeglass Volume K Forecast, by Application 2020 & 2033
- Table 9: Global Augmented and Virtual Reality Eyeglass Revenue billion Forecast, by Types 2020 & 2033
- Table 10: Global Augmented and Virtual Reality Eyeglass Volume K Forecast, by Types 2020 & 2033
- Table 11: Global Augmented and Virtual Reality Eyeglass Revenue billion Forecast, by Country 2020 & 2033
- Table 12: Global Augmented and Virtual Reality Eyeglass Volume K Forecast, by Country 2020 & 2033
- Table 13: United States Augmented and Virtual Reality Eyeglass Revenue (billion) Forecast, by Application 2020 & 2033
- Table 14: United States Augmented and Virtual Reality Eyeglass Volume (K) Forecast, by Application 2020 & 2033
- Table 15: Canada Augmented and Virtual Reality Eyeglass Revenue (billion) Forecast, by Application 2020 & 2033
- Table 16: Canada Augmented and Virtual Reality Eyeglass Volume (K) Forecast, by Application 2020 & 2033
- Table 17: Mexico Augmented and Virtual Reality Eyeglass Revenue (billion) Forecast, by Application 2020 & 2033
- Table 18: Mexico Augmented and Virtual Reality Eyeglass Volume (K) Forecast, by Application 2020 & 2033
- Table 19: Global Augmented and Virtual Reality Eyeglass Revenue billion Forecast, by Application 2020 & 2033
- Table 20: Global Augmented and Virtual Reality Eyeglass Volume K Forecast, by Application 2020 & 2033
- Table 21: Global Augmented and Virtual Reality Eyeglass Revenue billion Forecast, by Types 2020 & 2033
- Table 22: Global Augmented and Virtual Reality Eyeglass Volume K Forecast, by Types 2020 & 2033
- Table 23: Global Augmented and Virtual Reality Eyeglass Revenue billion Forecast, by Country 2020 & 2033
- Table 24: Global Augmented and Virtual Reality Eyeglass Volume K Forecast, by Country 2020 & 2033
- Table 25: Brazil Augmented and Virtual Reality Eyeglass Revenue (billion) Forecast, by Application 2020 & 2033
- Table 26: Brazil Augmented and Virtual Reality Eyeglass Volume (K) Forecast, by Application 2020 & 2033
- Table 27: Argentina Augmented and Virtual Reality Eyeglass Revenue (billion) Forecast, by Application 2020 & 2033
- Table 28: Argentina Augmented and Virtual Reality Eyeglass Volume (K) Forecast, by Application 2020 & 2033
- Table 29: Rest of South America Augmented and Virtual Reality Eyeglass Revenue (billion) Forecast, by Application 2020 & 2033
- Table 30: Rest of South America Augmented and Virtual Reality Eyeglass Volume (K) Forecast, by Application 2020 & 2033
- Table 31: Global Augmented and Virtual Reality Eyeglass Revenue billion Forecast, by Application 2020 & 2033
- Table 32: Global Augmented and Virtual Reality Eyeglass Volume K Forecast, by Application 2020 & 2033
- Table 33: Global Augmented and Virtual Reality Eyeglass Revenue billion Forecast, by Types 2020 & 2033
- Table 34: Global Augmented and Virtual Reality Eyeglass Volume K Forecast, by Types 2020 & 2033
- Table 35: Global Augmented and Virtual Reality Eyeglass Revenue billion Forecast, by Country 2020 & 2033
- Table 36: Global Augmented and Virtual Reality Eyeglass Volume K Forecast, by Country 2020 & 2033
- Table 37: United Kingdom Augmented and Virtual Reality Eyeglass Revenue (billion) Forecast, by Application 2020 & 2033
- Table 38: United Kingdom Augmented and Virtual Reality Eyeglass Volume (K) Forecast, by Application 2020 & 2033
- Table 39: Germany Augmented and Virtual Reality Eyeglass Revenue (billion) Forecast, by Application 2020 & 2033
- Table 40: Germany Augmented and Virtual Reality Eyeglass Volume (K) Forecast, by Application 2020 & 2033
- Table 41: France Augmented and Virtual Reality Eyeglass Revenue (billion) Forecast, by Application 2020 & 2033
- Table 42: France Augmented and Virtual Reality Eyeglass Volume (K) Forecast, by Application 2020 & 2033
- Table 43: Italy Augmented and Virtual Reality Eyeglass Revenue (billion) Forecast, by Application 2020 & 2033
- Table 44: Italy Augmented and Virtual Reality Eyeglass Volume (K) Forecast, by Application 2020 & 2033
- Table 45: Spain Augmented and Virtual Reality Eyeglass Revenue (billion) Forecast, by Application 2020 & 2033
- Table 46: Spain Augmented and Virtual Reality Eyeglass Volume (K) Forecast, by Application 2020 & 2033
- Table 47: Russia Augmented and Virtual Reality Eyeglass Revenue (billion) Forecast, by Application 2020 & 2033
- Table 48: Russia Augmented and Virtual Reality Eyeglass Volume (K) Forecast, by Application 2020 & 2033
- Table 49: Benelux Augmented and Virtual Reality Eyeglass Revenue (billion) Forecast, by Application 2020 & 2033
- Table 50: Benelux Augmented and Virtual Reality Eyeglass Volume (K) Forecast, by Application 2020 & 2033
- Table 51: Nordics Augmented and Virtual Reality Eyeglass Revenue (billion) Forecast, by Application 2020 & 2033
- Table 52: Nordics Augmented and Virtual Reality Eyeglass Volume (K) Forecast, by Application 2020 & 2033
- Table 53: Rest of Europe Augmented and Virtual Reality Eyeglass Revenue (billion) Forecast, by Application 2020 & 2033
- Table 54: Rest of Europe Augmented and Virtual Reality Eyeglass Volume (K) Forecast, by Application 2020 & 2033
- Table 55: Global Augmented and Virtual Reality Eyeglass Revenue billion Forecast, by Application 2020 & 2033
- Table 56: Global Augmented and Virtual Reality Eyeglass Volume K Forecast, by Application 2020 & 2033
- Table 57: Global Augmented and Virtual Reality Eyeglass Revenue billion Forecast, by Types 2020 & 2033
- Table 58: Global Augmented and Virtual Reality Eyeglass Volume K Forecast, by Types 2020 & 2033
- Table 59: Global Augmented and Virtual Reality Eyeglass Revenue billion Forecast, by Country 2020 & 2033
- Table 60: Global Augmented and Virtual Reality Eyeglass Volume K Forecast, by Country 2020 & 2033
- Table 61: Turkey Augmented and Virtual Reality Eyeglass Revenue (billion) Forecast, by Application 2020 & 2033
- Table 62: Turkey Augmented and Virtual Reality Eyeglass Volume (K) Forecast, by Application 2020 & 2033
- Table 63: Israel Augmented and Virtual Reality Eyeglass Revenue (billion) Forecast, by Application 2020 & 2033
- Table 64: Israel Augmented and Virtual Reality Eyeglass Volume (K) Forecast, by Application 2020 & 2033
- Table 65: GCC Augmented and Virtual Reality Eyeglass Revenue (billion) Forecast, by Application 2020 & 2033
- Table 66: GCC Augmented and Virtual Reality Eyeglass Volume (K) Forecast, by Application 2020 & 2033
- Table 67: North Africa Augmented and Virtual Reality Eyeglass Revenue (billion) Forecast, by Application 2020 & 2033
- Table 68: North Africa Augmented and Virtual Reality Eyeglass Volume (K) Forecast, by Application 2020 & 2033
- Table 69: South Africa Augmented and Virtual Reality Eyeglass Revenue (billion) Forecast, by Application 2020 & 2033
- Table 70: South Africa Augmented and Virtual Reality Eyeglass Volume (K) Forecast, by Application 2020 & 2033
- Table 71: Rest of Middle East & Africa Augmented and Virtual Reality Eyeglass Revenue (billion) Forecast, by Application 2020 & 2033
- Table 72: Rest of Middle East & Africa Augmented and Virtual Reality Eyeglass Volume (K) Forecast, by Application 2020 & 2033
- Table 73: Global Augmented and Virtual Reality Eyeglass Revenue billion Forecast, by Application 2020 & 2033
- Table 74: Global Augmented and Virtual Reality Eyeglass Volume K Forecast, by Application 2020 & 2033
- Table 75: Global Augmented and Virtual Reality Eyeglass Revenue billion Forecast, by Types 2020 & 2033
- Table 76: Global Augmented and Virtual Reality Eyeglass Volume K Forecast, by Types 2020 & 2033
- Table 77: Global Augmented and Virtual Reality Eyeglass Revenue billion Forecast, by Country 2020 & 2033
- Table 78: Global Augmented and Virtual Reality Eyeglass Volume K Forecast, by Country 2020 & 2033
- Table 79: China Augmented and Virtual Reality Eyeglass Revenue (billion) Forecast, by Application 2020 & 2033
- Table 80: China Augmented and Virtual Reality Eyeglass Volume (K) Forecast, by Application 2020 & 2033
- Table 81: India Augmented and Virtual Reality Eyeglass Revenue (billion) Forecast, by Application 2020 & 2033
- Table 82: India Augmented and Virtual Reality Eyeglass Volume (K) Forecast, by Application 2020 & 2033
- Table 83: Japan Augmented and Virtual Reality Eyeglass Revenue (billion) Forecast, by Application 2020 & 2033
- Table 84: Japan Augmented and Virtual Reality Eyeglass Volume (K) Forecast, by Application 2020 & 2033
- Table 85: South Korea Augmented and Virtual Reality Eyeglass Revenue (billion) Forecast, by Application 2020 & 2033
- Table 86: South Korea Augmented and Virtual Reality Eyeglass Volume (K) Forecast, by Application 2020 & 2033
- Table 87: ASEAN Augmented and Virtual Reality Eyeglass Revenue (billion) Forecast, by Application 2020 & 2033
- Table 88: ASEAN Augmented and Virtual Reality Eyeglass Volume (K) Forecast, by Application 2020 & 2033
- Table 89: Oceania Augmented and Virtual Reality Eyeglass Revenue (billion) Forecast, by Application 2020 & 2033
- Table 90: Oceania Augmented and Virtual Reality Eyeglass Volume (K) Forecast, by Application 2020 & 2033
- Table 91: Rest of Asia Pacific Augmented and Virtual Reality Eyeglass Revenue (billion) Forecast, by Application 2020 & 2033
- Table 92: Rest of Asia Pacific Augmented and Virtual Reality Eyeglass Volume (K) Forecast, by Application 2020 & 2033
Frequently Asked Questions
1. What is the projected Compound Annual Growth Rate (CAGR) of the Augmented and Virtual Reality Eyeglass?
The projected CAGR is approximately 8.51%.
2. Which companies are prominent players in the Augmented and Virtual Reality Eyeglass?
Key companies in the market include Alphabet, Samsung, Optinvent, Microsoft, Sony, Epson, HP, Toshiba, Facebook, HTC.
3. What are the main segments of the Augmented and Virtual Reality Eyeglass?
The market segments include Application, Types.
4. Can you provide details about the market size?
The market size is estimated to be USD 15.44 billion as of 2022.
5. What are some drivers contributing to market growth?
N/A
6. What are the notable trends driving market growth?
N/A
7. Are there any restraints impacting market growth?
N/A
8. Can you provide examples of recent developments in the market?
N/A
9. What pricing options are available for accessing the report?
Pricing options include single-user, multi-user, and enterprise licenses priced at USD 3350.00, USD 5025.00, and USD 6700.00 respectively.
10. Is the market size provided in terms of value or volume?
The market size is provided in terms of value, measured in billion and volume, measured in K.
11. Are there any specific market keywords associated with the report?
Yes, the market keyword associated with the report is "Augmented and Virtual Reality Eyeglass," which aids in identifying and referencing the specific market segment covered.
12. How do I determine which pricing option suits my needs best?
The pricing options vary based on user requirements and access needs. Individual users may opt for single-user licenses, while businesses requiring broader access may choose multi-user or enterprise licenses for cost-effective access to the report.
13. Are there any additional resources or data provided in the Augmented and Virtual Reality Eyeglass report?
While the report offers comprehensive insights, it's advisable to review the specific contents or supplementary materials provided to ascertain if additional resources or data are available.
14. How can I stay updated on further developments or reports in the Augmented and Virtual Reality Eyeglass?
To stay informed about further developments, trends, and reports in the Augmented and Virtual Reality Eyeglass, consider subscribing to industry newsletters, following relevant companies and organizations, or regularly checking reputable industry news sources and publications.
Methodology
Step 1 - Identification of Relevant Samples Size from Population Database


Step 2 - Approaches for Defining Global Market Size (Value, Volume* & Price*)

Note*: In applicable scenarios
Step 3 - Data Sources
Primary Research
- Web Analytics
- Survey Reports
- Research Institute
- Latest Research Reports
- Opinion Leaders
Secondary Research
- Annual Reports
- White Paper
- Latest Press Release
- Industry Association
- Paid Database
- Investor Presentations

Step 4 - Data Triangulation
Involves using different sources of information in order to increase the validity of a study
These sources are likely to be stakeholders in a program - participants, other researchers, program staff, other community members, and so on.
Then we put all data in single framework & apply various statistical tools to find out the dynamic on the market.
During the analysis stage, feedback from the stakeholder groups would be compared to determine areas of agreement as well as areas of divergence