

Key Insights
The Australian co-working office space market is experiencing robust growth, driven by a surge in demand from diverse sectors. The market's Compound Annual Growth Rate (CAGR) exceeding 6.50% from 2019-2024 indicates a consistently expanding market. This growth is fueled by several key factors. The increasing preference for flexible work arrangements among startups, SMEs, and even large corporations seeking cost-effective solutions and enhanced employee satisfaction is a major driver. Technological advancements, improved internet connectivity, and a shift towards remote work models further bolster this trend. The diverse range of services offered by co-working spaces, including meeting rooms, event spaces, and networking opportunities, adds significant value, attracting a wider client base. While potential restraints like economic downturns or shifts in broader real estate markets exist, the overall trajectory remains positive, with projections suggesting continued expansion. The market segmentation reveals strong participation from various industries, including IT, legal services, BFSI, and consulting, highlighting its broad appeal. Key cities such as Sydney, Melbourne, and Perth are leading the growth, reflecting the concentration of businesses and professionals in these urban centers. The competitive landscape is dynamic, with established players like WeWork and Spaces alongside numerous local providers fostering innovation and competition.
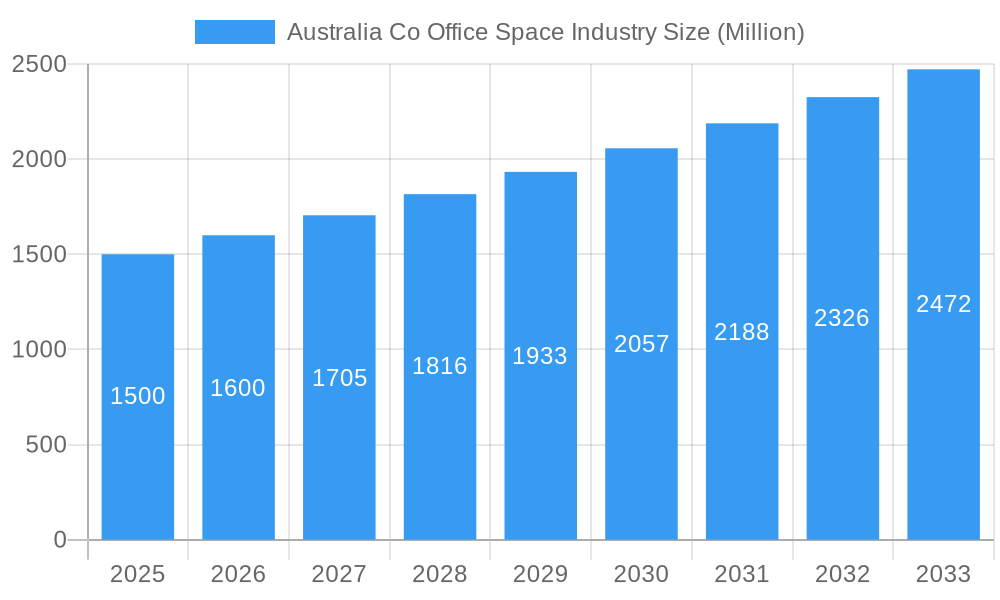
Australia Co Office Space Industry Market Size (In Billion)
The future of the Australian co-working space market presents significant opportunities for growth. Continued investment in infrastructure, expansion into emerging regional markets, and the increasing adoption of technology-driven solutions within co-working spaces promise further expansion. The rising popularity of hybrid work models will likely solidify the demand for flexible workspaces. However, operators need to adapt to changing market conditions, offering increasingly specialized services and spaces catering to diverse needs. Effective marketing and building strong community engagement will be crucial for success in this competitive landscape. Analyzing specific market segments like those focused on personal users versus larger corporations will help providers tailor services and marketing strategies for optimal impact. Continued monitoring of economic indicators will also prove vital in forecasting future market performance and ensuring sustainable growth.
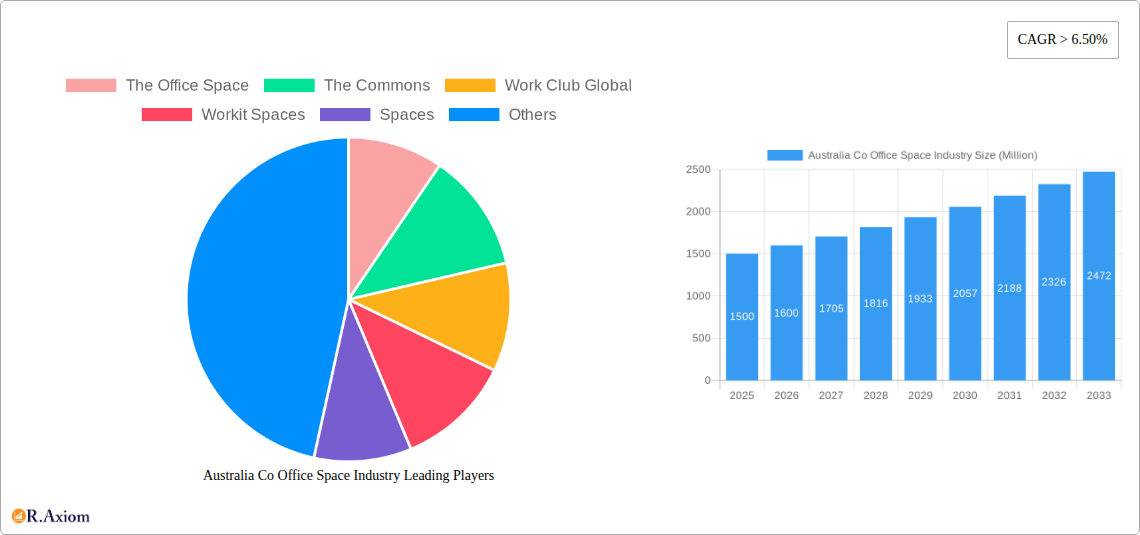
Australia Co Office Space Industry Company Market Share
Australia Co-Office Space Industry: A Comprehensive Market Report (2019-2033)
This in-depth report provides a comprehensive analysis of the Australian co-office space industry, covering market size, segmentation, key players, growth drivers, challenges, and future outlook. The report utilizes data from the historical period (2019-2024), the base year (2025), and projects the market's trajectory through the forecast period (2025-2033). This report is crucial for investors, industry professionals, and businesses seeking to understand and navigate the dynamic Australian co-office space landscape. The total market value in 2025 is estimated at $XX Million.
Australia Co Office Space Industry Market Concentration & Innovation
The Australian co-office space market exhibits a moderately concentrated structure, with several major players and a growing number of smaller operators. Market share data for 2025 suggests that WeWork Management LLC and Spaces hold significant positions, each capturing approximately XX% and XX% respectively. Other key players like Hub Australia, The Office Space, and JustCo contribute to the remaining market share. Innovation in the sector is driven by technological advancements, including smart building technologies, flexible lease agreements, and enhanced online booking systems. Regulatory frameworks, particularly concerning building codes and zoning regulations, impact market development. Product substitutes, such as traditional office rentals and remote work arrangements, exert competitive pressure. End-user trends indicate a rising preference for flexible, collaborative workspaces, fueling market growth. M&A activity has been moderate, with several smaller acquisitions contributing to consolidation within the market. Notable M&A deals in the past five years have totalled approximately $XX Million in value, with the largest deal involving [Insert details of a major M&A deal if available, otherwise replace with 'a significant consolidation within the smaller players segment'].
- Market Concentration: Highly concentrated in major cities.
- Innovation Drivers: Smart building technology, flexible lease options, online booking.
- Regulatory Framework: Building codes, zoning regulations.
- Product Substitutes: Traditional office rentals, remote work.
- M&A Activity: Moderate consolidation, total value approximately $XX Million (2019-2024).
Australia Co Office Space Industry Industry Trends & Insights
The Australian co-office space market has witnessed robust growth during the historical period (2019-2024), with a compound annual growth rate (CAGR) of XX%. This growth is fueled by several factors, including the increasing adoption of flexible work arrangements, the rise of the gig economy, and a growing preference for collaborative work environments. Technological disruptions, such as the integration of smart building technologies and digital platforms, are further enhancing the efficiency and appeal of co-working spaces. Consumer preferences are shifting towards more sustainable and amenity-rich spaces, leading to increased investment in eco-friendly design and wellness-focused facilities. The competitive landscape is characterized by intense rivalry among established players and emerging entrants, driving innovation and improved service offerings. Market penetration for co-office spaces is estimated at XX% in 2025, with significant potential for further expansion.
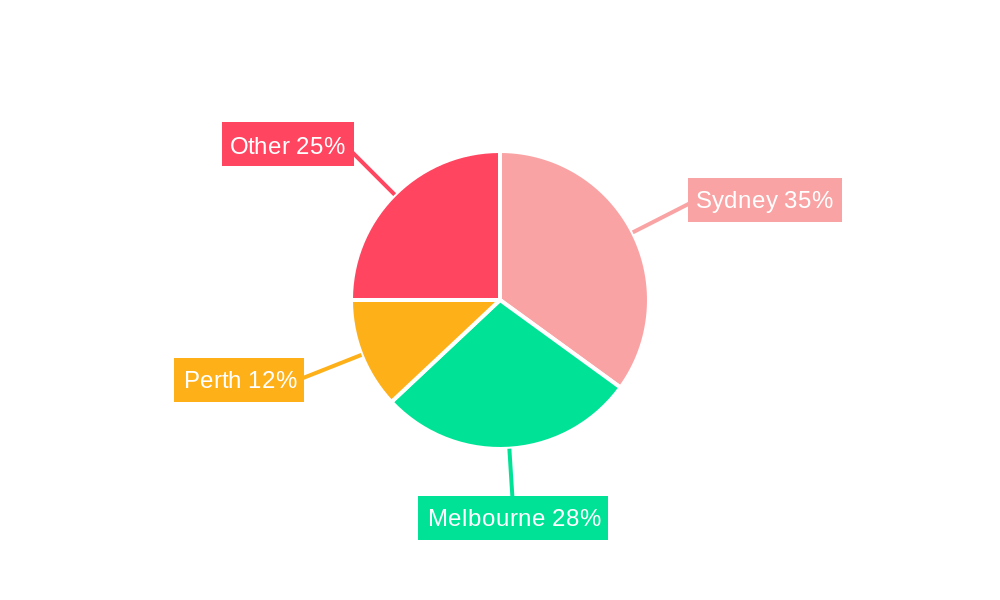
Dominant Markets & Segments in Australia Co Office Space Industry
Sydney, Melbourne, and Perth represent the dominant markets for co-office spaces in Australia, driven by strong economic activity, robust infrastructure, and large concentrations of businesses across various sectors.
By Type:
- Serviced Offices: This segment enjoys the highest market share, fuelled by high demand for fully furnished, ready-to-use spaces.
- Flexible Managed Offices: This segment experiences strong growth, driven by the preference for adaptable spaces and flexible contract terms.
By Application:
- Information Technology (IT and ITES): This sector is a major driver of demand, as tech companies seek collaborative and flexible work environments.
- Consulting and Legal Services: These sectors show high demand for professional and prestigious co-office spaces.
By End User:
- Small-scale Company: This segment comprises a significant portion of the market, seeking cost-effective and flexible solutions.
- Large-scale Company: Demand from larger firms is increasing, with companies using co-working spaces for satellite offices or team expansion.
Key Drivers:
- Strong economic growth in major cities.
- Well-developed infrastructure and transportation networks.
- Supportive government policies promoting innovation and entrepreneurship.
Sydney's dominance is largely attributed to its status as a major financial and technological hub. Melbourne's strong creative industries and vibrant entrepreneurial ecosystem also contribute to its significant market share. Perth, while smaller than Sydney and Melbourne, benefits from its position as a key center for resources and energy businesses.
Australia Co Office Space Industry Product Developments
Recent product developments in the Australian co-office space industry focus on enhancing user experience and integrating technology. This includes the adoption of smart building technologies to improve energy efficiency, security, and environmental sustainability. The introduction of flexible membership options, tailored to the evolving needs of diverse user groups, is further enhancing market competitiveness. Features such as advanced booking systems, virtual office solutions, and high-speed internet connectivity have become standard offerings. These developments cater to the growing demand for seamless, efficient, and flexible work environments.
Report Scope & Segmentation Analysis
This report segments the Australian co-office space market by type (flexible managed offices and serviced offices), application (IT and ITES, legal services, BFSI, consulting, and other services), end-user (personal users, small-scale companies, large-scale companies, and other end-users), and key cities (Sydney, Melbourne, and Perth). Each segment is analyzed in terms of its growth projections, market size, and competitive dynamics. The market size for each segment will be provided within the full report. Growth projections vary depending on the segment, with the IT and ITES application and the small-scale company end-user exhibiting comparatively faster growth rates. Competitive dynamics differ depending on geographic concentration and types of services offered, indicating a mix of both high and low competitive intensity.
Key Drivers of Australia Co Office Space Industry Growth
The growth of the Australian co-office space industry is fueled by several key factors. Firstly, the increasing adoption of flexible work arrangements and remote working policies by businesses of all sizes is driving demand for flexible and easily accessible workspaces. Secondly, the rise of the gig economy and the increasing number of entrepreneurs and freelancers are creating a large pool of potential users. Thirdly, advancements in technology, such as smart building management systems and virtual office solutions, are enhancing the efficiency and appeal of co-working spaces. Finally, supportive government policies promoting entrepreneurship and innovation further contribute to the growth of this sector.
Challenges in the Australia Co Office Space Industry Sector
The Australian co-office space industry faces certain challenges. Competition is intense, with numerous established players and new entrants vying for market share. This leads to price pressures and the need for constant innovation. Securing suitable locations in prime areas, particularly in major cities, can be difficult and expensive. Furthermore, regulatory hurdles, such as building codes and zoning regulations, can impact expansion plans. Supply chain disruptions, particularly in the procurement of furniture and equipment, can also create operational challenges. These factors combine to impact profitability and growth potential.
Emerging Opportunities in Australia Co Office Space Industry
Several emerging opportunities exist within the Australian co-office space industry. The growing demand for sustainable and eco-friendly workspaces presents opportunities for businesses to differentiate themselves. The integration of technology, such as AI-powered workplace management systems, is another avenue for innovation and enhanced service delivery. Expanding into secondary cities and regional areas offers scope for growth beyond major metropolitan centers. Catering to the increasing demand for specialized co-working spaces tailored to specific industries, such as healthcare or education, provides further opportunities for market penetration.
Leading Players in the Australia Co Office Space Industry Market
- The Office Space
- The Commons
- Work Club Global
- Workit Spaces
- Spaces
- Switch
- workspace365 Pty Ltd
- Coworking South Australia
- WeWork Management LLC
- WOTSO Limited
- JustCo
- CreativeCubes Co Pty Ltd
- The Circle
- Hub Australia
(List Not Exhaustive)
Key Developments in Australia Co Office Space Industry Industry
- 2022 Q4: WeWork Management LLC launched a new sustainability initiative across its Australian locations.
- 2023 Q1: Hub Australia expanded its operations into a new city.
- 2023 Q2: Significant investment in flexible office space technology was noted across the sector.
- 2024 Q3: A major merger between two smaller operators was announced. (Further details on specific dates and impacts will be included in the full report)
Strategic Outlook for Australia Co Office Space Industry Market
The Australian co-office space market is poised for continued growth over the forecast period (2025-2033). The increasing adoption of hybrid and remote work models, coupled with technological advancements and evolving consumer preferences, will drive demand for flexible and innovative workspace solutions. The focus on sustainability, wellness, and community building within co-working spaces will further contribute to market expansion. Opportunities exist for both established players and new entrants to capitalize on this growth, particularly through targeted innovation, strategic partnerships, and expansion into underserved markets.
Australia Co Office Space Industry Segmentation
-
1. Type
- 1.1. Flexible Managed Office
- 1.2. Serviced Office
-
2. Application
- 2.1. Information Technology (IT and ITES)
- 2.2. Legal Services
- 2.3. BFSI (Banking, Financial Services, and Insurance)
- 2.4. Consulting
- 2.5. Other Services
-
3. End User
- 3.1. Personal User
- 3.2. Small-scale Company
- 3.3. Large-scale Company
- 3.4. Other End Users
-
4. Key Cities
- 4.1. Sydney
- 4.2. Melbourne
- 4.3. Perth
Australia Co Office Space Industry Segmentation By Geography
- 1. Australia
Australia Co Office Space Industry Regional Market Share
Geographic Coverage of Australia Co Office Space Industry
Australia Co Office Space Industry REPORT HIGHLIGHTS
| Aspects | Details |
|---|---|
| Study Period | 2020-2034 |
| Base Year | 2025 |
| Estimated Year | 2026 |
| Forecast Period | 2026-2034 |
| Historical Period | 2020-2025 |
| Growth Rate | CAGR of 8% from 2020-2034 |
| Segmentation |
|
Table of Contents
- 1. Introduction
- 1.1. Research Scope
- 1.2. Market Segmentation
- 1.3. Research Objective
- 1.4. Definitions and Assumptions
- 2. Executive Summary
- 2.1. Market Snapshot
- 3. Market Dynamics
- 3.1. Market Drivers
- 3.2. Market Restrains
- 3.3. Market Trends
- 3.4. Market Opportunities
- 4. Market Factor Analysis
- 4.1. Porters Five Forces
- 4.1.1. Bargaining Power of Suppliers
- 4.1.2. Bargaining Power of Buyers
- 4.1.3. Threat of New Entrants
- 4.1.4. Threat of Substitutes
- 4.1.5. Competitive Rivalry
- 4.2. PESTEL analysis
- 4.3. BCG Analysis
- 4.3.1. Stars (High Growth, High Market Share)
- 4.3.2. Cash Cows (Low Growth, High Market Share)
- 4.3.3. Question Mark (High Growth, Low Market Share)
- 4.3.4. Dogs (Low Growth, Low Market Share)
- 4.4. Ansoff Matrix Analysis
- 4.5. Supply Chain Analysis
- 4.6. Regulatory Landscape
- 4.7. Current Market Potential and Opportunity Assessment (TAM–SAM–SOM Framework)
- 4.8. RAX Analyst Note
- 4.1. Porters Five Forces
- 5. Market Analysis, Insights and Forecast 2021-2033
- 5.1. Market Analysis, Insights and Forecast - by Type
- 5.1.1. Flexible Managed Office
- 5.1.2. Serviced Office
- 5.2. Market Analysis, Insights and Forecast - by Application
- 5.2.1. Information Technology (IT and ITES)
- 5.2.2. Legal Services
- 5.2.3. BFSI (Banking, Financial Services, and Insurance)
- 5.2.4. Consulting
- 5.2.5. Other Services
- 5.3. Market Analysis, Insights and Forecast - by End User
- 5.3.1. Personal User
- 5.3.2. Small-scale Company
- 5.3.3. Large-scale Company
- 5.3.4. Other End Users
- 5.4. Market Analysis, Insights and Forecast - by Key Cities
- 5.4.1. Sydney
- 5.4.2. Melbourne
- 5.4.3. Perth
- 5.5. Market Analysis, Insights and Forecast - by Region
- 5.5.1. Australia
- 5.1. Market Analysis, Insights and Forecast - by Type
- 6. Australia Co Office Space Industry Analysis, Insights and Forecast, 2021-2033
- 6.1. Market Analysis, Insights and Forecast - by Type
- 6.1.1. Flexible Managed Office
- 6.1.2. Serviced Office
- 6.2. Market Analysis, Insights and Forecast - by Application
- 6.2.1. Information Technology (IT and ITES)
- 6.2.2. Legal Services
- 6.2.3. BFSI (Banking, Financial Services, and Insurance)
- 6.2.4. Consulting
- 6.2.5. Other Services
- 6.3. Market Analysis, Insights and Forecast - by End User
- 6.3.1. Personal User
- 6.3.2. Small-scale Company
- 6.3.3. Large-scale Company
- 6.3.4. Other End Users
- 6.4. Market Analysis, Insights and Forecast - by Key Cities
- 6.4.1. Sydney
- 6.4.2. Melbourne
- 6.4.3. Perth
- 6.1. Market Analysis, Insights and Forecast - by Type
- 7. Competitive Analysis
- 7.1. Company Profiles
- 7.1.1 The Office Space
- 7.1.1.1. Company Overview
- 7.1.1.2. Products
- 7.1.1.3. Company Financials
- 7.1.1.4. SWOT Analysis
- 7.1.2 The Commons
- 7.1.2.1. Company Overview
- 7.1.2.2. Products
- 7.1.2.3. Company Financials
- 7.1.2.4. SWOT Analysis
- 7.1.3 Work Club Global
- 7.1.3.1. Company Overview
- 7.1.3.2. Products
- 7.1.3.3. Company Financials
- 7.1.3.4. SWOT Analysis
- 7.1.4 Workit Spaces
- 7.1.4.1. Company Overview
- 7.1.4.2. Products
- 7.1.4.3. Company Financials
- 7.1.4.4. SWOT Analysis
- 7.1.5 Spaces
- 7.1.5.1. Company Overview
- 7.1.5.2. Products
- 7.1.5.3. Company Financials
- 7.1.5.4. SWOT Analysis
- 7.1.6 Switch
- 7.1.6.1. Company Overview
- 7.1.6.2. Products
- 7.1.6.3. Company Financials
- 7.1.6.4. SWOT Analysis
- 7.1.7 workspace365 Pty Ltd
- 7.1.7.1. Company Overview
- 7.1.7.2. Products
- 7.1.7.3. Company Financials
- 7.1.7.4. SWOT Analysis
- 7.1.8 Coworking South Australia
- 7.1.8.1. Company Overview
- 7.1.8.2. Products
- 7.1.8.3. Company Financials
- 7.1.8.4. SWOT Analysis
- 7.1.9 WeWork Management LLC
- 7.1.9.1. Company Overview
- 7.1.9.2. Products
- 7.1.9.3. Company Financials
- 7.1.9.4. SWOT Analysis
- 7.1.10 WOTSO Limited
- 7.1.10.1. Company Overview
- 7.1.10.2. Products
- 7.1.10.3. Company Financials
- 7.1.10.4. SWOT Analysis
- 7.1.11 JustCo
- 7.1.11.1. Company Overview
- 7.1.11.2. Products
- 7.1.11.3. Company Financials
- 7.1.11.4. SWOT Analysis
- 7.1.12 CreativeCubes Co Pty Ltd**List Not Exhaustive
- 7.1.12.1. Company Overview
- 7.1.12.2. Products
- 7.1.12.3. Company Financials
- 7.1.12.4. SWOT Analysis
- 7.1.13 The Circle
- 7.1.13.1. Company Overview
- 7.1.13.2. Products
- 7.1.13.3. Company Financials
- 7.1.13.4. SWOT Analysis
- 7.1.14 Hub Australia
- 7.1.14.1. Company Overview
- 7.1.14.2. Products
- 7.1.14.3. Company Financials
- 7.1.14.4. SWOT Analysis
- 7.1.1 The Office Space
- 7.2. Market Entropy
- 7.2.1 Company's Key Areas Served
- 7.2.2 Recent Developments
- 7.3. Company Market Share Analysis 2025
- 7.3.1 Top 5 Companies Market Share Analysis
- 7.3.2 Top 3 Companies Market Share Analysis
- 7.4. List of Potential Customers
- 8. Research Methodology
List of Figures
- Figure 1: Australia Co Office Space Industry Revenue Breakdown (billion, %) by Product 2025 & 2033
- Figure 2: Australia Co Office Space Industry Share (%) by Company 2025
List of Tables
- Table 1: Australia Co Office Space Industry Revenue billion Forecast, by Type 2020 & 2033
- Table 2: Australia Co Office Space Industry Revenue billion Forecast, by Application 2020 & 2033
- Table 3: Australia Co Office Space Industry Revenue billion Forecast, by End User 2020 & 2033
- Table 4: Australia Co Office Space Industry Revenue billion Forecast, by Key Cities 2020 & 2033
- Table 5: Australia Co Office Space Industry Revenue billion Forecast, by Region 2020 & 2033
- Table 6: Australia Co Office Space Industry Revenue billion Forecast, by Type 2020 & 2033
- Table 7: Australia Co Office Space Industry Revenue billion Forecast, by Application 2020 & 2033
- Table 8: Australia Co Office Space Industry Revenue billion Forecast, by End User 2020 & 2033
- Table 9: Australia Co Office Space Industry Revenue billion Forecast, by Key Cities 2020 & 2033
- Table 10: Australia Co Office Space Industry Revenue billion Forecast, by Country 2020 & 2033
Frequently Asked Questions
1. What is the projected Compound Annual Growth Rate (CAGR) of the Australia Co Office Space Industry?
The projected CAGR is approximately 8%.
2. Which companies are prominent players in the Australia Co Office Space Industry?
Key companies in the market include The Office Space, The Commons, Work Club Global, Workit Spaces, Spaces, Switch, workspace365 Pty Ltd, Coworking South Australia, WeWork Management LLC, WOTSO Limited, JustCo, CreativeCubes Co Pty Ltd**List Not Exhaustive, The Circle, Hub Australia.
3. What are the main segments of the Australia Co Office Space Industry?
The market segments include Type, Application, End User, Key Cities.
4. Can you provide details about the market size?
The market size is estimated to be USD 2.5 billion as of 2022.
5. What are some drivers contributing to market growth?
Strong Demand and Rising Construction Activities to Drive the Market; Rising House Prices in Germany Affecting Demand in the Market.
6. What are the notable trends driving market growth?
Co-working Spaces are Experiencing Significant Growth.
7. Are there any restraints impacting market growth?
Weak economic environment.
8. Can you provide examples of recent developments in the market?
N/A
9. What pricing options are available for accessing the report?
Pricing options include single-user, multi-user, and enterprise licenses priced at USD 3800, USD 4500, and USD 5800 respectively.
10. Is the market size provided in terms of value or volume?
The market size is provided in terms of value, measured in billion.
11. Are there any specific market keywords associated with the report?
Yes, the market keyword associated with the report is "Australia Co Office Space Industry," which aids in identifying and referencing the specific market segment covered.
12. How do I determine which pricing option suits my needs best?
The pricing options vary based on user requirements and access needs. Individual users may opt for single-user licenses, while businesses requiring broader access may choose multi-user or enterprise licenses for cost-effective access to the report.
13. Are there any additional resources or data provided in the Australia Co Office Space Industry report?
While the report offers comprehensive insights, it's advisable to review the specific contents or supplementary materials provided to ascertain if additional resources or data are available.
14. How can I stay updated on further developments or reports in the Australia Co Office Space Industry?
To stay informed about further developments, trends, and reports in the Australia Co Office Space Industry, consider subscribing to industry newsletters, following relevant companies and organizations, or regularly checking reputable industry news sources and publications.
Methodology
Step 1 - Identification of Relevant Samples Size from Population Database


Step 2 - Approaches for Defining Global Market Size (Value, Volume* & Price*)

Note*: In applicable scenarios
Step 3 - Data Sources
Primary Research
- Web Analytics
- Survey Reports
- Research Institute
- Latest Research Reports
- Opinion Leaders
Secondary Research
- Annual Reports
- White Paper
- Latest Press Release
- Industry Association
- Paid Database
- Investor Presentations

Step 4 - Data Triangulation
Involves using different sources of information in order to increase the validity of a study
These sources are likely to be stakeholders in a program - participants, other researchers, program staff, other community members, and so on.
Then we put all data in single framework & apply various statistical tools to find out the dynamic on the market.
During the analysis stage, feedback from the stakeholder groups would be compared to determine areas of agreement as well as areas of divergence