

Key Insights
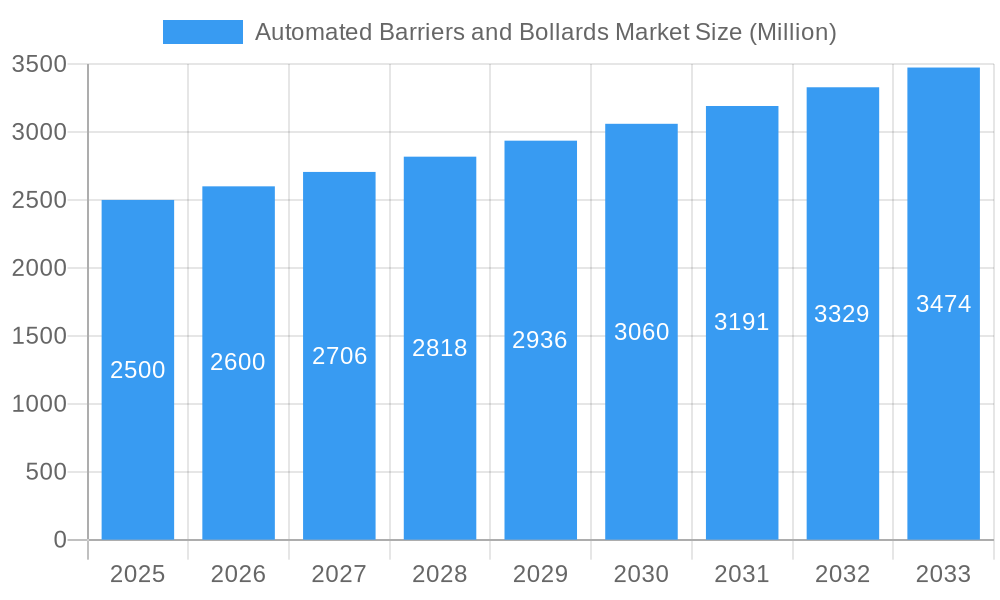
The global Automated Barriers and Bollards market is set for substantial expansion, driven by escalating security requirements across residential, commercial, and industrial sectors. The market, valued at $14.95 billion in 2025, is projected to achieve a Compound Annual Growth Rate (CAGR) of 15% from 2025 to 2033. Key growth drivers include the increasing adoption of smart city technologies, the imperative for enhanced security in public spaces and critical infrastructure, and technological advancements like RFID integration and remote control capabilities. Furthermore, the growing preference for automated solutions to boost operational efficiency and reduce labor costs is significantly propelling market growth.
Automated Barriers and Bollards Market Market Size (In Billion)
Despite robust growth, the market faces challenges such as high initial investment costs and potential concerns regarding system reliability and cybersecurity. Segmentation analysis indicates that while push-button barriers dominate, remote-controlled and RFID systems are experiencing rapid adoption due to advanced features. The commercial sector leads in end-user demand, followed by industrial and residential applications. Geographically, North America and Europe currently lead, with the Asia-Pacific region expected to witness considerable growth fueled by urbanization and infrastructure development. This evolving market presents significant opportunities, necessitating continuous innovation and strategic alliances.
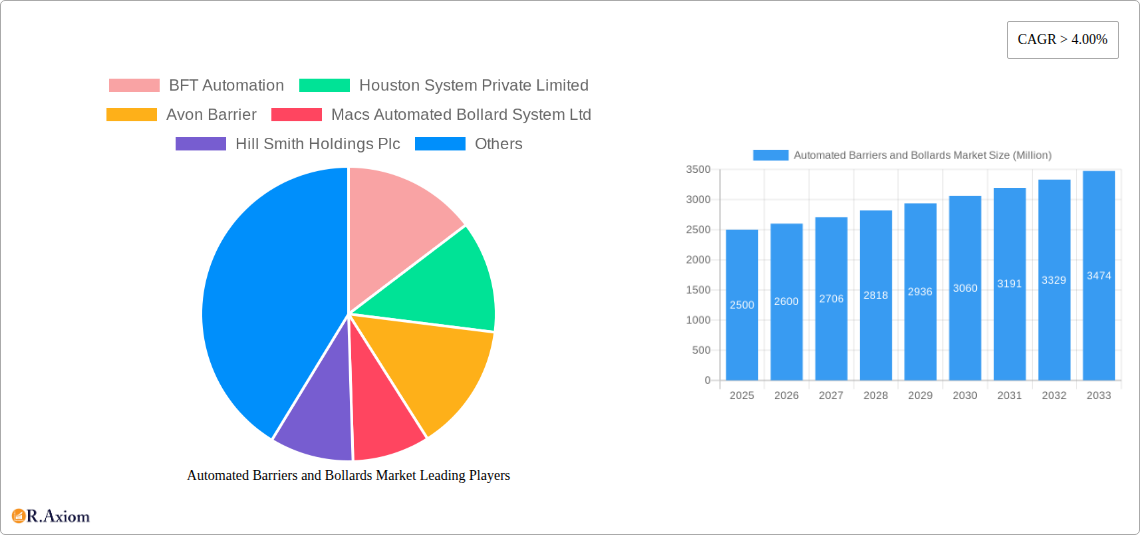
Automated Barriers and Bollards Market Company Market Share
Automated Barriers and Bollards Market: A Comprehensive Report (2019-2033)
This in-depth report provides a comprehensive analysis of the global Automated Barriers and Bollards Market, covering market size, growth drivers, challenges, opportunities, and key players. The study period spans from 2019 to 2033, with 2025 serving as the base and estimated year. The forecast period extends from 2025 to 2033, while the historical period covers 2019-2024. This report is essential for industry stakeholders, investors, and businesses seeking to understand and navigate this dynamic market.
Automated Barriers and Bollards Market Concentration & Innovation
The Automated Barriers and Bollards market exhibits a moderately concentrated landscape, with several key players holding significant market share. While precise market share figures require further analysis, BFT Automation, Houston System Private Limited, and Avon Barrier are amongst the prominent companies, likely holding a combined xx% market share in 2025. The market is characterized by ongoing innovation, driven by advancements in automation technology, such as improved sensor integration, AI-powered control systems, and enhanced security features. Regulatory frameworks, particularly concerning safety and security standards, significantly influence market dynamics. The substitution of traditional barriers with automated systems is a continuous trend. End-user preferences are shifting towards integrated, smart security solutions that can be remotely monitored and controlled. M&A activity in the sector has been moderate in recent years, with deal values averaging approximately xx Million annually. However, we expect increased consolidation as companies seek to expand their product portfolios and geographic reach. Key factors contributing to market consolidation include:
- Technological advancements: The need to integrate advanced technologies like AI and IoT for enhanced functionality is driving consolidation.
- Increased competition: Smaller players are merging to better compete with larger companies possessing greater resources.
- Expansion Strategies: Acquisitions help companies expand into new geographical markets or product segments.
Automated Barriers and Bollards Market Industry Trends & Insights
The Automated Barriers and Bollards market is experiencing robust growth, with a projected CAGR of xx% during the forecast period (2025-2033). This growth is primarily fueled by increasing security concerns across residential, commercial, and industrial sectors. The rising adoption of smart city initiatives globally is also significantly boosting market demand. Technological advancements, such as the integration of RFID and biometric authentication systems, are enhancing the functionality and security of these barriers and bollards. Consumer preferences are gravitating towards sophisticated, user-friendly systems capable of seamless integration with existing security infrastructures. Competitive dynamics are intensifying, with companies focusing on product differentiation through advanced features, improved durability, and competitive pricing strategies. Market penetration is highest in developed regions, with developing economies demonstrating substantial growth potential. The market size is estimated to reach xx Million by 2033.
Dominant Markets & Segments in Automated Barriers and Bollards Market
The commercial sector currently dominates the end-user segment, accounting for the largest market share (approximately xx%). This is driven by the increasing need for enhanced security in commercial spaces such as shopping malls, office buildings, and parking facilities. The industrial sector also demonstrates significant growth, propelled by the demand for secure access control in manufacturing plants and logistics centers. Among product types, Remote Controlled barriers and bollards hold the largest market share due to their flexibility and ease of operation. However, the RFID Tag Reader segment is expected to witness substantial growth due to increased adoption of contactless access technologies.
Key Drivers for Dominance:
- Commercial Sector: Stringent security regulations, high foot traffic, and asset protection needs.
- Industrial Sector: The necessity for controlled access to sensitive areas, enhanced safety, and optimized workflow.
- Remote Controlled Systems: Convenience, remote management capabilities, and suitability for diverse applications.
- RFID Tag Reader Systems: Enhanced security, contactless operation, and improved efficiency.
Regional Dominance: North America and Europe currently lead the market, driven by high infrastructure spending and strong adoption rates. However, Asia-Pacific is projected to experience significant growth in the coming years due to rapid urbanization and infrastructural development.
Automated Barriers and Bollards Market Product Developments
Recent product innovations focus on integrating advanced technologies such as AI-powered surveillance systems, improved crash-testing performance, and enhanced integration capabilities with existing security infrastructure. These developments deliver superior security, improved user experience, and enhanced operational efficiency. The market is witnessing a shift toward modular and customizable systems that cater to diverse end-user requirements and varying levels of security.
Report Scope & Segmentation Analysis
By Product:
- Push Button: This segment is characterized by relatively simple operation and lower cost, catering primarily to low-security applications. The market size is estimated at xx Million in 2025, with a projected CAGR of xx%.
- Remote Controlled: Offers greater flexibility and control, representing a larger market segment (xx Million in 2025) with a projected CAGR of xx%.
- RFID Tag Reader: This segment is experiencing rapid growth due to enhanced security and contactless operation. The market size is expected to reach xx Million by 2033.
- Loop Detectors: These systems offer efficient vehicle detection and automated barrier control; they have a relatively stable market share.
By End-user:
- Residential: This segment is smaller compared to others but exhibits steady growth driven by increasing personal security concerns.
- Commercial: The largest segment, driven by the need for secure access control in various commercial settings.
- Industrial: This segment demonstrates significant growth potential due to the high demand for robust security systems in industrial environments.
Key Drivers of Automated Barriers and Bollards Market Growth
Several factors fuel market growth, including: increasing security concerns globally, rising adoption of smart city technologies, advancements in automation and sensor technologies, favorable government regulations promoting enhanced security measures, and growing demand for efficient access control systems across diverse sectors.
Challenges in the Automated Barriers and Bollards Market Sector
Challenges include the high initial investment cost for advanced systems, potential supply chain disruptions affecting component availability, intense competition among manufacturers, and the need to comply with stringent safety and security regulations. These factors can negatively impact market growth and profitability for some companies.
Emerging Opportunities in Automated Barriers and Bollards Market
Opportunities lie in exploring new markets (e.g., developing economies), developing integrated security solutions combining barriers and bollards with surveillance and access control systems, and focusing on energy-efficient designs and sustainable materials to reduce environmental impact. Furthermore, exploring innovative financing options and expanding into specialized niche segments can unlock significant growth potential.
Leading Players in the Automated Barriers and Bollards Market Market
- BFT Automation
- Houston System Private Limited
- Avon Barrier
- Macs Automated Bollard System Ltd
- Hill Smith Holdings Plc
- Omnitec Group
- Optima Technic
- Consel Group AG
- Automatic System
- Magnetic Autocontrol GmbH
Key Developments in Automated Barriers and Bollards Market Industry
- 2023 (Q3): BFT Automation launched a new line of solar-powered barriers, catering to sustainable security solutions.
- 2022 (Q4): Avon Barrier acquired a smaller competitor, expanding its product portfolio and market reach. (Estimated deal value: xx Million)
- 2021 (Q2): Omnitec Group introduced an advanced RFID system with improved security features and enhanced range.
Strategic Outlook for Automated Barriers and Bollards Market Market
The Automated Barriers and Bollards market is poised for continued growth, driven by technological innovation, increasing security concerns, and expanding applications across various sectors. Companies that can successfully adapt to changing market dynamics, offer innovative solutions, and cater to the evolving needs of diverse end-users are best positioned to capitalize on the significant market opportunities. The focus on integrating AI and IoT technologies, enhancing product reliability, and providing superior customer service will be key for success.
Automated Barriers and Bollards Market Segmentation
-
1. Product
- 1.1. Push Button
- 1.2. Remote Controlled
- 1.3. RFID Tag Reader
- 1.4. Loop Detectors
-
2. End-user
- 2.1. Residential
- 2.2. Commercial
- 2.3. Industrial
Automated Barriers and Bollards Market Segmentation By Geography
- 1. North America
- 2. Europe
- 3. Asia Pacific
- 4. Middle East
- 5. Rest of the world
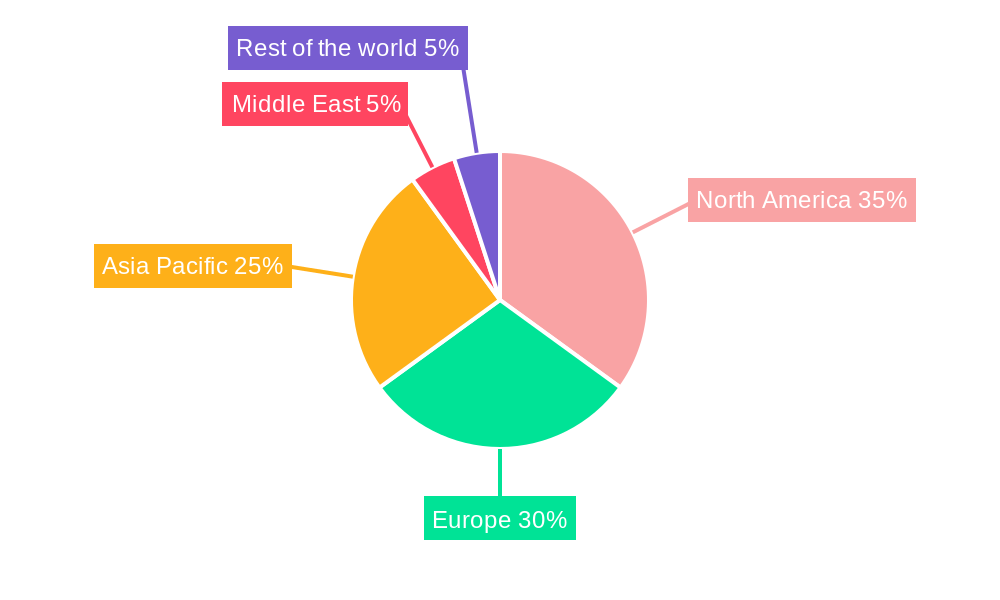
Automated Barriers and Bollards Market Regional Market Share
Geographic Coverage of Automated Barriers and Bollards Market
Automated Barriers and Bollards Market REPORT HIGHLIGHTS
| Aspects | Details |
|---|---|
| Study Period | 2020-2034 |
| Base Year | 2025 |
| Estimated Year | 2026 |
| Forecast Period | 2026-2034 |
| Historical Period | 2020-2025 |
| Growth Rate | CAGR of 15% from 2020-2034 |
| Segmentation |
|
Table of Contents
- 1. Introduction
- 1.1. Research Scope
- 1.2. Market Segmentation
- 1.3. Research Objective
- 1.4. Definitions and Assumptions
- 2. Executive Summary
- 2.1. Market Snapshot
- 3. Market Dynamics
- 3.1. Market Drivers
- 3.2. Market Restrains
- 3.3. Market Trends
- 3.4. Market Opportunities
- 4. Market Factor Analysis
- 4.1. Porters Five Forces
- 4.1.1. Bargaining Power of Suppliers
- 4.1.2. Bargaining Power of Buyers
- 4.1.3. Threat of New Entrants
- 4.1.4. Threat of Substitutes
- 4.1.5. Competitive Rivalry
- 4.2. PESTEL analysis
- 4.3. BCG Analysis
- 4.3.1. Stars (High Growth, High Market Share)
- 4.3.2. Cash Cows (Low Growth, High Market Share)
- 4.3.3. Question Mark (High Growth, Low Market Share)
- 4.3.4. Dogs (Low Growth, Low Market Share)
- 4.4. Ansoff Matrix Analysis
- 4.5. Supply Chain Analysis
- 4.6. Regulatory Landscape
- 4.7. Current Market Potential and Opportunity Assessment (TAM–SAM–SOM Framework)
- 4.8. RAX Analyst Note
- 4.1. Porters Five Forces
- 5. Market Analysis, Insights and Forecast 2021-2033
- 5.1. Market Analysis, Insights and Forecast - by Product
- 5.1.1. Push Button
- 5.1.2. Remote Controlled
- 5.1.3. RFID Tag Reader
- 5.1.4. Loop Detectors
- 5.2. Market Analysis, Insights and Forecast - by End-user
- 5.2.1. Residential
- 5.2.2. Commercial
- 5.2.3. Industrial
- 5.3. Market Analysis, Insights and Forecast - by Region
- 5.3.1. North America
- 5.3.2. Europe
- 5.3.3. Asia Pacific
- 5.3.4. Middle East
- 5.3.5. Rest of the world
- 5.1. Market Analysis, Insights and Forecast - by Product
- 6. Global Automated Barriers and Bollards Market Analysis, Insights and Forecast, 2021-2033
- 6.1. Market Analysis, Insights and Forecast - by Product
- 6.1.1. Push Button
- 6.1.2. Remote Controlled
- 6.1.3. RFID Tag Reader
- 6.1.4. Loop Detectors
- 6.2. Market Analysis, Insights and Forecast - by End-user
- 6.2.1. Residential
- 6.2.2. Commercial
- 6.2.3. Industrial
- 6.1. Market Analysis, Insights and Forecast - by Product
- 7. North America Automated Barriers and Bollards Market Analysis, Insights and Forecast, 2020-2032
- 7.1. Market Analysis, Insights and Forecast - by Product
- 7.1.1. Push Button
- 7.1.2. Remote Controlled
- 7.1.3. RFID Tag Reader
- 7.1.4. Loop Detectors
- 7.2. Market Analysis, Insights and Forecast - by End-user
- 7.2.1. Residential
- 7.2.2. Commercial
- 7.2.3. Industrial
- 7.1. Market Analysis, Insights and Forecast - by Product
- 8. Europe Automated Barriers and Bollards Market Analysis, Insights and Forecast, 2020-2032
- 8.1. Market Analysis, Insights and Forecast - by Product
- 8.1.1. Push Button
- 8.1.2. Remote Controlled
- 8.1.3. RFID Tag Reader
- 8.1.4. Loop Detectors
- 8.2. Market Analysis, Insights and Forecast - by End-user
- 8.2.1. Residential
- 8.2.2. Commercial
- 8.2.3. Industrial
- 8.1. Market Analysis, Insights and Forecast - by Product
- 9. Asia Pacific Automated Barriers and Bollards Market Analysis, Insights and Forecast, 2020-2032
- 9.1. Market Analysis, Insights and Forecast - by Product
- 9.1.1. Push Button
- 9.1.2. Remote Controlled
- 9.1.3. RFID Tag Reader
- 9.1.4. Loop Detectors
- 9.2. Market Analysis, Insights and Forecast - by End-user
- 9.2.1. Residential
- 9.2.2. Commercial
- 9.2.3. Industrial
- 9.1. Market Analysis, Insights and Forecast - by Product
- 10. Middle East Automated Barriers and Bollards Market Analysis, Insights and Forecast, 2020-2032
- 10.1. Market Analysis, Insights and Forecast - by Product
- 10.1.1. Push Button
- 10.1.2. Remote Controlled
- 10.1.3. RFID Tag Reader
- 10.1.4. Loop Detectors
- 10.2. Market Analysis, Insights and Forecast - by End-user
- 10.2.1. Residential
- 10.2.2. Commercial
- 10.2.3. Industrial
- 10.1. Market Analysis, Insights and Forecast - by Product
- 11. Rest of the world Automated Barriers and Bollards Market Analysis, Insights and Forecast, 2020-2032
- 11.1. Market Analysis, Insights and Forecast - by Product
- 11.1.1. Push Button
- 11.1.2. Remote Controlled
- 11.1.3. RFID Tag Reader
- 11.1.4. Loop Detectors
- 11.2. Market Analysis, Insights and Forecast - by End-user
- 11.2.1. Residential
- 11.2.2. Commercial
- 11.2.3. Industrial
- 11.1. Market Analysis, Insights and Forecast - by Product
- 12. Competitive Analysis
- 12.1. Company Profiles
- 12.1.1 BFT Automation
- 12.1.1.1. Company Overview
- 12.1.1.2. Products
- 12.1.1.3. Company Financials
- 12.1.1.4. SWOT Analysis
- 12.1.2 Houston System Private Limited
- 12.1.2.1. Company Overview
- 12.1.2.2. Products
- 12.1.2.3. Company Financials
- 12.1.2.4. SWOT Analysis
- 12.1.3 Avon Barrier
- 12.1.3.1. Company Overview
- 12.1.3.2. Products
- 12.1.3.3. Company Financials
- 12.1.3.4. SWOT Analysis
- 12.1.4 Macs Automated Bollard System Ltd
- 12.1.4.1. Company Overview
- 12.1.4.2. Products
- 12.1.4.3. Company Financials
- 12.1.4.4. SWOT Analysis
- 12.1.5 Hill Smith Holdings Plc
- 12.1.5.1. Company Overview
- 12.1.5.2. Products
- 12.1.5.3. Company Financials
- 12.1.5.4. SWOT Analysis
- 12.1.6 Omnitec Group
- 12.1.6.1. Company Overview
- 12.1.6.2. Products
- 12.1.6.3. Company Financials
- 12.1.6.4. SWOT Analysis
- 12.1.7 Optima Technic
- 12.1.7.1. Company Overview
- 12.1.7.2. Products
- 12.1.7.3. Company Financials
- 12.1.7.4. SWOT Analysis
- 12.1.8 Consel Group AG**List Not Exhaustive
- 12.1.8.1. Company Overview
- 12.1.8.2. Products
- 12.1.8.3. Company Financials
- 12.1.8.4. SWOT Analysis
- 12.1.9 Automatic System
- 12.1.9.1. Company Overview
- 12.1.9.2. Products
- 12.1.9.3. Company Financials
- 12.1.9.4. SWOT Analysis
- 12.1.10 Magnetic Autocontrol GmbH
- 12.1.10.1. Company Overview
- 12.1.10.2. Products
- 12.1.10.3. Company Financials
- 12.1.10.4. SWOT Analysis
- 12.1.1 BFT Automation
- 12.2. Market Entropy
- 12.2.1 Company's Key Areas Served
- 12.2.2 Recent Developments
- 12.3. Company Market Share Analysis 2025
- 12.3.1 Top 5 Companies Market Share Analysis
- 12.3.2 Top 3 Companies Market Share Analysis
- 12.4. List of Potential Customers
- 13. Research Methodology
List of Figures
- Figure 1: Global Automated Barriers and Bollards Market Revenue Breakdown (billion, %) by Region 2025 & 2033
- Figure 2: North America Automated Barriers and Bollards Market Revenue (billion), by Product 2025 & 2033
- Figure 3: North America Automated Barriers and Bollards Market Revenue Share (%), by Product 2025 & 2033
- Figure 4: North America Automated Barriers and Bollards Market Revenue (billion), by End-user 2025 & 2033
- Figure 5: North America Automated Barriers and Bollards Market Revenue Share (%), by End-user 2025 & 2033
- Figure 6: North America Automated Barriers and Bollards Market Revenue (billion), by Country 2025 & 2033
- Figure 7: North America Automated Barriers and Bollards Market Revenue Share (%), by Country 2025 & 2033
- Figure 8: Europe Automated Barriers and Bollards Market Revenue (billion), by Product 2025 & 2033
- Figure 9: Europe Automated Barriers and Bollards Market Revenue Share (%), by Product 2025 & 2033
- Figure 10: Europe Automated Barriers and Bollards Market Revenue (billion), by End-user 2025 & 2033
- Figure 11: Europe Automated Barriers and Bollards Market Revenue Share (%), by End-user 2025 & 2033
- Figure 12: Europe Automated Barriers and Bollards Market Revenue (billion), by Country 2025 & 2033
- Figure 13: Europe Automated Barriers and Bollards Market Revenue Share (%), by Country 2025 & 2033
- Figure 14: Asia Pacific Automated Barriers and Bollards Market Revenue (billion), by Product 2025 & 2033
- Figure 15: Asia Pacific Automated Barriers and Bollards Market Revenue Share (%), by Product 2025 & 2033
- Figure 16: Asia Pacific Automated Barriers and Bollards Market Revenue (billion), by End-user 2025 & 2033
- Figure 17: Asia Pacific Automated Barriers and Bollards Market Revenue Share (%), by End-user 2025 & 2033
- Figure 18: Asia Pacific Automated Barriers and Bollards Market Revenue (billion), by Country 2025 & 2033
- Figure 19: Asia Pacific Automated Barriers and Bollards Market Revenue Share (%), by Country 2025 & 2033
- Figure 20: Middle East Automated Barriers and Bollards Market Revenue (billion), by Product 2025 & 2033
- Figure 21: Middle East Automated Barriers and Bollards Market Revenue Share (%), by Product 2025 & 2033
- Figure 22: Middle East Automated Barriers and Bollards Market Revenue (billion), by End-user 2025 & 2033
- Figure 23: Middle East Automated Barriers and Bollards Market Revenue Share (%), by End-user 2025 & 2033
- Figure 24: Middle East Automated Barriers and Bollards Market Revenue (billion), by Country 2025 & 2033
- Figure 25: Middle East Automated Barriers and Bollards Market Revenue Share (%), by Country 2025 & 2033
- Figure 26: Rest of the world Automated Barriers and Bollards Market Revenue (billion), by Product 2025 & 2033
- Figure 27: Rest of the world Automated Barriers and Bollards Market Revenue Share (%), by Product 2025 & 2033
- Figure 28: Rest of the world Automated Barriers and Bollards Market Revenue (billion), by End-user 2025 & 2033
- Figure 29: Rest of the world Automated Barriers and Bollards Market Revenue Share (%), by End-user 2025 & 2033
- Figure 30: Rest of the world Automated Barriers and Bollards Market Revenue (billion), by Country 2025 & 2033
- Figure 31: Rest of the world Automated Barriers and Bollards Market Revenue Share (%), by Country 2025 & 2033
List of Tables
- Table 1: Global Automated Barriers and Bollards Market Revenue billion Forecast, by Product 2020 & 2033
- Table 2: Global Automated Barriers and Bollards Market Revenue billion Forecast, by End-user 2020 & 2033
- Table 3: Global Automated Barriers and Bollards Market Revenue billion Forecast, by Region 2020 & 2033
- Table 4: Global Automated Barriers and Bollards Market Revenue billion Forecast, by Product 2020 & 2033
- Table 5: Global Automated Barriers and Bollards Market Revenue billion Forecast, by End-user 2020 & 2033
- Table 6: Global Automated Barriers and Bollards Market Revenue billion Forecast, by Country 2020 & 2033
- Table 7: Global Automated Barriers and Bollards Market Revenue billion Forecast, by Product 2020 & 2033
- Table 8: Global Automated Barriers and Bollards Market Revenue billion Forecast, by End-user 2020 & 2033
- Table 9: Global Automated Barriers and Bollards Market Revenue billion Forecast, by Country 2020 & 2033
- Table 10: Global Automated Barriers and Bollards Market Revenue billion Forecast, by Product 2020 & 2033
- Table 11: Global Automated Barriers and Bollards Market Revenue billion Forecast, by End-user 2020 & 2033
- Table 12: Global Automated Barriers and Bollards Market Revenue billion Forecast, by Country 2020 & 2033
- Table 13: Global Automated Barriers and Bollards Market Revenue billion Forecast, by Product 2020 & 2033
- Table 14: Global Automated Barriers and Bollards Market Revenue billion Forecast, by End-user 2020 & 2033
- Table 15: Global Automated Barriers and Bollards Market Revenue billion Forecast, by Country 2020 & 2033
- Table 16: Global Automated Barriers and Bollards Market Revenue billion Forecast, by Product 2020 & 2033
- Table 17: Global Automated Barriers and Bollards Market Revenue billion Forecast, by End-user 2020 & 2033
- Table 18: Global Automated Barriers and Bollards Market Revenue billion Forecast, by Country 2020 & 2033
Frequently Asked Questions
1. What is the projected Compound Annual Growth Rate (CAGR) of the Automated Barriers and Bollards Market?
The projected CAGR is approximately 15%.
2. Which companies are prominent players in the Automated Barriers and Bollards Market?
Key companies in the market include BFT Automation, Houston System Private Limited, Avon Barrier, Macs Automated Bollard System Ltd, Hill Smith Holdings Plc, Omnitec Group, Optima Technic, Consel Group AG**List Not Exhaustive, Automatic System, Magnetic Autocontrol GmbH.
3. What are the main segments of the Automated Barriers and Bollards Market?
The market segments include Product, End-user.
4. Can you provide details about the market size?
The market size is estimated to be USD 14.95 billion as of 2022.
5. What are some drivers contributing to market growth?
4.; Rising Disposable Incomes4.; Government Initiatives4.; Growing Expatriate Population.
6. What are the notable trends driving market growth?
Growth in Smart Parking System.
7. Are there any restraints impacting market growth?
4.; Regulatory Framework4.; The Risk of Oversupply.
8. Can you provide examples of recent developments in the market?
N/A
9. What pricing options are available for accessing the report?
Pricing options include single-user, multi-user, and enterprise licenses priced at USD 4750, USD 5250, and USD 8750 respectively.
10. Is the market size provided in terms of value or volume?
The market size is provided in terms of value, measured in billion.
11. Are there any specific market keywords associated with the report?
Yes, the market keyword associated with the report is "Automated Barriers and Bollards Market," which aids in identifying and referencing the specific market segment covered.
12. How do I determine which pricing option suits my needs best?
The pricing options vary based on user requirements and access needs. Individual users may opt for single-user licenses, while businesses requiring broader access may choose multi-user or enterprise licenses for cost-effective access to the report.
13. Are there any additional resources or data provided in the Automated Barriers and Bollards Market report?
While the report offers comprehensive insights, it's advisable to review the specific contents or supplementary materials provided to ascertain if additional resources or data are available.
14. How can I stay updated on further developments or reports in the Automated Barriers and Bollards Market?
To stay informed about further developments, trends, and reports in the Automated Barriers and Bollards Market, consider subscribing to industry newsletters, following relevant companies and organizations, or regularly checking reputable industry news sources and publications.
Methodology
Step 1 - Identification of Relevant Samples Size from Population Database


Step 2 - Approaches for Defining Global Market Size (Value, Volume* & Price*)

Note*: In applicable scenarios
Step 3 - Data Sources
Primary Research
- Web Analytics
- Survey Reports
- Research Institute
- Latest Research Reports
- Opinion Leaders
Secondary Research
- Annual Reports
- White Paper
- Latest Press Release
- Industry Association
- Paid Database
- Investor Presentations

Step 4 - Data Triangulation
Involves using different sources of information in order to increase the validity of a study
These sources are likely to be stakeholders in a program - participants, other researchers, program staff, other community members, and so on.
Then we put all data in single framework & apply various statistical tools to find out the dynamic on the market.
During the analysis stage, feedback from the stakeholder groups would be compared to determine areas of agreement as well as areas of divergence