
Key Insights
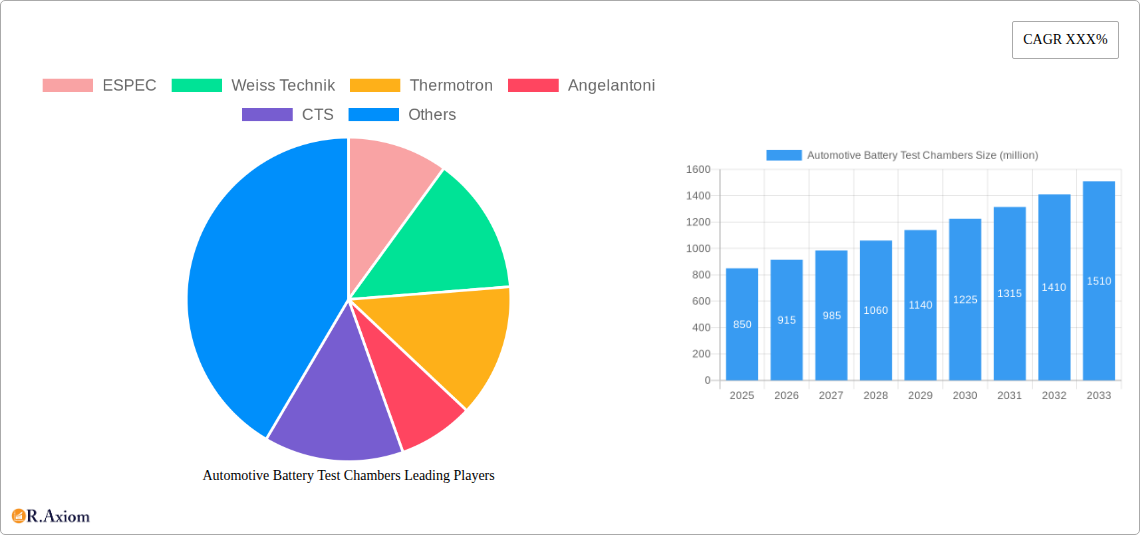
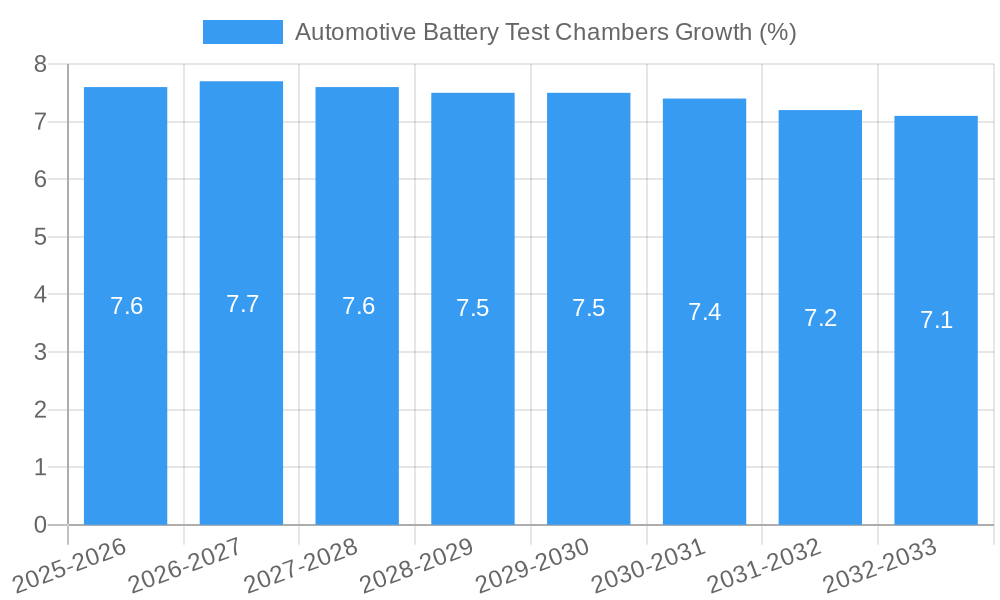
The global market for Automotive Battery Test Chambers is experiencing robust growth, driven by the escalating demand for electric vehicles (EVs) and stringent safety regulations. With an estimated market size of approximately $850 million in 2025, the industry is projected to expand at a Compound Annual Growth Rate (CAGR) of around 7.5% through 2033. This substantial growth is fueled by the increasing production of Battery Electric Vehicles (BEVs) and Plug-in Hybrid Electric Vehicles (PHEVs), necessitating advanced testing solutions to ensure battery performance, longevity, and safety under various environmental conditions. Key applications include temperature chambers to simulate extreme climates, humidity chambers for moisture resistance, and specialized safety testing chambers to evaluate thermal runaway and other critical failure modes. The push for higher energy density, faster charging capabilities, and improved battery management systems also necessitates sophisticated testing, further propelling market expansion.
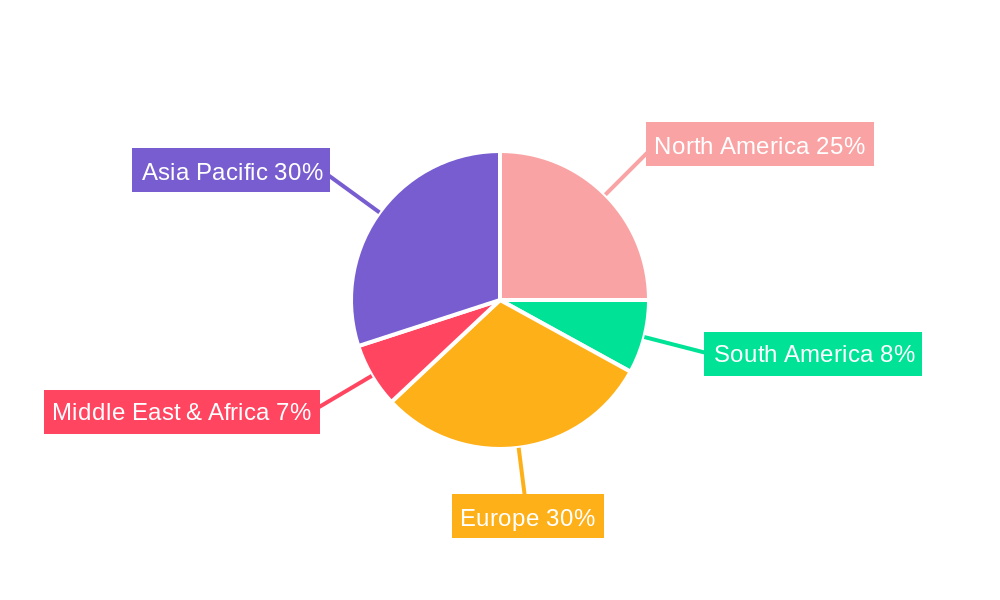
The market landscape is characterized by intense competition and significant investment in research and development by leading players like ESPEC, Weiss Technik, and Thermotron. These companies are focusing on developing chambers with enhanced precision, larger capacities, and integrated data acquisition systems to meet the evolving needs of automotive manufacturers and battery suppliers. Geographically, Asia Pacific, particularly China, is emerging as a dominant region due to its leadership in EV manufacturing and a growing domestic battery production ecosystem. North America and Europe also represent significant markets, driven by government incentives for EV adoption and advanced automotive R&D. Challenges such as the high initial cost of specialized testing equipment and the need for skilled personnel to operate and maintain them present some restraints. However, the overall outlook remains highly positive, supported by continuous technological advancements and the global transition towards sustainable mobility solutions.
Automotive Battery Test Chambers Market Concentration & Innovation
The automotive battery test chamber market exhibits a moderate to high concentration, with a significant portion of market share held by a few established players like ESPEC, Weiss Technik, and Thermotron. The innovation landscape is being actively shaped by the escalating demand for advanced battery chemistries and stringent safety regulations governing electric vehicles (EVs). Key innovation drivers include the need for chambers capable of simulating extreme temperature ranges, high humidity environments, and precise voltage/current control for comprehensive battery lifecycle testing. Regulatory frameworks, such as UN ECE R100 for battery safety and various regional EV mandates, are compelling manufacturers to invest in sophisticated testing equipment. Product substitutes, while limited for full-scale battery performance and safety testing, can include simpler environmental chambers for specific component testing or simulation software. End-user trends strongly favor BEV and PHEV applications, driving the demand for specialized chambers that can replicate real-world driving conditions, fast-charging scenarios, and prolonged aging tests. Mergers and acquisition (M&A) activities, while not always publicly disclosed with specific deal values, are likely to focus on companies possessing unique technological capabilities or strong regional market presence to enhance competitive advantage. For instance, a hypothetical M&A deal to acquire a company with advanced thermal management technology could be valued in the tens of millions.
Automotive Battery Test Chambers Industry Trends & Insights
The automotive battery test chambers market is poised for robust growth, driven by the accelerating global adoption of electric vehicles. The forecast period of 2025–2033 anticipates a Compound Annual Growth Rate (CAGR) of approximately 10% to 15%, with the market size projected to reach over several million dollars by 2033. This expansion is primarily fueled by the burgeoning demand for Battery Electric Vehicles (BEVs) and Plug-in Hybrid Electric Vehicles (PHEVs), necessitating rigorous testing to ensure battery performance, safety, and longevity. Technological disruptions are at the forefront, with manufacturers continuously innovating to offer chambers with enhanced temperature cycling capabilities, improved humidity control, and integrated data acquisition systems for real-time monitoring. The trend towards faster charging and longer driving ranges for EVs directly translates into a demand for test chambers that can simulate these extreme conditions accurately and efficiently. Consumer preferences are increasingly leaning towards vehicles with reliable and long-lasting battery packs, thus placing immense pressure on automakers and battery manufacturers to conduct thorough validation. This, in turn, drives the market for high-performance test chambers. Competitive dynamics are characterized by a blend of established global players and emerging regional manufacturers. Companies are investing heavily in research and development to differentiate their offerings through features like modular designs, energy efficiency, and advanced control software. The market penetration of advanced automotive battery test chambers is expected to rise significantly as regulatory bodies worldwide implement stricter safety and performance standards for EV batteries. The global market is estimated to be in the range of several million dollars in the base year 2025.
Dominant Markets & Segments in Automotive Battery Test Chambers
The Asia-Pacific region is emerging as the dominant market for automotive battery test chambers, primarily driven by China's leading position in global EV production and adoption. Countries within this region benefit from substantial government incentives for EV manufacturing, robust supply chain infrastructure, and a rapidly growing consumer base eager for electric mobility solutions. The BEV application segment represents the largest and fastest-growing segment within the automotive battery test chambers market, accounting for over 60% of the market share. This dominance is directly attributable to the exponential growth in BEV sales worldwide.
Key Drivers for Asia-Pacific Dominance:
- Government Policies & Incentives: Extensive subsidies and favorable policies promoting EV production and sales.
- Manufacturing Hub: Presence of major EV and battery manufacturers, creating localized demand for testing equipment.
- Technological Advancement: Strong focus on R&D and adoption of cutting-edge battery technologies.
- Growing Middle Class: Increasing disposable income and environmental awareness driving consumer adoption of EVs.
Dominance of BEV Application:
- Exponential Sales Growth: Unprecedented surge in demand for fully electric vehicles.
- Battery Performance & Safety Focus: Critical need for extensive testing to ensure battery reliability and prevent thermal runaway.
- Range Anxiety Mitigation: Testing protocols aimed at validating and improving battery range under various conditions.
- Fast Charging Infrastructure Development: Demand for chambers simulating rapid charging cycles.
The Temperature Chambers segment within the "Type" classification is also a dominant force, as temperature is a critical factor affecting battery performance, degradation, and safety.
- Key Drivers for Temperature Chamber Dominance:
- Extreme Temperature Simulation: Essential for testing battery performance in diverse climates, from scorching deserts to freezing regions.
- Thermal Cycling: Crucial for assessing battery lifespan and durability under repeated temperature fluctuations.
- Battery Management System (BMS) Validation: Testing how the BMS manages battery temperature during operation and charging.
- Safety Testing Compliance: Many safety regulations mandate testing under extreme temperature conditions.
The market size for the overall automotive battery test chambers is projected to be in the range of several million dollars in the base year 2025, with the BEV segment alone contributing a significant portion of this value.
Automotive Battery Test Chambers Product Developments
Product developments in the automotive battery test chambers market are heavily focused on enhancing precision, speed, and safety for EV battery validation. Innovations include chambers with wider operational temperature ranges, faster ramp rates for thermal cycling, and improved humidity control for simulating diverse environmental conditions. Manufacturers are integrating advanced data logging and analysis capabilities, often coupled with sophisticated control software that can replicate complex driving cycles and charging profiles. Competitive advantages are being gained through modular designs for flexibility, energy-efficient operation, and compliance with increasingly stringent global safety standards like UN ECE R100. The market is seeing advancements in chambers designed for larger battery packs, reflecting the trend towards higher energy density and longer ranges in electric vehicles.
Report Scope & Segmentation Analysis
This report provides a comprehensive analysis of the global automotive battery test chambers market. The market is segmented based on Application, encompassing BEV (Battery Electric Vehicle), PHEV (Plug-in Hybrid Electric Vehicle), and Others (e.g., hybrid electric vehicles, commercial EVs). The Type segmentation includes Temperature Chambers, Humidity Chambers, Safety Testing Chambers, Mechanical Stress Chambers, and Others (e.g., combined environmental chambers).
- BEV: This segment is projected to experience the highest growth rate, driven by the massive global investment and consumer demand for fully electric vehicles. The market size is expected to reach several million dollars by 2033.
- PHEV: While growing, the PHEV segment is anticipated to have a more moderate growth rate compared to BEVs, as the industry shifts towards pure electric solutions.
- Others: This segment includes niche applications and is expected to see steady but slower growth.
- Temperature Chambers: This segment holds a significant market share and is projected for substantial growth due to the critical role of temperature in battery performance and safety.
- Humidity Chambers: Essential for simulating various climatic conditions, this segment is also poised for consistent growth.
- Safety Testing Chambers: Driven by stringent regulatory requirements, this segment is crucial and expected to expand significantly.
- Mechanical Stress Chambers: These are vital for testing battery durability under vibration and shock, showing moderate but steady growth.
- Others: This encompasses specialized chambers, with growth expected to be tied to specific technological advancements.
Key Drivers of Automotive Battery Test Chambers Growth
The automotive battery test chambers market is experiencing significant growth, propelled by several interconnected factors. The escalating global demand for electric vehicles (EVs), particularly Battery Electric Vehicles (BEVs) and Plug-in Hybrid Electric Vehicles (PHEVs), is the primary catalyst. This surge in EV adoption is directly linked to increasing environmental awareness, supportive government policies such as subsidies and tax incentives, and advancements in battery technology offering longer ranges and faster charging. Furthermore, stringent regulatory frameworks concerning battery safety and performance, like UN ECE R100, are mandating rigorous testing protocols, thereby boosting the demand for sophisticated test chambers. Technological advancements in battery chemistries and management systems also necessitate the development and use of advanced testing equipment capable of simulating extreme conditions and replicating real-world driving scenarios.
Challenges in the Automotive Battery Test Chambers Sector
Despite the robust growth, the automotive battery test chambers sector faces several challenges. High initial investment costs for advanced testing equipment can be a significant barrier for smaller manufacturers or emerging players. The increasing complexity of battery technologies, including new chemistries and higher voltage systems, requires continuous innovation and adaptation from test chamber manufacturers, leading to higher R&D expenses. Supply chain disruptions, particularly for specialized components, can impact production timelines and increase costs. Furthermore, technical expertise and skilled personnel are required to operate and maintain these sophisticated chambers, leading to potential labor shortages. Intense competitive pressure from both established and new entrants also puts pressure on pricing and profit margins.
Emerging Opportunities in Automotive Battery Test Chambers
The automotive battery test chambers market is ripe with emerging opportunities. The development of advanced battery chemistries, such as solid-state batteries, presents a significant opportunity for manufacturers to develop specialized testing chambers capable of simulating novel operating conditions and safety requirements. The expansion of charging infrastructure and the trend towards ultra-fast charging necessitate chambers that can accurately replicate these high-power charging cycles to ensure battery integrity. The growing demand for testing battery systems in diverse climates and extreme conditions opens avenues for chambers with enhanced environmental simulation capabilities. Furthermore, the increasing focus on battery recycling and second-life applications creates a niche for test chambers designed for evaluating repurposed batteries. The integration of AI and machine learning into test chamber control and data analysis offers opportunities for predictive maintenance and optimized testing strategies, leading to increased efficiency and reduced testing times.
Leading Players in the Automotive Battery Test Chambers Market
- ESPEC
- Weiss Technik
- Thermotron
- Angelantoni
- CTS
- Suga Test Instruments
- TPS
- Binder
- Climats
- Associated Environmental Systems
- Russells Technical Products
- CME
- EQUILAM
- Presto Testing Instruments
- Xiamen Tmax
- Chroma Systems Solutions
- Megger
- Chauvin Arnoux
- Arbin Instruments
- Century Yuasa Batteries
- TENMARS ELECTRONIC
- Midtronics
- TOMILO
- Suzhou Sushi Testing Group
- Envsin
- Chongqing Yinhe Testing Instrument
- DOAHO Testing Equipment
- Chongqing ATEC Technology
- GWS Environmental Equipment
Key Developments in Automotive Battery Test Chambers Industry
- 2023/01: ESPEC launches a new series of highly energy-efficient environmental test chambers, catering to the growing demand for sustainable testing solutions in the automotive sector.
- 2023/03: Weiss Technik announces the expansion of its global service network, aiming to provide enhanced support for automotive battery testing customers worldwide.
- 2023/05: Thermotron introduces a new generation of rapid rate temperature cycling chambers, designed to accelerate battery aging and performance validation for EVs.
- 2023/07: Angelantoni acquires a specialized company in thermal management technology, strengthening its portfolio for advanced battery testing solutions.
- 2023/09: CTS unveils a new compact environmental chamber designed for testing individual battery cells and modules, addressing the need for scalable testing solutions.
- 2023/11: Suga Test Instruments showcases its latest advancements in high-humidity and corrosion testing chambers, crucial for evaluating battery longevity in challenging environments.
- 2024/01: Arbin Instruments releases its next-generation battery cyclers with enhanced safety features and integrated data analytics capabilities, targeting the high-end EV battery market.
- 2024/02: Midtronics introduces innovative diagnostic tools that complement battery testing chambers, offering a more comprehensive approach to battery health assessment.
- 2024/03: Presto Testing Instruments launches a cost-effective range of environmental chambers, making advanced testing accessible to a broader segment of the automotive supply chain.
- 2024/04: Xiamen Tmax announces strategic partnerships with key EV battery manufacturers to co-develop tailored testing solutions.
- 2024/05: Chongqing ATEC Technology showcases advancements in programmable power sources for battery simulation, enabling more realistic testing scenarios.
- 2024/06: Envsin highlights its focus on developing advanced safety testing chambers capable of simulating thermal runaway events with enhanced precision.
Strategic Outlook for Automotive Battery Test Chambers Market
The strategic outlook for the automotive battery test chambers market is overwhelmingly positive, driven by the irreversible shift towards electric mobility. Future growth will be fueled by continued innovation in battery technology, necessitating chambers capable of simulating ever-more demanding conditions. Key growth catalysts include the global push for decarbonization, which will sustain and accelerate EV adoption, thereby increasing the demand for reliable battery testing solutions. Manufacturers will likely focus on developing more integrated and intelligent testing systems, leveraging AI and IoT to optimize efficiency and provide deeper insights into battery performance and longevity. The increasing standardization of safety regulations and the need to validate batteries for a wider range of applications, from passenger cars to heavy-duty trucks and energy storage systems, will further solidify the market's expansion. Companies that can offer scalable, customizable, and technologically advanced solutions, coupled with robust after-sales support, are well-positioned to capitalize on the immense opportunities in this dynamic sector.
Automotive Battery Test Chambers Segmentation
-
1. Application
- 1.1. BEV
- 1.2. PHEV
- 1.3. Others
-
2. Type
- 2.1. Temperature Chambers
- 2.2. Humidity Chambers
- 2.3. Safety Testing Chambers
- 2.4. Mechanical Stress Chambers
- 2.5. Others
Automotive Battery Test Chambers Segmentation By Geography
-
1. North America
- 1.1. United States
- 1.2. Canada
- 1.3. Mexico
-
2. South America
- 2.1. Brazil
- 2.2. Argentina
- 2.3. Rest of South America
-
3. Europe
- 3.1. United Kingdom
- 3.2. Germany
- 3.3. France
- 3.4. Italy
- 3.5. Spain
- 3.6. Russia
- 3.7. Benelux
- 3.8. Nordics
- 3.9. Rest of Europe
-
4. Middle East & Africa
- 4.1. Turkey
- 4.2. Israel
- 4.3. GCC
- 4.4. North Africa
- 4.5. South Africa
- 4.6. Rest of Middle East & Africa
-
5. Asia Pacific
- 5.1. China
- 5.2. India
- 5.3. Japan
- 5.4. South Korea
- 5.5. ASEAN
- 5.6. Oceania
- 5.7. Rest of Asia Pacific
Automotive Battery Test Chambers REPORT HIGHLIGHTS
| Aspects | Details |
|---|---|
| Study Period | 2019-2033 |
| Base Year | 2024 |
| Estimated Year | 2025 |
| Forecast Period | 2025-2033 |
| Historical Period | 2019-2024 |
| Growth Rate | CAGR of XXX% from 2019-2033 |
| Segmentation |
|
Table of Contents
- 1. Introduction
- 1.1. Research Scope
- 1.2. Market Segmentation
- 1.3. Research Methodology
- 1.4. Definitions and Assumptions
- 2. Executive Summary
- 2.1. Introduction
- 3. Market Dynamics
- 3.1. Introduction
- 3.2. Market Drivers
- 3.3. Market Restrains
- 3.4. Market Trends
- 4. Market Factor Analysis
- 4.1. Porters Five Forces
- 4.2. Supply/Value Chain
- 4.3. PESTEL analysis
- 4.4. Market Entropy
- 4.5. Patent/Trademark Analysis
- 5. Global Automotive Battery Test Chambers Analysis, Insights and Forecast, 2019-2031
- 5.1. Market Analysis, Insights and Forecast - by Application
- 5.1.1. BEV
- 5.1.2. PHEV
- 5.1.3. Others
- 5.2. Market Analysis, Insights and Forecast - by Type
- 5.2.1. Temperature Chambers
- 5.2.2. Humidity Chambers
- 5.2.3. Safety Testing Chambers
- 5.2.4. Mechanical Stress Chambers
- 5.2.5. Others
- 5.3. Market Analysis, Insights and Forecast - by Region
- 5.3.1. North America
- 5.3.2. South America
- 5.3.3. Europe
- 5.3.4. Middle East & Africa
- 5.3.5. Asia Pacific
- 5.1. Market Analysis, Insights and Forecast - by Application
- 6. North America Automotive Battery Test Chambers Analysis, Insights and Forecast, 2019-2031
- 6.1. Market Analysis, Insights and Forecast - by Application
- 6.1.1. BEV
- 6.1.2. PHEV
- 6.1.3. Others
- 6.2. Market Analysis, Insights and Forecast - by Type
- 6.2.1. Temperature Chambers
- 6.2.2. Humidity Chambers
- 6.2.3. Safety Testing Chambers
- 6.2.4. Mechanical Stress Chambers
- 6.2.5. Others
- 6.1. Market Analysis, Insights and Forecast - by Application
- 7. South America Automotive Battery Test Chambers Analysis, Insights and Forecast, 2019-2031
- 7.1. Market Analysis, Insights and Forecast - by Application
- 7.1.1. BEV
- 7.1.2. PHEV
- 7.1.3. Others
- 7.2. Market Analysis, Insights and Forecast - by Type
- 7.2.1. Temperature Chambers
- 7.2.2. Humidity Chambers
- 7.2.3. Safety Testing Chambers
- 7.2.4. Mechanical Stress Chambers
- 7.2.5. Others
- 7.1. Market Analysis, Insights and Forecast - by Application
- 8. Europe Automotive Battery Test Chambers Analysis, Insights and Forecast, 2019-2031
- 8.1. Market Analysis, Insights and Forecast - by Application
- 8.1.1. BEV
- 8.1.2. PHEV
- 8.1.3. Others
- 8.2. Market Analysis, Insights and Forecast - by Type
- 8.2.1. Temperature Chambers
- 8.2.2. Humidity Chambers
- 8.2.3. Safety Testing Chambers
- 8.2.4. Mechanical Stress Chambers
- 8.2.5. Others
- 8.1. Market Analysis, Insights and Forecast - by Application
- 9. Middle East & Africa Automotive Battery Test Chambers Analysis, Insights and Forecast, 2019-2031
- 9.1. Market Analysis, Insights and Forecast - by Application
- 9.1.1. BEV
- 9.1.2. PHEV
- 9.1.3. Others
- 9.2. Market Analysis, Insights and Forecast - by Type
- 9.2.1. Temperature Chambers
- 9.2.2. Humidity Chambers
- 9.2.3. Safety Testing Chambers
- 9.2.4. Mechanical Stress Chambers
- 9.2.5. Others
- 9.1. Market Analysis, Insights and Forecast - by Application
- 10. Asia Pacific Automotive Battery Test Chambers Analysis, Insights and Forecast, 2019-2031
- 10.1. Market Analysis, Insights and Forecast - by Application
- 10.1.1. BEV
- 10.1.2. PHEV
- 10.1.3. Others
- 10.2. Market Analysis, Insights and Forecast - by Type
- 10.2.1. Temperature Chambers
- 10.2.2. Humidity Chambers
- 10.2.3. Safety Testing Chambers
- 10.2.4. Mechanical Stress Chambers
- 10.2.5. Others
- 10.1. Market Analysis, Insights and Forecast - by Application
- 11. Competitive Analysis
- 11.1. Global Market Share Analysis 2024
- 11.2. Company Profiles
- 11.2.1 ESPEC
- 11.2.1.1. Overview
- 11.2.1.2. Products
- 11.2.1.3. SWOT Analysis
- 11.2.1.4. Recent Developments
- 11.2.1.5. Financials (Based on Availability)
- 11.2.2 Weiss Technik
- 11.2.2.1. Overview
- 11.2.2.2. Products
- 11.2.2.3. SWOT Analysis
- 11.2.2.4. Recent Developments
- 11.2.2.5. Financials (Based on Availability)
- 11.2.3 Thermotron
- 11.2.3.1. Overview
- 11.2.3.2. Products
- 11.2.3.3. SWOT Analysis
- 11.2.3.4. Recent Developments
- 11.2.3.5. Financials (Based on Availability)
- 11.2.4 Angelantoni
- 11.2.4.1. Overview
- 11.2.4.2. Products
- 11.2.4.3. SWOT Analysis
- 11.2.4.4. Recent Developments
- 11.2.4.5. Financials (Based on Availability)
- 11.2.5 CTS
- 11.2.5.1. Overview
- 11.2.5.2. Products
- 11.2.5.3. SWOT Analysis
- 11.2.5.4. Recent Developments
- 11.2.5.5. Financials (Based on Availability)
- 11.2.6 Suga Test Instruments
- 11.2.6.1. Overview
- 11.2.6.2. Products
- 11.2.6.3. SWOT Analysis
- 11.2.6.4. Recent Developments
- 11.2.6.5. Financials (Based on Availability)
- 11.2.7 TPS
- 11.2.7.1. Overview
- 11.2.7.2. Products
- 11.2.7.3. SWOT Analysis
- 11.2.7.4. Recent Developments
- 11.2.7.5. Financials (Based on Availability)
- 11.2.8 Binder
- 11.2.8.1. Overview
- 11.2.8.2. Products
- 11.2.8.3. SWOT Analysis
- 11.2.8.4. Recent Developments
- 11.2.8.5. Financials (Based on Availability)
- 11.2.9 Climats
- 11.2.9.1. Overview
- 11.2.9.2. Products
- 11.2.9.3. SWOT Analysis
- 11.2.9.4. Recent Developments
- 11.2.9.5. Financials (Based on Availability)
- 11.2.10 Associated Environmental Systems
- 11.2.10.1. Overview
- 11.2.10.2. Products
- 11.2.10.3. SWOT Analysis
- 11.2.10.4. Recent Developments
- 11.2.10.5. Financials (Based on Availability)
- 11.2.11 Russells Technical Products
- 11.2.11.1. Overview
- 11.2.11.2. Products
- 11.2.11.3. SWOT Analysis
- 11.2.11.4. Recent Developments
- 11.2.11.5. Financials (Based on Availability)
- 11.2.12 CME
- 11.2.12.1. Overview
- 11.2.12.2. Products
- 11.2.12.3. SWOT Analysis
- 11.2.12.4. Recent Developments
- 11.2.12.5. Financials (Based on Availability)
- 11.2.13 EQUILAM
- 11.2.13.1. Overview
- 11.2.13.2. Products
- 11.2.13.3. SWOT Analysis
- 11.2.13.4. Recent Developments
- 11.2.13.5. Financials (Based on Availability)
- 11.2.14 Presto Testing Instruments
- 11.2.14.1. Overview
- 11.2.14.2. Products
- 11.2.14.3. SWOT Analysis
- 11.2.14.4. Recent Developments
- 11.2.14.5. Financials (Based on Availability)
- 11.2.15 Xiamen Tmax
- 11.2.15.1. Overview
- 11.2.15.2. Products
- 11.2.15.3. SWOT Analysis
- 11.2.15.4. Recent Developments
- 11.2.15.5. Financials (Based on Availability)
- 11.2.16 Chroma Systems Solutions
- 11.2.16.1. Overview
- 11.2.16.2. Products
- 11.2.16.3. SWOT Analysis
- 11.2.16.4. Recent Developments
- 11.2.16.5. Financials (Based on Availability)
- 11.2.17 Megger
- 11.2.17.1. Overview
- 11.2.17.2. Products
- 11.2.17.3. SWOT Analysis
- 11.2.17.4. Recent Developments
- 11.2.17.5. Financials (Based on Availability)
- 11.2.18 Chauvin Arnoux
- 11.2.18.1. Overview
- 11.2.18.2. Products
- 11.2.18.3. SWOT Analysis
- 11.2.18.4. Recent Developments
- 11.2.18.5. Financials (Based on Availability)
- 11.2.19 Arbin Instruments
- 11.2.19.1. Overview
- 11.2.19.2. Products
- 11.2.19.3. SWOT Analysis
- 11.2.19.4. Recent Developments
- 11.2.19.5. Financials (Based on Availability)
- 11.2.20 Century Yuasa Batteries
- 11.2.20.1. Overview
- 11.2.20.2. Products
- 11.2.20.3. SWOT Analysis
- 11.2.20.4. Recent Developments
- 11.2.20.5. Financials (Based on Availability)
- 11.2.21 TENMARS ELECTRONIC
- 11.2.21.1. Overview
- 11.2.21.2. Products
- 11.2.21.3. SWOT Analysis
- 11.2.21.4. Recent Developments
- 11.2.21.5. Financials (Based on Availability)
- 11.2.22 Midtronics
- 11.2.22.1. Overview
- 11.2.22.2. Products
- 11.2.22.3. SWOT Analysis
- 11.2.22.4. Recent Developments
- 11.2.22.5. Financials (Based on Availability)
- 11.2.23 TOMILO
- 11.2.23.1. Overview
- 11.2.23.2. Products
- 11.2.23.3. SWOT Analysis
- 11.2.23.4. Recent Developments
- 11.2.23.5. Financials (Based on Availability)
- 11.2.24 Suzhou Sushi Testing Group
- 11.2.24.1. Overview
- 11.2.24.2. Products
- 11.2.24.3. SWOT Analysis
- 11.2.24.4. Recent Developments
- 11.2.24.5. Financials (Based on Availability)
- 11.2.25 Envsin
- 11.2.25.1. Overview
- 11.2.25.2. Products
- 11.2.25.3. SWOT Analysis
- 11.2.25.4. Recent Developments
- 11.2.25.5. Financials (Based on Availability)
- 11.2.26 Chongqing Yinhe Testing Instrument
- 11.2.26.1. Overview
- 11.2.26.2. Products
- 11.2.26.3. SWOT Analysis
- 11.2.26.4. Recent Developments
- 11.2.26.5. Financials (Based on Availability)
- 11.2.27 DOAHO Testing Equipment
- 11.2.27.1. Overview
- 11.2.27.2. Products
- 11.2.27.3. SWOT Analysis
- 11.2.27.4. Recent Developments
- 11.2.27.5. Financials (Based on Availability)
- 11.2.28 Chongqing ATEC Technology
- 11.2.28.1. Overview
- 11.2.28.2. Products
- 11.2.28.3. SWOT Analysis
- 11.2.28.4. Recent Developments
- 11.2.28.5. Financials (Based on Availability)
- 11.2.29 GWS Environmental Equipment
- 11.2.29.1. Overview
- 11.2.29.2. Products
- 11.2.29.3. SWOT Analysis
- 11.2.29.4. Recent Developments
- 11.2.29.5. Financials (Based on Availability)
- 11.2.1 ESPEC
List of Figures
- Figure 1: Global Automotive Battery Test Chambers Revenue Breakdown (million, %) by Region 2024 & 2032
- Figure 2: Global Automotive Battery Test Chambers Volume Breakdown (K, %) by Region 2024 & 2032
- Figure 3: North America Automotive Battery Test Chambers Revenue (million), by Application 2024 & 2032
- Figure 4: North America Automotive Battery Test Chambers Volume (K), by Application 2024 & 2032
- Figure 5: North America Automotive Battery Test Chambers Revenue Share (%), by Application 2024 & 2032
- Figure 6: North America Automotive Battery Test Chambers Volume Share (%), by Application 2024 & 2032
- Figure 7: North America Automotive Battery Test Chambers Revenue (million), by Type 2024 & 2032
- Figure 8: North America Automotive Battery Test Chambers Volume (K), by Type 2024 & 2032
- Figure 9: North America Automotive Battery Test Chambers Revenue Share (%), by Type 2024 & 2032
- Figure 10: North America Automotive Battery Test Chambers Volume Share (%), by Type 2024 & 2032
- Figure 11: North America Automotive Battery Test Chambers Revenue (million), by Country 2024 & 2032
- Figure 12: North America Automotive Battery Test Chambers Volume (K), by Country 2024 & 2032
- Figure 13: North America Automotive Battery Test Chambers Revenue Share (%), by Country 2024 & 2032
- Figure 14: North America Automotive Battery Test Chambers Volume Share (%), by Country 2024 & 2032
- Figure 15: South America Automotive Battery Test Chambers Revenue (million), by Application 2024 & 2032
- Figure 16: South America Automotive Battery Test Chambers Volume (K), by Application 2024 & 2032
- Figure 17: South America Automotive Battery Test Chambers Revenue Share (%), by Application 2024 & 2032
- Figure 18: South America Automotive Battery Test Chambers Volume Share (%), by Application 2024 & 2032
- Figure 19: South America Automotive Battery Test Chambers Revenue (million), by Type 2024 & 2032
- Figure 20: South America Automotive Battery Test Chambers Volume (K), by Type 2024 & 2032
- Figure 21: South America Automotive Battery Test Chambers Revenue Share (%), by Type 2024 & 2032
- Figure 22: South America Automotive Battery Test Chambers Volume Share (%), by Type 2024 & 2032
- Figure 23: South America Automotive Battery Test Chambers Revenue (million), by Country 2024 & 2032
- Figure 24: South America Automotive Battery Test Chambers Volume (K), by Country 2024 & 2032
- Figure 25: South America Automotive Battery Test Chambers Revenue Share (%), by Country 2024 & 2032
- Figure 26: South America Automotive Battery Test Chambers Volume Share (%), by Country 2024 & 2032
- Figure 27: Europe Automotive Battery Test Chambers Revenue (million), by Application 2024 & 2032
- Figure 28: Europe Automotive Battery Test Chambers Volume (K), by Application 2024 & 2032
- Figure 29: Europe Automotive Battery Test Chambers Revenue Share (%), by Application 2024 & 2032
- Figure 30: Europe Automotive Battery Test Chambers Volume Share (%), by Application 2024 & 2032
- Figure 31: Europe Automotive Battery Test Chambers Revenue (million), by Type 2024 & 2032
- Figure 32: Europe Automotive Battery Test Chambers Volume (K), by Type 2024 & 2032
- Figure 33: Europe Automotive Battery Test Chambers Revenue Share (%), by Type 2024 & 2032
- Figure 34: Europe Automotive Battery Test Chambers Volume Share (%), by Type 2024 & 2032
- Figure 35: Europe Automotive Battery Test Chambers Revenue (million), by Country 2024 & 2032
- Figure 36: Europe Automotive Battery Test Chambers Volume (K), by Country 2024 & 2032
- Figure 37: Europe Automotive Battery Test Chambers Revenue Share (%), by Country 2024 & 2032
- Figure 38: Europe Automotive Battery Test Chambers Volume Share (%), by Country 2024 & 2032
- Figure 39: Middle East & Africa Automotive Battery Test Chambers Revenue (million), by Application 2024 & 2032
- Figure 40: Middle East & Africa Automotive Battery Test Chambers Volume (K), by Application 2024 & 2032
- Figure 41: Middle East & Africa Automotive Battery Test Chambers Revenue Share (%), by Application 2024 & 2032
- Figure 42: Middle East & Africa Automotive Battery Test Chambers Volume Share (%), by Application 2024 & 2032
- Figure 43: Middle East & Africa Automotive Battery Test Chambers Revenue (million), by Type 2024 & 2032
- Figure 44: Middle East & Africa Automotive Battery Test Chambers Volume (K), by Type 2024 & 2032
- Figure 45: Middle East & Africa Automotive Battery Test Chambers Revenue Share (%), by Type 2024 & 2032
- Figure 46: Middle East & Africa Automotive Battery Test Chambers Volume Share (%), by Type 2024 & 2032
- Figure 47: Middle East & Africa Automotive Battery Test Chambers Revenue (million), by Country 2024 & 2032
- Figure 48: Middle East & Africa Automotive Battery Test Chambers Volume (K), by Country 2024 & 2032
- Figure 49: Middle East & Africa Automotive Battery Test Chambers Revenue Share (%), by Country 2024 & 2032
- Figure 50: Middle East & Africa Automotive Battery Test Chambers Volume Share (%), by Country 2024 & 2032
- Figure 51: Asia Pacific Automotive Battery Test Chambers Revenue (million), by Application 2024 & 2032
- Figure 52: Asia Pacific Automotive Battery Test Chambers Volume (K), by Application 2024 & 2032
- Figure 53: Asia Pacific Automotive Battery Test Chambers Revenue Share (%), by Application 2024 & 2032
- Figure 54: Asia Pacific Automotive Battery Test Chambers Volume Share (%), by Application 2024 & 2032
- Figure 55: Asia Pacific Automotive Battery Test Chambers Revenue (million), by Type 2024 & 2032
- Figure 56: Asia Pacific Automotive Battery Test Chambers Volume (K), by Type 2024 & 2032
- Figure 57: Asia Pacific Automotive Battery Test Chambers Revenue Share (%), by Type 2024 & 2032
- Figure 58: Asia Pacific Automotive Battery Test Chambers Volume Share (%), by Type 2024 & 2032
- Figure 59: Asia Pacific Automotive Battery Test Chambers Revenue (million), by Country 2024 & 2032
- Figure 60: Asia Pacific Automotive Battery Test Chambers Volume (K), by Country 2024 & 2032
- Figure 61: Asia Pacific Automotive Battery Test Chambers Revenue Share (%), by Country 2024 & 2032
- Figure 62: Asia Pacific Automotive Battery Test Chambers Volume Share (%), by Country 2024 & 2032
List of Tables
- Table 1: Global Automotive Battery Test Chambers Revenue million Forecast, by Region 2019 & 2032
- Table 2: Global Automotive Battery Test Chambers Volume K Forecast, by Region 2019 & 2032
- Table 3: Global Automotive Battery Test Chambers Revenue million Forecast, by Application 2019 & 2032
- Table 4: Global Automotive Battery Test Chambers Volume K Forecast, by Application 2019 & 2032
- Table 5: Global Automotive Battery Test Chambers Revenue million Forecast, by Type 2019 & 2032
- Table 6: Global Automotive Battery Test Chambers Volume K Forecast, by Type 2019 & 2032
- Table 7: Global Automotive Battery Test Chambers Revenue million Forecast, by Region 2019 & 2032
- Table 8: Global Automotive Battery Test Chambers Volume K Forecast, by Region 2019 & 2032
- Table 9: Global Automotive Battery Test Chambers Revenue million Forecast, by Application 2019 & 2032
- Table 10: Global Automotive Battery Test Chambers Volume K Forecast, by Application 2019 & 2032
- Table 11: Global Automotive Battery Test Chambers Revenue million Forecast, by Type 2019 & 2032
- Table 12: Global Automotive Battery Test Chambers Volume K Forecast, by Type 2019 & 2032
- Table 13: Global Automotive Battery Test Chambers Revenue million Forecast, by Country 2019 & 2032
- Table 14: Global Automotive Battery Test Chambers Volume K Forecast, by Country 2019 & 2032
- Table 15: United States Automotive Battery Test Chambers Revenue (million) Forecast, by Application 2019 & 2032
- Table 16: United States Automotive Battery Test Chambers Volume (K) Forecast, by Application 2019 & 2032
- Table 17: Canada Automotive Battery Test Chambers Revenue (million) Forecast, by Application 2019 & 2032
- Table 18: Canada Automotive Battery Test Chambers Volume (K) Forecast, by Application 2019 & 2032
- Table 19: Mexico Automotive Battery Test Chambers Revenue (million) Forecast, by Application 2019 & 2032
- Table 20: Mexico Automotive Battery Test Chambers Volume (K) Forecast, by Application 2019 & 2032
- Table 21: Global Automotive Battery Test Chambers Revenue million Forecast, by Application 2019 & 2032
- Table 22: Global Automotive Battery Test Chambers Volume K Forecast, by Application 2019 & 2032
- Table 23: Global Automotive Battery Test Chambers Revenue million Forecast, by Type 2019 & 2032
- Table 24: Global Automotive Battery Test Chambers Volume K Forecast, by Type 2019 & 2032
- Table 25: Global Automotive Battery Test Chambers Revenue million Forecast, by Country 2019 & 2032
- Table 26: Global Automotive Battery Test Chambers Volume K Forecast, by Country 2019 & 2032
- Table 27: Brazil Automotive Battery Test Chambers Revenue (million) Forecast, by Application 2019 & 2032
- Table 28: Brazil Automotive Battery Test Chambers Volume (K) Forecast, by Application 2019 & 2032
- Table 29: Argentina Automotive Battery Test Chambers Revenue (million) Forecast, by Application 2019 & 2032
- Table 30: Argentina Automotive Battery Test Chambers Volume (K) Forecast, by Application 2019 & 2032
- Table 31: Rest of South America Automotive Battery Test Chambers Revenue (million) Forecast, by Application 2019 & 2032
- Table 32: Rest of South America Automotive Battery Test Chambers Volume (K) Forecast, by Application 2019 & 2032
- Table 33: Global Automotive Battery Test Chambers Revenue million Forecast, by Application 2019 & 2032
- Table 34: Global Automotive Battery Test Chambers Volume K Forecast, by Application 2019 & 2032
- Table 35: Global Automotive Battery Test Chambers Revenue million Forecast, by Type 2019 & 2032
- Table 36: Global Automotive Battery Test Chambers Volume K Forecast, by Type 2019 & 2032
- Table 37: Global Automotive Battery Test Chambers Revenue million Forecast, by Country 2019 & 2032
- Table 38: Global Automotive Battery Test Chambers Volume K Forecast, by Country 2019 & 2032
- Table 39: United Kingdom Automotive Battery Test Chambers Revenue (million) Forecast, by Application 2019 & 2032
- Table 40: United Kingdom Automotive Battery Test Chambers Volume (K) Forecast, by Application 2019 & 2032
- Table 41: Germany Automotive Battery Test Chambers Revenue (million) Forecast, by Application 2019 & 2032
- Table 42: Germany Automotive Battery Test Chambers Volume (K) Forecast, by Application 2019 & 2032
- Table 43: France Automotive Battery Test Chambers Revenue (million) Forecast, by Application 2019 & 2032
- Table 44: France Automotive Battery Test Chambers Volume (K) Forecast, by Application 2019 & 2032
- Table 45: Italy Automotive Battery Test Chambers Revenue (million) Forecast, by Application 2019 & 2032
- Table 46: Italy Automotive Battery Test Chambers Volume (K) Forecast, by Application 2019 & 2032
- Table 47: Spain Automotive Battery Test Chambers Revenue (million) Forecast, by Application 2019 & 2032
- Table 48: Spain Automotive Battery Test Chambers Volume (K) Forecast, by Application 2019 & 2032
- Table 49: Russia Automotive Battery Test Chambers Revenue (million) Forecast, by Application 2019 & 2032
- Table 50: Russia Automotive Battery Test Chambers Volume (K) Forecast, by Application 2019 & 2032
- Table 51: Benelux Automotive Battery Test Chambers Revenue (million) Forecast, by Application 2019 & 2032
- Table 52: Benelux Automotive Battery Test Chambers Volume (K) Forecast, by Application 2019 & 2032
- Table 53: Nordics Automotive Battery Test Chambers Revenue (million) Forecast, by Application 2019 & 2032
- Table 54: Nordics Automotive Battery Test Chambers Volume (K) Forecast, by Application 2019 & 2032
- Table 55: Rest of Europe Automotive Battery Test Chambers Revenue (million) Forecast, by Application 2019 & 2032
- Table 56: Rest of Europe Automotive Battery Test Chambers Volume (K) Forecast, by Application 2019 & 2032
- Table 57: Global Automotive Battery Test Chambers Revenue million Forecast, by Application 2019 & 2032
- Table 58: Global Automotive Battery Test Chambers Volume K Forecast, by Application 2019 & 2032
- Table 59: Global Automotive Battery Test Chambers Revenue million Forecast, by Type 2019 & 2032
- Table 60: Global Automotive Battery Test Chambers Volume K Forecast, by Type 2019 & 2032
- Table 61: Global Automotive Battery Test Chambers Revenue million Forecast, by Country 2019 & 2032
- Table 62: Global Automotive Battery Test Chambers Volume K Forecast, by Country 2019 & 2032
- Table 63: Turkey Automotive Battery Test Chambers Revenue (million) Forecast, by Application 2019 & 2032
- Table 64: Turkey Automotive Battery Test Chambers Volume (K) Forecast, by Application 2019 & 2032
- Table 65: Israel Automotive Battery Test Chambers Revenue (million) Forecast, by Application 2019 & 2032
- Table 66: Israel Automotive Battery Test Chambers Volume (K) Forecast, by Application 2019 & 2032
- Table 67: GCC Automotive Battery Test Chambers Revenue (million) Forecast, by Application 2019 & 2032
- Table 68: GCC Automotive Battery Test Chambers Volume (K) Forecast, by Application 2019 & 2032
- Table 69: North Africa Automotive Battery Test Chambers Revenue (million) Forecast, by Application 2019 & 2032
- Table 70: North Africa Automotive Battery Test Chambers Volume (K) Forecast, by Application 2019 & 2032
- Table 71: South Africa Automotive Battery Test Chambers Revenue (million) Forecast, by Application 2019 & 2032
- Table 72: South Africa Automotive Battery Test Chambers Volume (K) Forecast, by Application 2019 & 2032
- Table 73: Rest of Middle East & Africa Automotive Battery Test Chambers Revenue (million) Forecast, by Application 2019 & 2032
- Table 74: Rest of Middle East & Africa Automotive Battery Test Chambers Volume (K) Forecast, by Application 2019 & 2032
- Table 75: Global Automotive Battery Test Chambers Revenue million Forecast, by Application 2019 & 2032
- Table 76: Global Automotive Battery Test Chambers Volume K Forecast, by Application 2019 & 2032
- Table 77: Global Automotive Battery Test Chambers Revenue million Forecast, by Type 2019 & 2032
- Table 78: Global Automotive Battery Test Chambers Volume K Forecast, by Type 2019 & 2032
- Table 79: Global Automotive Battery Test Chambers Revenue million Forecast, by Country 2019 & 2032
- Table 80: Global Automotive Battery Test Chambers Volume K Forecast, by Country 2019 & 2032
- Table 81: China Automotive Battery Test Chambers Revenue (million) Forecast, by Application 2019 & 2032
- Table 82: China Automotive Battery Test Chambers Volume (K) Forecast, by Application 2019 & 2032
- Table 83: India Automotive Battery Test Chambers Revenue (million) Forecast, by Application 2019 & 2032
- Table 84: India Automotive Battery Test Chambers Volume (K) Forecast, by Application 2019 & 2032
- Table 85: Japan Automotive Battery Test Chambers Revenue (million) Forecast, by Application 2019 & 2032
- Table 86: Japan Automotive Battery Test Chambers Volume (K) Forecast, by Application 2019 & 2032
- Table 87: South Korea Automotive Battery Test Chambers Revenue (million) Forecast, by Application 2019 & 2032
- Table 88: South Korea Automotive Battery Test Chambers Volume (K) Forecast, by Application 2019 & 2032
- Table 89: ASEAN Automotive Battery Test Chambers Revenue (million) Forecast, by Application 2019 & 2032
- Table 90: ASEAN Automotive Battery Test Chambers Volume (K) Forecast, by Application 2019 & 2032
- Table 91: Oceania Automotive Battery Test Chambers Revenue (million) Forecast, by Application 2019 & 2032
- Table 92: Oceania Automotive Battery Test Chambers Volume (K) Forecast, by Application 2019 & 2032
- Table 93: Rest of Asia Pacific Automotive Battery Test Chambers Revenue (million) Forecast, by Application 2019 & 2032
- Table 94: Rest of Asia Pacific Automotive Battery Test Chambers Volume (K) Forecast, by Application 2019 & 2032
Frequently Asked Questions
1. What is the projected Compound Annual Growth Rate (CAGR) of the Automotive Battery Test Chambers?
The projected CAGR is approximately XXX%.
2. Which companies are prominent players in the Automotive Battery Test Chambers?
Key companies in the market include ESPEC, Weiss Technik, Thermotron, Angelantoni, CTS, Suga Test Instruments, TPS, Binder, Climats, Associated Environmental Systems, Russells Technical Products, CME, EQUILAM, Presto Testing Instruments, Xiamen Tmax, Chroma Systems Solutions, Megger, Chauvin Arnoux, Arbin Instruments, Century Yuasa Batteries, TENMARS ELECTRONIC, Midtronics, TOMILO, Suzhou Sushi Testing Group, Envsin, Chongqing Yinhe Testing Instrument, DOAHO Testing Equipment, Chongqing ATEC Technology, GWS Environmental Equipment.
3. What are the main segments of the Automotive Battery Test Chambers?
The market segments include Application, Type.
4. Can you provide details about the market size?
The market size is estimated to be USD XXX million as of 2022.
5. What are some drivers contributing to market growth?
N/A
6. What are the notable trends driving market growth?
N/A
7. Are there any restraints impacting market growth?
N/A
8. Can you provide examples of recent developments in the market?
N/A
9. What pricing options are available for accessing the report?
Pricing options include single-user, multi-user, and enterprise licenses priced at USD 3950.00, USD 5925.00, and USD 7900.00 respectively.
10. Is the market size provided in terms of value or volume?
The market size is provided in terms of value, measured in million and volume, measured in K.
11. Are there any specific market keywords associated with the report?
Yes, the market keyword associated with the report is "Automotive Battery Test Chambers," which aids in identifying and referencing the specific market segment covered.
12. How do I determine which pricing option suits my needs best?
The pricing options vary based on user requirements and access needs. Individual users may opt for single-user licenses, while businesses requiring broader access may choose multi-user or enterprise licenses for cost-effective access to the report.
13. Are there any additional resources or data provided in the Automotive Battery Test Chambers report?
While the report offers comprehensive insights, it's advisable to review the specific contents or supplementary materials provided to ascertain if additional resources or data are available.
14. How can I stay updated on further developments or reports in the Automotive Battery Test Chambers?
To stay informed about further developments, trends, and reports in the Automotive Battery Test Chambers, consider subscribing to industry newsletters, following relevant companies and organizations, or regularly checking reputable industry news sources and publications.
Methodology
Step 1 - Identification of Relevant Samples Size from Population Database


Step 2 - Approaches for Defining Global Market Size (Value, Volume* & Price*)

Note*: In applicable scenarios
Step 3 - Data Sources
Primary Research
- Web Analytics
- Survey Reports
- Research Institute
- Latest Research Reports
- Opinion Leaders
Secondary Research
- Annual Reports
- White Paper
- Latest Press Release
- Industry Association
- Paid Database
- Investor Presentations

Step 4 - Data Triangulation
Involves using different sources of information in order to increase the validity of a study
These sources are likely to be stakeholders in a program - participants, other researchers, program staff, other community members, and so on.
Then we put all data in single framework & apply various statistical tools to find out the dynamic on the market.
During the analysis stage, feedback from the stakeholder groups would be compared to determine areas of agreement as well as areas of divergence


