

Key Insights
The automotive polymer composites market is experiencing robust growth, driven by the increasing demand for lightweight vehicles to improve fuel efficiency and reduce carbon emissions. A compound annual growth rate (CAGR) exceeding 5% from 2019 to 2033 indicates a significant expansion of this market, projected to reach a substantial value. This growth is fueled by several key factors. The automotive industry's ongoing shift towards electric vehicles (EVs) presents a significant opportunity, as polymer composites offer advantages in battery packaging and overall vehicle weight reduction. Furthermore, advancements in materials science are leading to the development of stronger, lighter, and more cost-effective polymer composites, expanding their applications in various vehicle components, including body panels, bumpers, and interior parts. The rising adoption of advanced driver-assistance systems (ADAS) also contributes to market growth, as these systems often require lightweight and durable components. Regional variations exist, with North America and Europe currently holding significant market shares, but the Asia-Pacific region is expected to witness rapid growth due to increasing automotive production in countries like China and India.
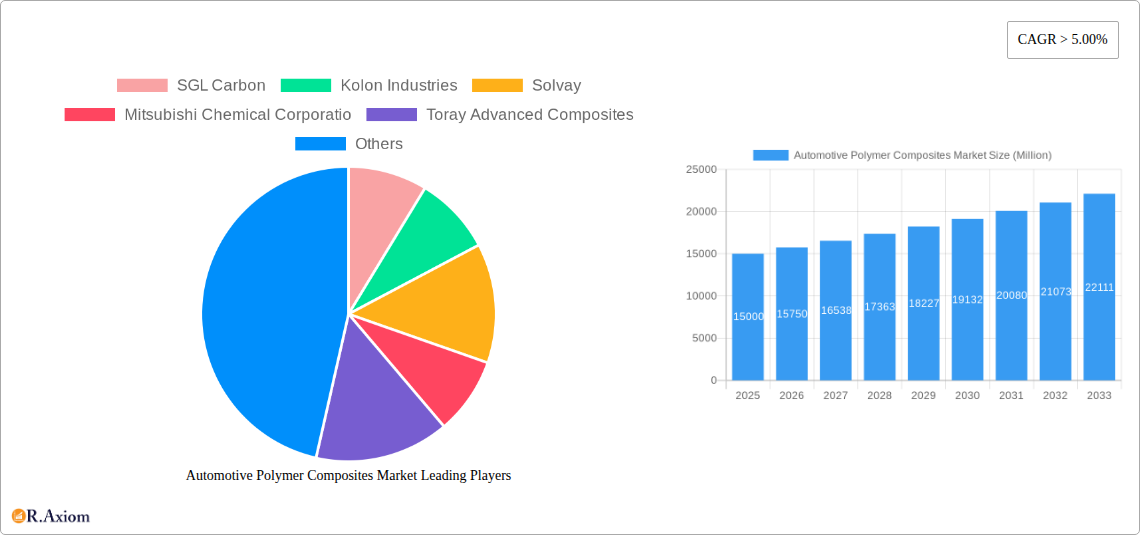
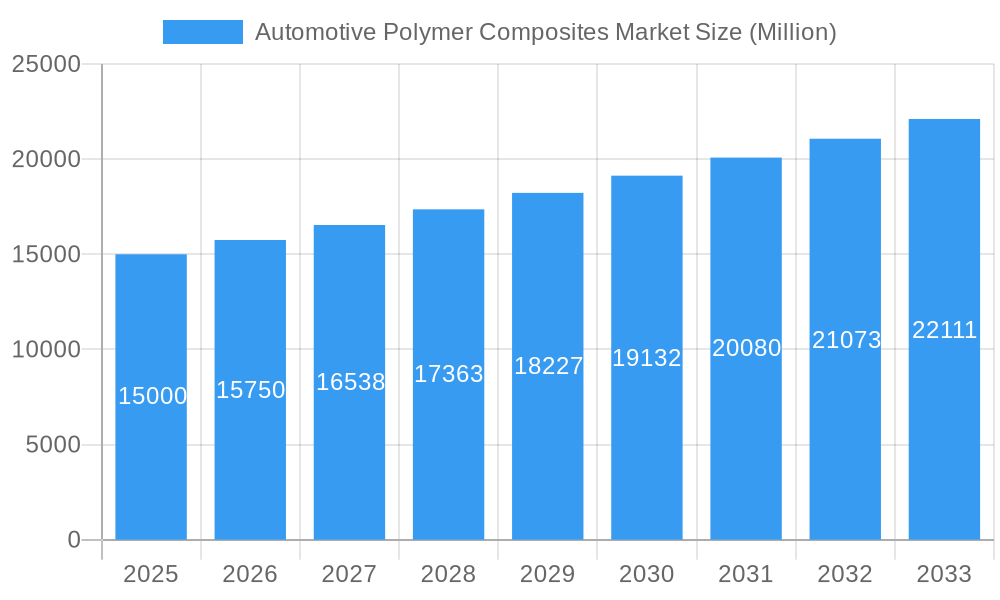
Automotive Polymer Composites Market Market Size (In Billion)
However, the market faces certain challenges. Fluctuations in raw material prices, particularly for resins like polypropylene and polyurethanes, can impact profitability. Stringent regulatory compliance requirements related to material safety and environmental impact also pose a constraint. Despite these hurdles, the long-term outlook for the automotive polymer composites market remains positive. Continuous innovation in material formulations, manufacturing processes, and design optimization will drive further market penetration and expansion across diverse vehicle segments, including passenger cars, light commercial vehicles, and trucks and buses. Key players in the market are focusing on strategic partnerships, collaborations, and research & development initiatives to solidify their market position and capitalize on emerging trends. The market's segmentation by resin type and vehicle type reflects the diversity of applications and the opportunities for specialized solutions. The continued push for sustainable and efficient transportation solutions will be a critical driver of market expansion in the coming years.
Automotive Polymer Composites Market Company Market Share
This comprehensive report provides an in-depth analysis of the global Automotive Polymer Composites Market, offering valuable insights for industry stakeholders, investors, and strategic decision-makers. The study covers the period from 2019 to 2033, with 2025 serving as the base and estimated year. The report meticulously examines market trends, growth drivers, challenges, and opportunities, providing a detailed segmentation analysis across resin types and vehicle types. Forecast data extends from 2025 to 2033, offering a clear view of future market dynamics.
Automotive Polymer Composites Market Concentration & Innovation
This section analyzes the competitive landscape of the automotive polymer composites market, examining market concentration, innovation drivers, regulatory frameworks, and key industry dynamics. We delve into the impact of mergers and acquisitions (M&A) activities, exploring deal values and their influence on market share distribution. The report assesses the role of technological advancements, regulatory changes, and evolving consumer preferences in shaping market competition. Specific metrics such as market share held by leading players (e.g., SGL Carbon holding xx% market share in 2025) and M&A deal values (e.g., a total of $xx Million in M&A deals in 2024) are provided to illustrate market concentration and dynamism. The analysis includes a detailed discussion of substitute materials and their impact on market growth, considering factors such as cost-effectiveness, performance characteristics, and environmental impact. Finally, the section examines end-user trends, focusing on shifts in demand across various vehicle types and the influence of these trends on market segmentation.
Automotive Polymer Composites Market Industry Trends & Insights
This section offers a detailed examination of the key trends and insights shaping the automotive polymer composites market. The analysis explores the market's Compound Annual Growth Rate (CAGR) during the historical period (2019-2024) and the projected CAGR for the forecast period (2025-2033), highlighting periods of accelerated or decelerated growth. We delve into the driving forces behind market expansion, such as the increasing demand for lightweight vehicles to improve fuel efficiency and reduce emissions. The report also assesses technological disruptions, such as the adoption of advanced materials and manufacturing processes, and their impact on market dynamics. Consumer preferences for enhanced vehicle safety, durability, and aesthetics are examined in detail, assessing their influence on material selection and market demand. The competitive landscape is analyzed, focusing on the strategies employed by key players to maintain their market positions and gain a competitive advantage. Specific examples of technological disruptions and their market penetration rates are included. For example, the adoption of carbon fiber reinforced polymers (CFRP) is expected to reach xx% market penetration by 2033.
Dominant Markets & Segments in Automotive Polymer Composites Market
This section identifies the leading regions, countries, and segments within the automotive polymer composites market. A detailed dominance analysis is performed for each segment, identifying key drivers of growth in each region and segment.
Leading Regions/Countries: [Analysis of regional dominance, including market size and growth drivers for key regions like North America, Europe, Asia-Pacific, etc. This will include details on economic policies, infrastructure development, and government regulations that influence market growth. For example, the strong automotive manufacturing base in Asia-Pacific is expected to drive the market growth of xx Million in 2033].
Dominant Resin Types:
- Polypropylene: [Detailed analysis of polypropylene market dominance, highlighting key drivers like cost-effectiveness and ease of processing. Growth projections for the forecast period are also provided.]
- Polyurethanes: [Analysis of polyurethane market share and growth drivers, such as their excellent shock absorption properties. Market size and future trends are discussed.]
- Other dominant resin types: [Similar analysis for other dominant resin types like Nylon, Polyvinyl Chloride, ABS, Polyethylenes, Polycarbonate, and Others Resins Type (Polyetheretherketone, Polyester, etc.) will follow. Growth projections for the period from 2025 to 2033 will be included.]
Dominant Vehicle Types:
- Passenger Cars: [Analysis of passenger car segment dominance, highlighting its large market size and growth drivers, such as the increasing demand for fuel-efficient vehicles.]
- Light Commercial Vehicles: [Analysis of light commercial vehicle segment, including market size and growth drivers.]
- Other dominant vehicle types: [Similar analysis for other dominant vehicle types such as Trucks and Buses, and Other Vehicle Types (Sports Cars, Specialty Vehicles, etc.)]
Automotive Polymer Composites Market Product Developments
The automotive polymer composites market is witnessing significant product innovations, driven by the need for lightweight, high-strength, and cost-effective materials. New composite materials are being developed with enhanced properties, such as improved durability, impact resistance, and thermal stability. These advancements are leading to the development of new applications, including the use of composites in structural components, body panels, and interior trims. The competitive landscape is characterized by intense innovation, with companies striving to develop unique composite materials and manufacturing processes to gain a competitive edge. These advancements are enhancing the market fit of automotive polymer composites by enabling greater design flexibility and improved vehicle performance.
Report Scope & Segmentation Analysis
This report provides a comprehensive segmentation analysis of the automotive polymer composites market based on resin type and vehicle type. The resin type segment includes Polypropylene, Polyurethanes, Nylon, Polyvinyl Chloride, ABS, Polyethylenes, Polycarbonate, and Others (Polyetheretherketone, Polyester, etc.). Each segment’s market size, growth projections (2025-2033), and competitive dynamics are analyzed. The vehicle type segment encompasses Passenger Cars, Light Commercial Vehicles, Trucks and Buses, and Other Vehicle Types (Sports Cars, Specialty Vehicles, etc.). Each segment is analyzed based on its market size, growth potential, and competitive landscape. Growth projections for each segment are included for the forecast period.
Key Drivers of Automotive Polymer Composites Market Growth
The growth of the automotive polymer composites market is driven by several factors. The increasing demand for lightweight vehicles to improve fuel efficiency and reduce emissions is a key driver. Stringent government regulations promoting fuel economy and reducing carbon footprints are further accelerating market growth. Technological advancements in composite materials and manufacturing processes are enabling the development of high-performance, cost-effective composites, contributing to market expansion. Moreover, the rising demand for enhanced vehicle safety and durability is driving the adoption of polymer composites in various vehicle applications.
Challenges in the Automotive Polymer Composites Market Sector
The automotive polymer composites market faces several challenges. High raw material costs and price volatility can negatively impact profitability. Supply chain disruptions can lead to production delays and increased costs. Intense competition among manufacturers necessitates continuous innovation and cost optimization strategies. Furthermore, regulatory hurdles and evolving environmental regulations present challenges for manufacturers. For example, xx% increase in raw material cost from 2024-2025 impacted the profit margins by xx% in 2025.
Emerging Opportunities in Automotive Polymer Composites Market
Several emerging opportunities exist in the automotive polymer composites market. The growing adoption of electric vehicles (EVs) presents significant opportunities for lightweight composite materials, as they can help to extend the range of EVs. Advancements in composite material technology are creating opportunities for new applications, such as in structural components and battery enclosures. The increasing demand for customized and personalized vehicles is creating opportunities for manufacturers to develop specialized composite materials and solutions. New markets in developing economies also offer significant growth potential.
Leading Players in the Automotive Polymer Composites Market Market
- SGL Carbon
- Kolon Industries
- Solvay
- Mitsubishi Chemical Corporation
- Toray Advanced Composites
- Teijin Carbon
- Gurit Services AG
- UFP Technologies Inc
- Owens Corning
- BASF SE
- Plasan Sasa Ltd
- DuPont
- Hexcel Corporation
- Covestro AG
- Johns Manville
- Pyrophobic Systems Ltd
Key Developments in Automotive Polymer Composites Market Industry
- Jan 2024: Company X launched a new lightweight composite material for electric vehicle applications.
- March 2024: Company Y and Company Z announced a strategic partnership to develop advanced composite manufacturing technologies.
- June 2025: New regulations on vehicle emissions were implemented, driving demand for lightweight composite materials.
- [Add more bullet points with specific years/months and impacts on market dynamics]
Strategic Outlook for Automotive Polymer Composites Market Market
The automotive polymer composites market is poised for significant growth in the coming years. The continued demand for lightweight, fuel-efficient vehicles, coupled with technological advancements in composite materials, will drive market expansion. Emerging opportunities in electric vehicles and other niche applications will further fuel market growth. Companies focusing on innovation, strategic partnerships, and efficient supply chain management are expected to gain a competitive advantage. The market is expected to experience sustained growth, reaching an estimated value of xx Million by 2033, driven by factors such as increasing demand for lightweight vehicles and technological advancements.
Automotive Polymer Composites Market Segmentation
-
1. Resin Type
- 1.1. Polypropylene
- 1.2. Polyurethanes
- 1.3. Nylon
- 1.4. Polyvinyl Chloride
- 1.5. ABS
- 1.6. Polyethylenes
- 1.7. Polycarbonate
- 1.8. Others
-
2. Vehicle Type
- 2.1. Passenger Cars
- 2.2. Light Commercial Vehicles
- 2.3. Trucks and Buses
- 2.4. Other
Automotive Polymer Composites Market Segmentation By Geography
-
1. Asia Pacific
- 1.1. China
- 1.2. India
- 1.3. Japan
- 1.4. South Korea
- 1.5. Malaysia
- 1.6. Thailand
- 1.7. Indonesia
- 1.8. Vietnam
- 1.9. Rest of Asia Pacific
-
2. North America
- 2.1. United States
- 2.2. Canada
- 2.3. Mexico
-
3. Europe
- 3.1. United Kingdom
- 3.2. France
- 3.3. Germany
- 3.4. Italy
- 3.5. Spain
- 3.6. NORDIC Countries
- 3.7. Turkey
- 3.8. Russia
- 3.9. Rest of Europe
-
4. South America
- 4.1. Brazil
- 4.2. Argentina
- 4.3. Colombia
- 4.4. Rest of South America
-
5. Middle East and Africa
- 5.1. Morocco
- 5.2. South Africa
- 5.3. Nigeria
- 5.4. Qatar
- 5.5. Egypt
- 5.6. UAE
- 5.7. Rest of Middle East and Africa
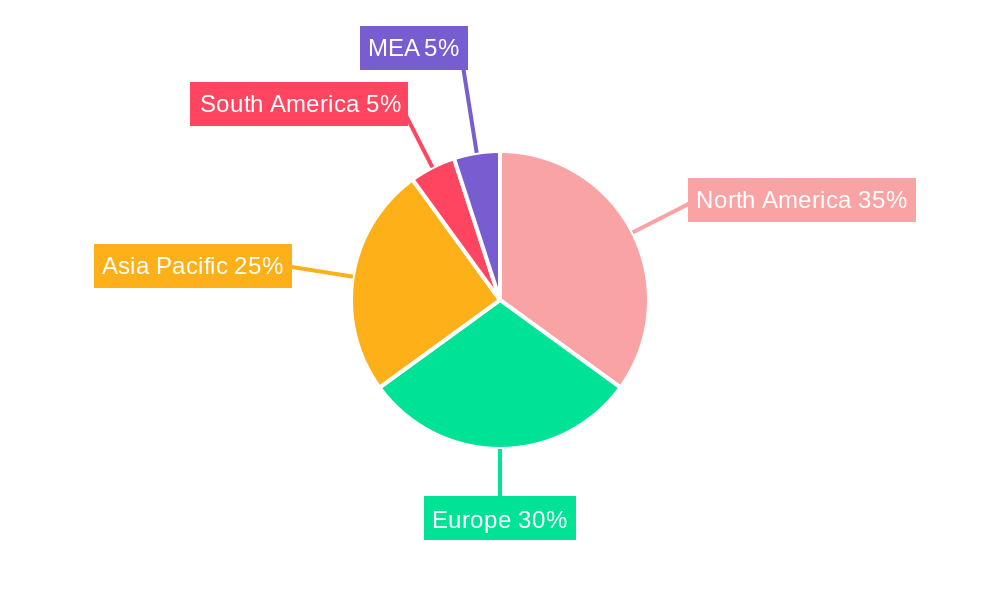
Automotive Polymer Composites Market Regional Market Share
Geographic Coverage of Automotive Polymer Composites Market
Automotive Polymer Composites Market REPORT HIGHLIGHTS
| Aspects | Details |
|---|---|
| Study Period | 2020-2034 |
| Base Year | 2025 |
| Estimated Year | 2026 |
| Forecast Period | 2026-2034 |
| Historical Period | 2020-2025 |
| Growth Rate | CAGR of > 5.00% from 2020-2034 |
| Segmentation |
|
Table of Contents
- 1. Introduction
- 1.1. Research Scope
- 1.2. Market Segmentation
- 1.3. Research Objective
- 1.4. Definitions and Assumptions
- 2. Executive Summary
- 2.1. Market Snapshot
- 3. Market Dynamics
- 3.1. Market Drivers
- 3.2. Market Restrains
- 3.3. Market Trends
- 3.4. Market Opportunities
- 4. Market Factor Analysis
- 4.1. Porters Five Forces
- 4.1.1. Bargaining Power of Suppliers
- 4.1.2. Bargaining Power of Buyers
- 4.1.3. Threat of New Entrants
- 4.1.4. Threat of Substitutes
- 4.1.5. Competitive Rivalry
- 4.2. PESTEL analysis
- 4.3. BCG Analysis
- 4.3.1. Stars (High Growth, High Market Share)
- 4.3.2. Cash Cows (Low Growth, High Market Share)
- 4.3.3. Question Mark (High Growth, Low Market Share)
- 4.3.4. Dogs (Low Growth, Low Market Share)
- 4.4. Ansoff Matrix Analysis
- 4.5. Supply Chain Analysis
- 4.6. Regulatory Landscape
- 4.7. Current Market Potential and Opportunity Assessment (TAM–SAM–SOM Framework)
- 4.8. RAX Analyst Note
- 4.1. Porters Five Forces
- 5. Market Analysis, Insights and Forecast 2021-2033
- 5.1. Market Analysis, Insights and Forecast - by Resin Type
- 5.1.1. Polypropylene
- 5.1.2. Polyurethanes
- 5.1.3. Nylon
- 5.1.4. Polyvinyl Chloride
- 5.1.5. ABS
- 5.1.6. Polyethylenes
- 5.1.7. Polycarbonate
- 5.1.8. Others
- 5.2. Market Analysis, Insights and Forecast - by Vehicle Type
- 5.2.1. Passenger Cars
- 5.2.2. Light Commercial Vehicles
- 5.2.3. Trucks and Buses
- 5.2.4. Other
- 5.3. Market Analysis, Insights and Forecast - by Region
- 5.3.1. Asia Pacific
- 5.3.2. North America
- 5.3.3. Europe
- 5.3.4. South America
- 5.3.5. Middle East and Africa
- 5.1. Market Analysis, Insights and Forecast - by Resin Type
- 6. Global Automotive Polymer Composites Market Analysis, Insights and Forecast, 2021-2033
- 6.1. Market Analysis, Insights and Forecast - by Resin Type
- 6.1.1. Polypropylene
- 6.1.2. Polyurethanes
- 6.1.3. Nylon
- 6.1.4. Polyvinyl Chloride
- 6.1.5. ABS
- 6.1.6. Polyethylenes
- 6.1.7. Polycarbonate
- 6.1.8. Others
- 6.2. Market Analysis, Insights and Forecast - by Vehicle Type
- 6.2.1. Passenger Cars
- 6.2.2. Light Commercial Vehicles
- 6.2.3. Trucks and Buses
- 6.2.4. Other
- 6.1. Market Analysis, Insights and Forecast - by Resin Type
- 7. Asia Pacific Automotive Polymer Composites Market Analysis, Insights and Forecast, 2020-2032
- 7.1. Market Analysis, Insights and Forecast - by Resin Type
- 7.1.1. Polypropylene
- 7.1.2. Polyurethanes
- 7.1.3. Nylon
- 7.1.4. Polyvinyl Chloride
- 7.1.5. ABS
- 7.1.6. Polyethylenes
- 7.1.7. Polycarbonate
- 7.1.8. Others
- 7.2. Market Analysis, Insights and Forecast - by Vehicle Type
- 7.2.1. Passenger Cars
- 7.2.2. Light Commercial Vehicles
- 7.2.3. Trucks and Buses
- 7.2.4. Other
- 7.1. Market Analysis, Insights and Forecast - by Resin Type
- 8. North America Automotive Polymer Composites Market Analysis, Insights and Forecast, 2020-2032
- 8.1. Market Analysis, Insights and Forecast - by Resin Type
- 8.1.1. Polypropylene
- 8.1.2. Polyurethanes
- 8.1.3. Nylon
- 8.1.4. Polyvinyl Chloride
- 8.1.5. ABS
- 8.1.6. Polyethylenes
- 8.1.7. Polycarbonate
- 8.1.8. Others
- 8.2. Market Analysis, Insights and Forecast - by Vehicle Type
- 8.2.1. Passenger Cars
- 8.2.2. Light Commercial Vehicles
- 8.2.3. Trucks and Buses
- 8.2.4. Other
- 8.1. Market Analysis, Insights and Forecast - by Resin Type
- 9. Europe Automotive Polymer Composites Market Analysis, Insights and Forecast, 2020-2032
- 9.1. Market Analysis, Insights and Forecast - by Resin Type
- 9.1.1. Polypropylene
- 9.1.2. Polyurethanes
- 9.1.3. Nylon
- 9.1.4. Polyvinyl Chloride
- 9.1.5. ABS
- 9.1.6. Polyethylenes
- 9.1.7. Polycarbonate
- 9.1.8. Others
- 9.2. Market Analysis, Insights and Forecast - by Vehicle Type
- 9.2.1. Passenger Cars
- 9.2.2. Light Commercial Vehicles
- 9.2.3. Trucks and Buses
- 9.2.4. Other
- 9.1. Market Analysis, Insights and Forecast - by Resin Type
- 10. South America Automotive Polymer Composites Market Analysis, Insights and Forecast, 2020-2032
- 10.1. Market Analysis, Insights and Forecast - by Resin Type
- 10.1.1. Polypropylene
- 10.1.2. Polyurethanes
- 10.1.3. Nylon
- 10.1.4. Polyvinyl Chloride
- 10.1.5. ABS
- 10.1.6. Polyethylenes
- 10.1.7. Polycarbonate
- 10.1.8. Others
- 10.2. Market Analysis, Insights and Forecast - by Vehicle Type
- 10.2.1. Passenger Cars
- 10.2.2. Light Commercial Vehicles
- 10.2.3. Trucks and Buses
- 10.2.4. Other
- 10.1. Market Analysis, Insights and Forecast - by Resin Type
- 11. Middle East and Africa Automotive Polymer Composites Market Analysis, Insights and Forecast, 2020-2032
- 11.1. Market Analysis, Insights and Forecast - by Resin Type
- 11.1.1. Polypropylene
- 11.1.2. Polyurethanes
- 11.1.3. Nylon
- 11.1.4. Polyvinyl Chloride
- 11.1.5. ABS
- 11.1.6. Polyethylenes
- 11.1.7. Polycarbonate
- 11.1.8. Others
- 11.2. Market Analysis, Insights and Forecast - by Vehicle Type
- 11.2.1. Passenger Cars
- 11.2.2. Light Commercial Vehicles
- 11.2.3. Trucks and Buses
- 11.2.4. Other
- 11.1. Market Analysis, Insights and Forecast - by Resin Type
- 12. Competitive Analysis
- 12.1. Company Profiles
- 12.1.1 SGL Carbon
- 12.1.1.1. Company Overview
- 12.1.1.2. Products
- 12.1.1.3. Company Financials
- 12.1.1.4. SWOT Analysis
- 12.1.2 Kolon Industries
- 12.1.2.1. Company Overview
- 12.1.2.2. Products
- 12.1.2.3. Company Financials
- 12.1.2.4. SWOT Analysis
- 12.1.3 Solvay
- 12.1.3.1. Company Overview
- 12.1.3.2. Products
- 12.1.3.3. Company Financials
- 12.1.3.4. SWOT Analysis
- 12.1.4 Mitsubishi Chemical Corporatio
- 12.1.4.1. Company Overview
- 12.1.4.2. Products
- 12.1.4.3. Company Financials
- 12.1.4.4. SWOT Analysis
- 12.1.5 Toray Advanced Composites
- 12.1.5.1. Company Overview
- 12.1.5.2. Products
- 12.1.5.3. Company Financials
- 12.1.5.4. SWOT Analysis
- 12.1.6 Teijin Carbon
- 12.1.6.1. Company Overview
- 12.1.6.2. Products
- 12.1.6.3. Company Financials
- 12.1.6.4. SWOT Analysis
- 12.1.7 Gurit Services AG
- 12.1.7.1. Company Overview
- 12.1.7.2. Products
- 12.1.7.3. Company Financials
- 12.1.7.4. SWOT Analysis
- 12.1.8 UFP Technologies Inc
- 12.1.8.1. Company Overview
- 12.1.8.2. Products
- 12.1.8.3. Company Financials
- 12.1.8.4. SWOT Analysis
- 12.1.9 Owens Corning
- 12.1.9.1. Company Overview
- 12.1.9.2. Products
- 12.1.9.3. Company Financials
- 12.1.9.4. SWOT Analysis
- 12.1.10 BASF SE
- 12.1.10.1. Company Overview
- 12.1.10.2. Products
- 12.1.10.3. Company Financials
- 12.1.10.4. SWOT Analysis
- 12.1.11 Plasan Sasa Ltd
- 12.1.11.1. Company Overview
- 12.1.11.2. Products
- 12.1.11.3. Company Financials
- 12.1.11.4. SWOT Analysis
- 12.1.12 DuPont
- 12.1.12.1. Company Overview
- 12.1.12.2. Products
- 12.1.12.3. Company Financials
- 12.1.12.4. SWOT Analysis
- 12.1.13 Hexcel Corporation
- 12.1.13.1. Company Overview
- 12.1.13.2. Products
- 12.1.13.3. Company Financials
- 12.1.13.4. SWOT Analysis
- 12.1.14 Covestro AG
- 12.1.14.1. Company Overview
- 12.1.14.2. Products
- 12.1.14.3. Company Financials
- 12.1.14.4. SWOT Analysis
- 12.1.15 Johns Manville
- 12.1.15.1. Company Overview
- 12.1.15.2. Products
- 12.1.15.3. Company Financials
- 12.1.15.4. SWOT Analysis
- 12.1.16 Pyrophobic Systems Ltd
- 12.1.16.1. Company Overview
- 12.1.16.2. Products
- 12.1.16.3. Company Financials
- 12.1.16.4. SWOT Analysis
- 12.1.1 SGL Carbon
- 12.2. Market Entropy
- 12.2.1 Company's Key Areas Served
- 12.2.2 Recent Developments
- 12.3. Company Market Share Analysis 2025
- 12.3.1 Top 5 Companies Market Share Analysis
- 12.3.2 Top 3 Companies Market Share Analysis
- 12.4. List of Potential Customers
- 13. Research Methodology
List of Figures
- Figure 1: Global Automotive Polymer Composites Market Revenue Breakdown (Million, %) by Region 2025 & 2033
- Figure 2: Global Automotive Polymer Composites Market Volume Breakdown (Million, %) by Region 2025 & 2033
- Figure 3: Asia Pacific Automotive Polymer Composites Market Revenue (Million), by Resin Type 2025 & 2033
- Figure 4: Asia Pacific Automotive Polymer Composites Market Volume (Million), by Resin Type 2025 & 2033
- Figure 5: Asia Pacific Automotive Polymer Composites Market Revenue Share (%), by Resin Type 2025 & 2033
- Figure 6: Asia Pacific Automotive Polymer Composites Market Volume Share (%), by Resin Type 2025 & 2033
- Figure 7: Asia Pacific Automotive Polymer Composites Market Revenue (Million), by Vehicle Type 2025 & 2033
- Figure 8: Asia Pacific Automotive Polymer Composites Market Volume (Million), by Vehicle Type 2025 & 2033
- Figure 9: Asia Pacific Automotive Polymer Composites Market Revenue Share (%), by Vehicle Type 2025 & 2033
- Figure 10: Asia Pacific Automotive Polymer Composites Market Volume Share (%), by Vehicle Type 2025 & 2033
- Figure 11: Asia Pacific Automotive Polymer Composites Market Revenue (Million), by Country 2025 & 2033
- Figure 12: Asia Pacific Automotive Polymer Composites Market Volume (Million), by Country 2025 & 2033
- Figure 13: Asia Pacific Automotive Polymer Composites Market Revenue Share (%), by Country 2025 & 2033
- Figure 14: Asia Pacific Automotive Polymer Composites Market Volume Share (%), by Country 2025 & 2033
- Figure 15: North America Automotive Polymer Composites Market Revenue (Million), by Resin Type 2025 & 2033
- Figure 16: North America Automotive Polymer Composites Market Volume (Million), by Resin Type 2025 & 2033
- Figure 17: North America Automotive Polymer Composites Market Revenue Share (%), by Resin Type 2025 & 2033
- Figure 18: North America Automotive Polymer Composites Market Volume Share (%), by Resin Type 2025 & 2033
- Figure 19: North America Automotive Polymer Composites Market Revenue (Million), by Vehicle Type 2025 & 2033
- Figure 20: North America Automotive Polymer Composites Market Volume (Million), by Vehicle Type 2025 & 2033
- Figure 21: North America Automotive Polymer Composites Market Revenue Share (%), by Vehicle Type 2025 & 2033
- Figure 22: North America Automotive Polymer Composites Market Volume Share (%), by Vehicle Type 2025 & 2033
- Figure 23: North America Automotive Polymer Composites Market Revenue (Million), by Country 2025 & 2033
- Figure 24: North America Automotive Polymer Composites Market Volume (Million), by Country 2025 & 2033
- Figure 25: North America Automotive Polymer Composites Market Revenue Share (%), by Country 2025 & 2033
- Figure 26: North America Automotive Polymer Composites Market Volume Share (%), by Country 2025 & 2033
- Figure 27: Europe Automotive Polymer Composites Market Revenue (Million), by Resin Type 2025 & 2033
- Figure 28: Europe Automotive Polymer Composites Market Volume (Million), by Resin Type 2025 & 2033
- Figure 29: Europe Automotive Polymer Composites Market Revenue Share (%), by Resin Type 2025 & 2033
- Figure 30: Europe Automotive Polymer Composites Market Volume Share (%), by Resin Type 2025 & 2033
- Figure 31: Europe Automotive Polymer Composites Market Revenue (Million), by Vehicle Type 2025 & 2033
- Figure 32: Europe Automotive Polymer Composites Market Volume (Million), by Vehicle Type 2025 & 2033
- Figure 33: Europe Automotive Polymer Composites Market Revenue Share (%), by Vehicle Type 2025 & 2033
- Figure 34: Europe Automotive Polymer Composites Market Volume Share (%), by Vehicle Type 2025 & 2033
- Figure 35: Europe Automotive Polymer Composites Market Revenue (Million), by Country 2025 & 2033
- Figure 36: Europe Automotive Polymer Composites Market Volume (Million), by Country 2025 & 2033
- Figure 37: Europe Automotive Polymer Composites Market Revenue Share (%), by Country 2025 & 2033
- Figure 38: Europe Automotive Polymer Composites Market Volume Share (%), by Country 2025 & 2033
- Figure 39: South America Automotive Polymer Composites Market Revenue (Million), by Resin Type 2025 & 2033
- Figure 40: South America Automotive Polymer Composites Market Volume (Million), by Resin Type 2025 & 2033
- Figure 41: South America Automotive Polymer Composites Market Revenue Share (%), by Resin Type 2025 & 2033
- Figure 42: South America Automotive Polymer Composites Market Volume Share (%), by Resin Type 2025 & 2033
- Figure 43: South America Automotive Polymer Composites Market Revenue (Million), by Vehicle Type 2025 & 2033
- Figure 44: South America Automotive Polymer Composites Market Volume (Million), by Vehicle Type 2025 & 2033
- Figure 45: South America Automotive Polymer Composites Market Revenue Share (%), by Vehicle Type 2025 & 2033
- Figure 46: South America Automotive Polymer Composites Market Volume Share (%), by Vehicle Type 2025 & 2033
- Figure 47: South America Automotive Polymer Composites Market Revenue (Million), by Country 2025 & 2033
- Figure 48: South America Automotive Polymer Composites Market Volume (Million), by Country 2025 & 2033
- Figure 49: South America Automotive Polymer Composites Market Revenue Share (%), by Country 2025 & 2033
- Figure 50: South America Automotive Polymer Composites Market Volume Share (%), by Country 2025 & 2033
- Figure 51: Middle East and Africa Automotive Polymer Composites Market Revenue (Million), by Resin Type 2025 & 2033
- Figure 52: Middle East and Africa Automotive Polymer Composites Market Volume (Million), by Resin Type 2025 & 2033
- Figure 53: Middle East and Africa Automotive Polymer Composites Market Revenue Share (%), by Resin Type 2025 & 2033
- Figure 54: Middle East and Africa Automotive Polymer Composites Market Volume Share (%), by Resin Type 2025 & 2033
- Figure 55: Middle East and Africa Automotive Polymer Composites Market Revenue (Million), by Vehicle Type 2025 & 2033
- Figure 56: Middle East and Africa Automotive Polymer Composites Market Volume (Million), by Vehicle Type 2025 & 2033
- Figure 57: Middle East and Africa Automotive Polymer Composites Market Revenue Share (%), by Vehicle Type 2025 & 2033
- Figure 58: Middle East and Africa Automotive Polymer Composites Market Volume Share (%), by Vehicle Type 2025 & 2033
- Figure 59: Middle East and Africa Automotive Polymer Composites Market Revenue (Million), by Country 2025 & 2033
- Figure 60: Middle East and Africa Automotive Polymer Composites Market Volume (Million), by Country 2025 & 2033
- Figure 61: Middle East and Africa Automotive Polymer Composites Market Revenue Share (%), by Country 2025 & 2033
- Figure 62: Middle East and Africa Automotive Polymer Composites Market Volume Share (%), by Country 2025 & 2033
List of Tables
- Table 1: Global Automotive Polymer Composites Market Revenue Million Forecast, by Resin Type 2020 & 2033
- Table 2: Global Automotive Polymer Composites Market Volume Million Forecast, by Resin Type 2020 & 2033
- Table 3: Global Automotive Polymer Composites Market Revenue Million Forecast, by Vehicle Type 2020 & 2033
- Table 4: Global Automotive Polymer Composites Market Volume Million Forecast, by Vehicle Type 2020 & 2033
- Table 5: Global Automotive Polymer Composites Market Revenue Million Forecast, by Region 2020 & 2033
- Table 6: Global Automotive Polymer Composites Market Volume Million Forecast, by Region 2020 & 2033
- Table 7: Global Automotive Polymer Composites Market Revenue Million Forecast, by Resin Type 2020 & 2033
- Table 8: Global Automotive Polymer Composites Market Volume Million Forecast, by Resin Type 2020 & 2033
- Table 9: Global Automotive Polymer Composites Market Revenue Million Forecast, by Vehicle Type 2020 & 2033
- Table 10: Global Automotive Polymer Composites Market Volume Million Forecast, by Vehicle Type 2020 & 2033
- Table 11: Global Automotive Polymer Composites Market Revenue Million Forecast, by Country 2020 & 2033
- Table 12: Global Automotive Polymer Composites Market Volume Million Forecast, by Country 2020 & 2033
- Table 13: China Automotive Polymer Composites Market Revenue (Million) Forecast, by Application 2020 & 2033
- Table 14: China Automotive Polymer Composites Market Volume (Million) Forecast, by Application 2020 & 2033
- Table 15: India Automotive Polymer Composites Market Revenue (Million) Forecast, by Application 2020 & 2033
- Table 16: India Automotive Polymer Composites Market Volume (Million) Forecast, by Application 2020 & 2033
- Table 17: Japan Automotive Polymer Composites Market Revenue (Million) Forecast, by Application 2020 & 2033
- Table 18: Japan Automotive Polymer Composites Market Volume (Million) Forecast, by Application 2020 & 2033
- Table 19: South Korea Automotive Polymer Composites Market Revenue (Million) Forecast, by Application 2020 & 2033
- Table 20: South Korea Automotive Polymer Composites Market Volume (Million) Forecast, by Application 2020 & 2033
- Table 21: Malaysia Automotive Polymer Composites Market Revenue (Million) Forecast, by Application 2020 & 2033
- Table 22: Malaysia Automotive Polymer Composites Market Volume (Million) Forecast, by Application 2020 & 2033
- Table 23: Thailand Automotive Polymer Composites Market Revenue (Million) Forecast, by Application 2020 & 2033
- Table 24: Thailand Automotive Polymer Composites Market Volume (Million) Forecast, by Application 2020 & 2033
- Table 25: Indonesia Automotive Polymer Composites Market Revenue (Million) Forecast, by Application 2020 & 2033
- Table 26: Indonesia Automotive Polymer Composites Market Volume (Million) Forecast, by Application 2020 & 2033
- Table 27: Vietnam Automotive Polymer Composites Market Revenue (Million) Forecast, by Application 2020 & 2033
- Table 28: Vietnam Automotive Polymer Composites Market Volume (Million) Forecast, by Application 2020 & 2033
- Table 29: Rest of Asia Pacific Automotive Polymer Composites Market Revenue (Million) Forecast, by Application 2020 & 2033
- Table 30: Rest of Asia Pacific Automotive Polymer Composites Market Volume (Million) Forecast, by Application 2020 & 2033
- Table 31: Global Automotive Polymer Composites Market Revenue Million Forecast, by Resin Type 2020 & 2033
- Table 32: Global Automotive Polymer Composites Market Volume Million Forecast, by Resin Type 2020 & 2033
- Table 33: Global Automotive Polymer Composites Market Revenue Million Forecast, by Vehicle Type 2020 & 2033
- Table 34: Global Automotive Polymer Composites Market Volume Million Forecast, by Vehicle Type 2020 & 2033
- Table 35: Global Automotive Polymer Composites Market Revenue Million Forecast, by Country 2020 & 2033
- Table 36: Global Automotive Polymer Composites Market Volume Million Forecast, by Country 2020 & 2033
- Table 37: United States Automotive Polymer Composites Market Revenue (Million) Forecast, by Application 2020 & 2033
- Table 38: United States Automotive Polymer Composites Market Volume (Million) Forecast, by Application 2020 & 2033
- Table 39: Canada Automotive Polymer Composites Market Revenue (Million) Forecast, by Application 2020 & 2033
- Table 40: Canada Automotive Polymer Composites Market Volume (Million) Forecast, by Application 2020 & 2033
- Table 41: Mexico Automotive Polymer Composites Market Revenue (Million) Forecast, by Application 2020 & 2033
- Table 42: Mexico Automotive Polymer Composites Market Volume (Million) Forecast, by Application 2020 & 2033
- Table 43: Global Automotive Polymer Composites Market Revenue Million Forecast, by Resin Type 2020 & 2033
- Table 44: Global Automotive Polymer Composites Market Volume Million Forecast, by Resin Type 2020 & 2033
- Table 45: Global Automotive Polymer Composites Market Revenue Million Forecast, by Vehicle Type 2020 & 2033
- Table 46: Global Automotive Polymer Composites Market Volume Million Forecast, by Vehicle Type 2020 & 2033
- Table 47: Global Automotive Polymer Composites Market Revenue Million Forecast, by Country 2020 & 2033
- Table 48: Global Automotive Polymer Composites Market Volume Million Forecast, by Country 2020 & 2033
- Table 49: United Kingdom Automotive Polymer Composites Market Revenue (Million) Forecast, by Application 2020 & 2033
- Table 50: United Kingdom Automotive Polymer Composites Market Volume (Million) Forecast, by Application 2020 & 2033
- Table 51: France Automotive Polymer Composites Market Revenue (Million) Forecast, by Application 2020 & 2033
- Table 52: France Automotive Polymer Composites Market Volume (Million) Forecast, by Application 2020 & 2033
- Table 53: Germany Automotive Polymer Composites Market Revenue (Million) Forecast, by Application 2020 & 2033
- Table 54: Germany Automotive Polymer Composites Market Volume (Million) Forecast, by Application 2020 & 2033
- Table 55: Italy Automotive Polymer Composites Market Revenue (Million) Forecast, by Application 2020 & 2033
- Table 56: Italy Automotive Polymer Composites Market Volume (Million) Forecast, by Application 2020 & 2033
- Table 57: Spain Automotive Polymer Composites Market Revenue (Million) Forecast, by Application 2020 & 2033
- Table 58: Spain Automotive Polymer Composites Market Volume (Million) Forecast, by Application 2020 & 2033
- Table 59: NORDIC Countries Automotive Polymer Composites Market Revenue (Million) Forecast, by Application 2020 & 2033
- Table 60: NORDIC Countries Automotive Polymer Composites Market Volume (Million) Forecast, by Application 2020 & 2033
- Table 61: Turkey Automotive Polymer Composites Market Revenue (Million) Forecast, by Application 2020 & 2033
- Table 62: Turkey Automotive Polymer Composites Market Volume (Million) Forecast, by Application 2020 & 2033
- Table 63: Russia Automotive Polymer Composites Market Revenue (Million) Forecast, by Application 2020 & 2033
- Table 64: Russia Automotive Polymer Composites Market Volume (Million) Forecast, by Application 2020 & 2033
- Table 65: Rest of Europe Automotive Polymer Composites Market Revenue (Million) Forecast, by Application 2020 & 2033
- Table 66: Rest of Europe Automotive Polymer Composites Market Volume (Million) Forecast, by Application 2020 & 2033
- Table 67: Global Automotive Polymer Composites Market Revenue Million Forecast, by Resin Type 2020 & 2033
- Table 68: Global Automotive Polymer Composites Market Volume Million Forecast, by Resin Type 2020 & 2033
- Table 69: Global Automotive Polymer Composites Market Revenue Million Forecast, by Vehicle Type 2020 & 2033
- Table 70: Global Automotive Polymer Composites Market Volume Million Forecast, by Vehicle Type 2020 & 2033
- Table 71: Global Automotive Polymer Composites Market Revenue Million Forecast, by Country 2020 & 2033
- Table 72: Global Automotive Polymer Composites Market Volume Million Forecast, by Country 2020 & 2033
- Table 73: Brazil Automotive Polymer Composites Market Revenue (Million) Forecast, by Application 2020 & 2033
- Table 74: Brazil Automotive Polymer Composites Market Volume (Million) Forecast, by Application 2020 & 2033
- Table 75: Argentina Automotive Polymer Composites Market Revenue (Million) Forecast, by Application 2020 & 2033
- Table 76: Argentina Automotive Polymer Composites Market Volume (Million) Forecast, by Application 2020 & 2033
- Table 77: Colombia Automotive Polymer Composites Market Revenue (Million) Forecast, by Application 2020 & 2033
- Table 78: Colombia Automotive Polymer Composites Market Volume (Million) Forecast, by Application 2020 & 2033
- Table 79: Rest of South America Automotive Polymer Composites Market Revenue (Million) Forecast, by Application 2020 & 2033
- Table 80: Rest of South America Automotive Polymer Composites Market Volume (Million) Forecast, by Application 2020 & 2033
- Table 81: Global Automotive Polymer Composites Market Revenue Million Forecast, by Resin Type 2020 & 2033
- Table 82: Global Automotive Polymer Composites Market Volume Million Forecast, by Resin Type 2020 & 2033
- Table 83: Global Automotive Polymer Composites Market Revenue Million Forecast, by Vehicle Type 2020 & 2033
- Table 84: Global Automotive Polymer Composites Market Volume Million Forecast, by Vehicle Type 2020 & 2033
- Table 85: Global Automotive Polymer Composites Market Revenue Million Forecast, by Country 2020 & 2033
- Table 86: Global Automotive Polymer Composites Market Volume Million Forecast, by Country 2020 & 2033
- Table 87: Morocco Automotive Polymer Composites Market Revenue (Million) Forecast, by Application 2020 & 2033
- Table 88: Morocco Automotive Polymer Composites Market Volume (Million) Forecast, by Application 2020 & 2033
- Table 89: South Africa Automotive Polymer Composites Market Revenue (Million) Forecast, by Application 2020 & 2033
- Table 90: South Africa Automotive Polymer Composites Market Volume (Million) Forecast, by Application 2020 & 2033
- Table 91: Nigeria Automotive Polymer Composites Market Revenue (Million) Forecast, by Application 2020 & 2033
- Table 92: Nigeria Automotive Polymer Composites Market Volume (Million) Forecast, by Application 2020 & 2033
- Table 93: Qatar Automotive Polymer Composites Market Revenue (Million) Forecast, by Application 2020 & 2033
- Table 94: Qatar Automotive Polymer Composites Market Volume (Million) Forecast, by Application 2020 & 2033
- Table 95: Egypt Automotive Polymer Composites Market Revenue (Million) Forecast, by Application 2020 & 2033
- Table 96: Egypt Automotive Polymer Composites Market Volume (Million) Forecast, by Application 2020 & 2033
- Table 97: UAE Automotive Polymer Composites Market Revenue (Million) Forecast, by Application 2020 & 2033
- Table 98: UAE Automotive Polymer Composites Market Volume (Million) Forecast, by Application 2020 & 2033
- Table 99: Rest of Middle East and Africa Automotive Polymer Composites Market Revenue (Million) Forecast, by Application 2020 & 2033
- Table 100: Rest of Middle East and Africa Automotive Polymer Composites Market Volume (Million) Forecast, by Application 2020 & 2033
Frequently Asked Questions
1. What is the projected Compound Annual Growth Rate (CAGR) of the Automotive Polymer Composites Market?
The projected CAGR is approximately > 5.00%.
2. Which companies are prominent players in the Automotive Polymer Composites Market?
Key companies in the market include SGL Carbon, Kolon Industries, Solvay, Mitsubishi Chemical Corporatio, Toray Advanced Composites, Teijin Carbon, Gurit Services AG, UFP Technologies Inc , Owens Corning, BASF SE, Plasan Sasa Ltd, DuPont, Hexcel Corporation, Covestro AG, Johns Manville, Pyrophobic Systems Ltd.
3. What are the main segments of the Automotive Polymer Composites Market?
The market segments include Resin Type, Vehicle Type.
4. Can you provide details about the market size?
The market size is estimated to be USD XX Million as of 2022.
5. What are some drivers contributing to market growth?
Increasing Use of Composite Material in Light Vehicle Segment; High Growth of the Electric Vehicles Industry; Other Drivers.
6. What are the notable trends driving market growth?
Increasing Use of Polymers in the Light Vehicle Segment.
7. Are there any restraints impacting market growth?
Safety Concerns about Fire Risk and Crashworthiness; High Processing and Manufacturing Costs.
8. Can you provide examples of recent developments in the market?
N/A
9. What pricing options are available for accessing the report?
Pricing options include single-user, multi-user, and enterprise licenses priced at USD 4750, USD 5250, and USD 8750 respectively.
10. Is the market size provided in terms of value or volume?
The market size is provided in terms of value, measured in Million and volume, measured in Million.
11. Are there any specific market keywords associated with the report?
Yes, the market keyword associated with the report is "Automotive Polymer Composites Market," which aids in identifying and referencing the specific market segment covered.
12. How do I determine which pricing option suits my needs best?
The pricing options vary based on user requirements and access needs. Individual users may opt for single-user licenses, while businesses requiring broader access may choose multi-user or enterprise licenses for cost-effective access to the report.
13. Are there any additional resources or data provided in the Automotive Polymer Composites Market report?
While the report offers comprehensive insights, it's advisable to review the specific contents or supplementary materials provided to ascertain if additional resources or data are available.
14. How can I stay updated on further developments or reports in the Automotive Polymer Composites Market?
To stay informed about further developments, trends, and reports in the Automotive Polymer Composites Market, consider subscribing to industry newsletters, following relevant companies and organizations, or regularly checking reputable industry news sources and publications.
Methodology
Step 1 - Identification of Relevant Samples Size from Population Database


Step 2 - Approaches for Defining Global Market Size (Value, Volume* & Price*)

Note*: In applicable scenarios
Step 3 - Data Sources
Primary Research
- Web Analytics
- Survey Reports
- Research Institute
- Latest Research Reports
- Opinion Leaders
Secondary Research
- Annual Reports
- White Paper
- Latest Press Release
- Industry Association
- Paid Database
- Investor Presentations

Step 4 - Data Triangulation
Involves using different sources of information in order to increase the validity of a study
These sources are likely to be stakeholders in a program - participants, other researchers, program staff, other community members, and so on.
Then we put all data in single framework & apply various statistical tools to find out the dynamic on the market.
During the analysis stage, feedback from the stakeholder groups would be compared to determine areas of agreement as well as areas of divergence