

Key Insights
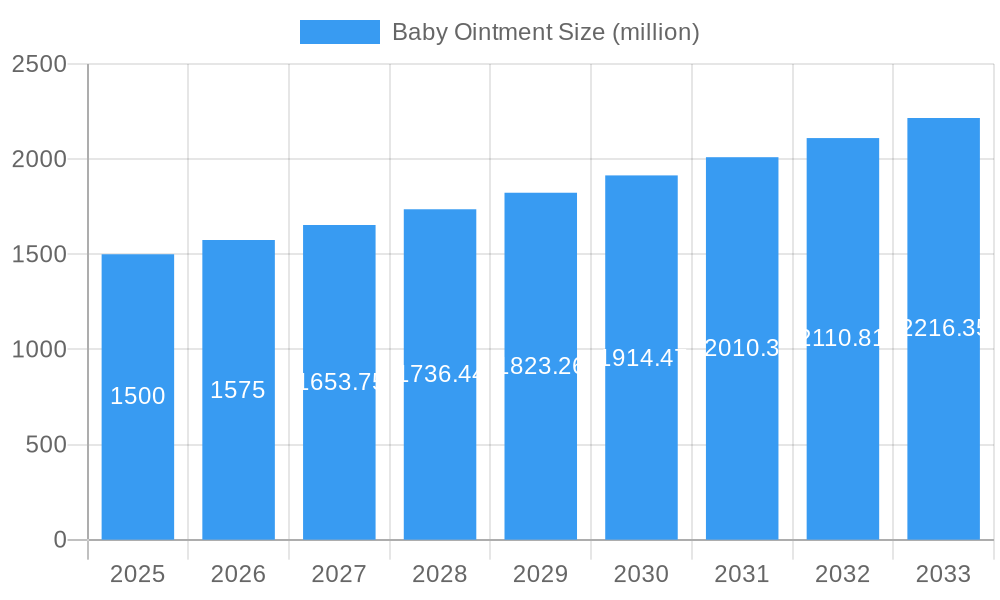
The global baby ointment market is experiencing robust growth, driven by increasing awareness of infant skincare needs and the rising preference for natural and organic products. The market, estimated at $1.5 billion in 2025, is projected to maintain a healthy Compound Annual Growth Rate (CAGR) of 5% from 2025 to 2033, reaching approximately $2.3 billion by 2033. This growth is fueled by several key factors including the rising incidence of diaper rash and other skin irritations in infants, increasing disposable incomes in developing economies leading to higher spending on premium baby care products, and a growing preference for hypoallergenic and fragrance-free ointments due to concerns about sensitive baby skin. Furthermore, the market is witnessing a significant shift towards products with natural ingredients, like shea butter and chamomile, reflecting the growing consumer demand for eco-friendly and sustainably sourced options. Key players like Burt's Bees, Johnson & Johnson, Sebapharma, Beiersdorf, Himalaya, and Naterra International are actively contributing to this expansion through product innovation, strategic partnerships, and increased marketing efforts.
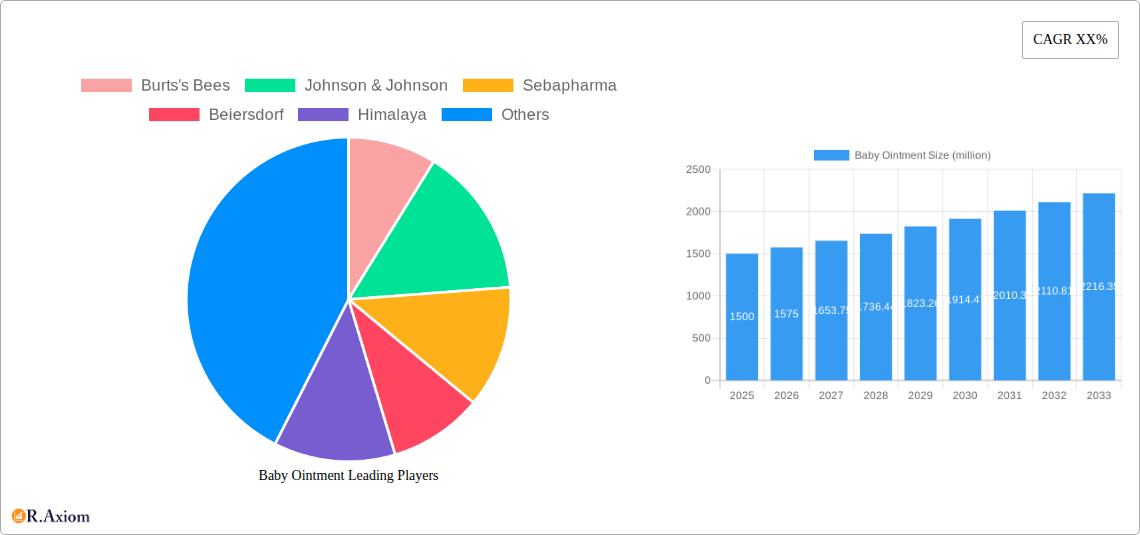
Baby Ointment Market Size (In Billion)
However, challenges remain. Price sensitivity among consumers, particularly in price-conscious markets, can restrain market growth. The stringent regulatory landscape surrounding baby care products, coupled with increasing concerns regarding the safety and efficacy of certain ingredients, also poses a hurdle. Competition from generic and private-label brands further impacts the profit margins of established players. The market segmentation reveals a significant share for hypoallergenic ointments, reflecting growing concerns about infant skin allergies, whilst the regional analysis is expected to show strong performance in North America and Europe, driven by increased consumer awareness and spending power. Nevertheless, opportunities exist for manufacturers to focus on product differentiation through innovation and targeted marketing campaigns towards health-conscious parents seeking safe and effective baby care solutions.
Baby Ointment Company Market Share
Baby Ointment Market Report: 2019-2033 - A Comprehensive Analysis
This in-depth report provides a comprehensive analysis of the global baby ointment market from 2019 to 2033, offering actionable insights for industry stakeholders. The report covers market size, growth drivers, challenges, opportunities, competitive landscape, and future trends, with a focus on key players and emerging segments. With a detailed analysis of over $XX million market, this report is essential for businesses seeking to understand and capitalize on the opportunities within this dynamic sector. The study period covers 2019-2033, with 2025 as the base and estimated year. The forecast period spans 2025-2033, and the historical period covers 2019-2024.
Baby Ointment Market Concentration & Innovation
This section analyzes the market concentration, innovation drivers, regulatory frameworks, product substitutes, end-user trends, and M&A activities within the baby ointment market. The global market is moderately concentrated, with key players holding significant market share, estimated at $XX million in 2025. However, the presence of numerous smaller players and regional brands indicates opportunities for both expansion and niche market penetration.
- Market Share: Johnson & Johnson holds an estimated XX% market share, followed by Burt's Bees at XX%, Beiersdorf at XX%, and others. Sebapharma and Himalaya together account for approximately XX%. Naterra International holds a smaller, but growing, share.
- Innovation Drivers: Growing demand for natural and organic ingredients, coupled with the increasing focus on hypoallergenic and fragrance-free formulations, drives innovation.
- Regulatory Frameworks: Stringent regulations regarding the safety and efficacy of baby products influence product development and market entry.
- Product Substitutes: Other skincare products like lotions and creams can serve as substitutes, creating competitive pressure.
- M&A Activities: The past five years have witnessed several M&A deals, valued at approximately $XX million, reflecting the consolidation trend within the market. These acquisitions often focus on strengthening brand portfolios and expanding geographical reach. For example, a hypothetical acquisition of a smaller organic baby care company by Johnson & Johnson could be valued at $XX million.
Baby Ointment Industry Trends & Insights
This section delves into the market's growth drivers, technological disruptions, consumer preferences, and competitive dynamics. The global baby ointment market is projected to experience significant growth during the forecast period, with a Compound Annual Growth Rate (CAGR) of XX% from 2025 to 2033. This growth is driven by several factors: increasing awareness of the importance of baby skin health, rising disposable incomes in developing economies, and changing consumer preferences toward premium and specialized baby products. Technological advancements, such as improved formulations and packaging, are contributing to product innovation. Market penetration is expected to increase in underserved regions. Competitive dynamics are marked by price competition, product differentiation, and brand loyalty. The market is witnessing an increasing preference for natural and organic ingredients, driving companies to reformulate their products and invest in sustainable sourcing.
Dominant Markets & Segments in Baby Ointment
This section analyzes the leading regions, countries, and segments within the baby ointment market. North America currently holds the largest market share, driven by high consumer spending and awareness of baby skin health.
- Key Drivers in North America:
- High disposable incomes
- Strong retail infrastructure
- Favorable regulatory environment
- High awareness of premium and specialized baby care products.
- Dominance Analysis: The dominance of North America is attributed to factors including high per capita income, strong brand presence of major players, and established distribution channels. However, Asia-Pacific is emerging as a rapidly growing market, driven by increasing birth rates and rising disposable incomes. European markets are relatively mature, but still represent a significant portion of global sales.
Baby Ointment Product Developments
Recent product innovations focus on hypoallergenic formulations, natural ingredients, and sustainable packaging. Companies are emphasizing the use of organic and plant-derived components to appeal to health-conscious consumers. The trend toward multi-functional products, such as ointments offering both protection and moisturizing benefits, is also gaining traction. These developments reflect a growing awareness of potential skin sensitivities and a broader focus on eco-friendly practices within the industry.
Report Scope & Segmentation Analysis
This report segments the baby ointment market based on product type (e.g., cream, lotion, ointment), ingredient type (e.g., herbal, chemical), distribution channel (e.g., online, offline), and region. Each segment is analyzed in terms of its market size, growth rate, and competitive dynamics. Growth projections vary across segments, with the natural/organic segment anticipated to witness the highest growth due to increasing consumer preference for natural products. The online distribution channel is expected to experience rapid growth due to increased online shopping and convenient delivery options.
Key Drivers of Baby Ointment Growth
Key drivers of market growth include:
- Rising disposable incomes in developing countries leading to increased spending on baby care products.
- Growing awareness of the importance of baby skin health and hygiene amongst parents.
- Increasing demand for natural and organic baby products.
- Technological advancements resulting in innovative product formulations and packaging.
- Favorable government regulations promoting the safety and quality of baby care products.
Challenges in the Baby Ointment Sector
Challenges within the baby ointment sector include:
- Stringent regulatory requirements and compliance costs.
- Intense competition from established and emerging players.
- Fluctuations in raw material prices affecting production costs.
- Maintaining consistent product quality and efficacy across different manufacturing batches.
- Ensuring sustainable and ethical sourcing of raw materials.
Emerging Opportunities in Baby Ointment
Emerging opportunities include:
- Expanding into untapped markets in developing regions.
- Developing innovative products tailored to specific skin conditions in babies.
- Leveraging e-commerce platforms to reach a wider customer base.
- Focusing on sustainable and eco-friendly packaging solutions.
- Investing in research and development to create advanced formulations and ingredients.
Leading Players in the Baby Ointment Market
- Burt's Bees
- Johnson & Johnson
- Sebapharma
- Beiersdorf
- Himalaya
- Naterra International
Key Developments in Baby Ointment Industry
- 2022 Q4: Johnson & Johnson launched a new line of hypoallergenic baby ointments.
- 2023 Q1: Burt's Bees introduced a sustainable packaging for its baby ointment range.
- 2023 Q3: A significant merger between two smaller baby care companies resulted in a broader product portfolio. (Hypothetical example)
Strategic Outlook for Baby Ointment Market
The baby ointment market is poised for continued growth, driven by increasing consumer awareness, technological advancements, and favorable regulatory environments. The focus on natural and organic ingredients, coupled with the expansion into emerging markets, presents significant opportunities for industry players. Companies investing in research and development, sustainable practices, and targeted marketing strategies are well-positioned to capitalize on the market's future potential.
Baby Ointment Segmentation
-
1. Application
- 1.1. Eczema
- 1.2. Heat Rash
- 1.3. Diaper Rash
- 1.4. Dry Skin
- 1.5. Cuts
- 1.6. Insect Bites
-
2. Types
- 2.1. Massage Oils
- 2.2. Lotions
- 2.3. Medicinal Creams
Baby Ointment Segmentation By Geography
-
1. North America
- 1.1. United States
- 1.2. Canada
- 1.3. Mexico
-
2. South America
- 2.1. Brazil
- 2.2. Argentina
- 2.3. Rest of South America
-
3. Europe
- 3.1. United Kingdom
- 3.2. Germany
- 3.3. France
- 3.4. Italy
- 3.5. Spain
- 3.6. Russia
- 3.7. Benelux
- 3.8. Nordics
- 3.9. Rest of Europe
-
4. Middle East & Africa
- 4.1. Turkey
- 4.2. Israel
- 4.3. GCC
- 4.4. North Africa
- 4.5. South Africa
- 4.6. Rest of Middle East & Africa
-
5. Asia Pacific
- 5.1. China
- 5.2. India
- 5.3. Japan
- 5.4. South Korea
- 5.5. ASEAN
- 5.6. Oceania
- 5.7. Rest of Asia Pacific

Baby Ointment Regional Market Share
Geographic Coverage of Baby Ointment
Baby Ointment REPORT HIGHLIGHTS
| Aspects | Details |
|---|---|
| Study Period | 2020-2034 |
| Base Year | 2025 |
| Estimated Year | 2026 |
| Forecast Period | 2026-2034 |
| Historical Period | 2020-2025 |
| Growth Rate | CAGR of 16.43% from 2020-2034 |
| Segmentation |
|
Table of Contents
- 1. Introduction
- 1.1. Research Scope
- 1.2. Market Segmentation
- 1.3. Research Methodology
- 1.4. Definitions and Assumptions
- 2. Executive Summary
- 2.1. Introduction
- 3. Market Dynamics
- 3.1. Introduction
- 3.2. Market Drivers
- 3.3. Market Restrains
- 3.4. Market Trends
- 4. Market Factor Analysis
- 4.1. Porters Five Forces
- 4.2. Supply/Value Chain
- 4.3. PESTEL analysis
- 4.4. Market Entropy
- 4.5. Patent/Trademark Analysis
- 5. Global Baby Ointment Analysis, Insights and Forecast, 2020-2032
- 5.1. Market Analysis, Insights and Forecast - by Application
- 5.1.1. Eczema
- 5.1.2. Heat Rash
- 5.1.3. Diaper Rash
- 5.1.4. Dry Skin
- 5.1.5. Cuts
- 5.1.6. Insect Bites
- 5.2. Market Analysis, Insights and Forecast - by Types
- 5.2.1. Massage Oils
- 5.2.2. Lotions
- 5.2.3. Medicinal Creams
- 5.3. Market Analysis, Insights and Forecast - by Region
- 5.3.1. North America
- 5.3.2. South America
- 5.3.3. Europe
- 5.3.4. Middle East & Africa
- 5.3.5. Asia Pacific
- 5.1. Market Analysis, Insights and Forecast - by Application
- 6. North America Baby Ointment Analysis, Insights and Forecast, 2020-2032
- 6.1. Market Analysis, Insights and Forecast - by Application
- 6.1.1. Eczema
- 6.1.2. Heat Rash
- 6.1.3. Diaper Rash
- 6.1.4. Dry Skin
- 6.1.5. Cuts
- 6.1.6. Insect Bites
- 6.2. Market Analysis, Insights and Forecast - by Types
- 6.2.1. Massage Oils
- 6.2.2. Lotions
- 6.2.3. Medicinal Creams
- 6.1. Market Analysis, Insights and Forecast - by Application
- 7. South America Baby Ointment Analysis, Insights and Forecast, 2020-2032
- 7.1. Market Analysis, Insights and Forecast - by Application
- 7.1.1. Eczema
- 7.1.2. Heat Rash
- 7.1.3. Diaper Rash
- 7.1.4. Dry Skin
- 7.1.5. Cuts
- 7.1.6. Insect Bites
- 7.2. Market Analysis, Insights and Forecast - by Types
- 7.2.1. Massage Oils
- 7.2.2. Lotions
- 7.2.3. Medicinal Creams
- 7.1. Market Analysis, Insights and Forecast - by Application
- 8. Europe Baby Ointment Analysis, Insights and Forecast, 2020-2032
- 8.1. Market Analysis, Insights and Forecast - by Application
- 8.1.1. Eczema
- 8.1.2. Heat Rash
- 8.1.3. Diaper Rash
- 8.1.4. Dry Skin
- 8.1.5. Cuts
- 8.1.6. Insect Bites
- 8.2. Market Analysis, Insights and Forecast - by Types
- 8.2.1. Massage Oils
- 8.2.2. Lotions
- 8.2.3. Medicinal Creams
- 8.1. Market Analysis, Insights and Forecast - by Application
- 9. Middle East & Africa Baby Ointment Analysis, Insights and Forecast, 2020-2032
- 9.1. Market Analysis, Insights and Forecast - by Application
- 9.1.1. Eczema
- 9.1.2. Heat Rash
- 9.1.3. Diaper Rash
- 9.1.4. Dry Skin
- 9.1.5. Cuts
- 9.1.6. Insect Bites
- 9.2. Market Analysis, Insights and Forecast - by Types
- 9.2.1. Massage Oils
- 9.2.2. Lotions
- 9.2.3. Medicinal Creams
- 9.1. Market Analysis, Insights and Forecast - by Application
- 10. Asia Pacific Baby Ointment Analysis, Insights and Forecast, 2020-2032
- 10.1. Market Analysis, Insights and Forecast - by Application
- 10.1.1. Eczema
- 10.1.2. Heat Rash
- 10.1.3. Diaper Rash
- 10.1.4. Dry Skin
- 10.1.5. Cuts
- 10.1.6. Insect Bites
- 10.2. Market Analysis, Insights and Forecast - by Types
- 10.2.1. Massage Oils
- 10.2.2. Lotions
- 10.2.3. Medicinal Creams
- 10.1. Market Analysis, Insights and Forecast - by Application
- 11. Competitive Analysis
- 11.1. Global Market Share Analysis 2025
- 11.2. Company Profiles
- 11.2.1 Burts's Bees
- 11.2.1.1. Overview
- 11.2.1.2. Products
- 11.2.1.3. SWOT Analysis
- 11.2.1.4. Recent Developments
- 11.2.1.5. Financials (Based on Availability)
- 11.2.2 Johnson & Johnson
- 11.2.2.1. Overview
- 11.2.2.2. Products
- 11.2.2.3. SWOT Analysis
- 11.2.2.4. Recent Developments
- 11.2.2.5. Financials (Based on Availability)
- 11.2.3 Sebapharma
- 11.2.3.1. Overview
- 11.2.3.2. Products
- 11.2.3.3. SWOT Analysis
- 11.2.3.4. Recent Developments
- 11.2.3.5. Financials (Based on Availability)
- 11.2.4 Beiersdorf
- 11.2.4.1. Overview
- 11.2.4.2. Products
- 11.2.4.3. SWOT Analysis
- 11.2.4.4. Recent Developments
- 11.2.4.5. Financials (Based on Availability)
- 11.2.5 Himalaya
- 11.2.5.1. Overview
- 11.2.5.2. Products
- 11.2.5.3. SWOT Analysis
- 11.2.5.4. Recent Developments
- 11.2.5.5. Financials (Based on Availability)
- 11.2.6 Naterra International
- 11.2.6.1. Overview
- 11.2.6.2. Products
- 11.2.6.3. SWOT Analysis
- 11.2.6.4. Recent Developments
- 11.2.6.5. Financials (Based on Availability)
- 11.2.1 Burts's Bees
List of Figures
- Figure 1: Global Baby Ointment Revenue Breakdown (undefined, %) by Region 2025 & 2033
- Figure 2: Global Baby Ointment Volume Breakdown (K, %) by Region 2025 & 2033
- Figure 3: North America Baby Ointment Revenue (undefined), by Application 2025 & 2033
- Figure 4: North America Baby Ointment Volume (K), by Application 2025 & 2033
- Figure 5: North America Baby Ointment Revenue Share (%), by Application 2025 & 2033
- Figure 6: North America Baby Ointment Volume Share (%), by Application 2025 & 2033
- Figure 7: North America Baby Ointment Revenue (undefined), by Types 2025 & 2033
- Figure 8: North America Baby Ointment Volume (K), by Types 2025 & 2033
- Figure 9: North America Baby Ointment Revenue Share (%), by Types 2025 & 2033
- Figure 10: North America Baby Ointment Volume Share (%), by Types 2025 & 2033
- Figure 11: North America Baby Ointment Revenue (undefined), by Country 2025 & 2033
- Figure 12: North America Baby Ointment Volume (K), by Country 2025 & 2033
- Figure 13: North America Baby Ointment Revenue Share (%), by Country 2025 & 2033
- Figure 14: North America Baby Ointment Volume Share (%), by Country 2025 & 2033
- Figure 15: South America Baby Ointment Revenue (undefined), by Application 2025 & 2033
- Figure 16: South America Baby Ointment Volume (K), by Application 2025 & 2033
- Figure 17: South America Baby Ointment Revenue Share (%), by Application 2025 & 2033
- Figure 18: South America Baby Ointment Volume Share (%), by Application 2025 & 2033
- Figure 19: South America Baby Ointment Revenue (undefined), by Types 2025 & 2033
- Figure 20: South America Baby Ointment Volume (K), by Types 2025 & 2033
- Figure 21: South America Baby Ointment Revenue Share (%), by Types 2025 & 2033
- Figure 22: South America Baby Ointment Volume Share (%), by Types 2025 & 2033
- Figure 23: South America Baby Ointment Revenue (undefined), by Country 2025 & 2033
- Figure 24: South America Baby Ointment Volume (K), by Country 2025 & 2033
- Figure 25: South America Baby Ointment Revenue Share (%), by Country 2025 & 2033
- Figure 26: South America Baby Ointment Volume Share (%), by Country 2025 & 2033
- Figure 27: Europe Baby Ointment Revenue (undefined), by Application 2025 & 2033
- Figure 28: Europe Baby Ointment Volume (K), by Application 2025 & 2033
- Figure 29: Europe Baby Ointment Revenue Share (%), by Application 2025 & 2033
- Figure 30: Europe Baby Ointment Volume Share (%), by Application 2025 & 2033
- Figure 31: Europe Baby Ointment Revenue (undefined), by Types 2025 & 2033
- Figure 32: Europe Baby Ointment Volume (K), by Types 2025 & 2033
- Figure 33: Europe Baby Ointment Revenue Share (%), by Types 2025 & 2033
- Figure 34: Europe Baby Ointment Volume Share (%), by Types 2025 & 2033
- Figure 35: Europe Baby Ointment Revenue (undefined), by Country 2025 & 2033
- Figure 36: Europe Baby Ointment Volume (K), by Country 2025 & 2033
- Figure 37: Europe Baby Ointment Revenue Share (%), by Country 2025 & 2033
- Figure 38: Europe Baby Ointment Volume Share (%), by Country 2025 & 2033
- Figure 39: Middle East & Africa Baby Ointment Revenue (undefined), by Application 2025 & 2033
- Figure 40: Middle East & Africa Baby Ointment Volume (K), by Application 2025 & 2033
- Figure 41: Middle East & Africa Baby Ointment Revenue Share (%), by Application 2025 & 2033
- Figure 42: Middle East & Africa Baby Ointment Volume Share (%), by Application 2025 & 2033
- Figure 43: Middle East & Africa Baby Ointment Revenue (undefined), by Types 2025 & 2033
- Figure 44: Middle East & Africa Baby Ointment Volume (K), by Types 2025 & 2033
- Figure 45: Middle East & Africa Baby Ointment Revenue Share (%), by Types 2025 & 2033
- Figure 46: Middle East & Africa Baby Ointment Volume Share (%), by Types 2025 & 2033
- Figure 47: Middle East & Africa Baby Ointment Revenue (undefined), by Country 2025 & 2033
- Figure 48: Middle East & Africa Baby Ointment Volume (K), by Country 2025 & 2033
- Figure 49: Middle East & Africa Baby Ointment Revenue Share (%), by Country 2025 & 2033
- Figure 50: Middle East & Africa Baby Ointment Volume Share (%), by Country 2025 & 2033
- Figure 51: Asia Pacific Baby Ointment Revenue (undefined), by Application 2025 & 2033
- Figure 52: Asia Pacific Baby Ointment Volume (K), by Application 2025 & 2033
- Figure 53: Asia Pacific Baby Ointment Revenue Share (%), by Application 2025 & 2033
- Figure 54: Asia Pacific Baby Ointment Volume Share (%), by Application 2025 & 2033
- Figure 55: Asia Pacific Baby Ointment Revenue (undefined), by Types 2025 & 2033
- Figure 56: Asia Pacific Baby Ointment Volume (K), by Types 2025 & 2033
- Figure 57: Asia Pacific Baby Ointment Revenue Share (%), by Types 2025 & 2033
- Figure 58: Asia Pacific Baby Ointment Volume Share (%), by Types 2025 & 2033
- Figure 59: Asia Pacific Baby Ointment Revenue (undefined), by Country 2025 & 2033
- Figure 60: Asia Pacific Baby Ointment Volume (K), by Country 2025 & 2033
- Figure 61: Asia Pacific Baby Ointment Revenue Share (%), by Country 2025 & 2033
- Figure 62: Asia Pacific Baby Ointment Volume Share (%), by Country 2025 & 2033
List of Tables
- Table 1: Global Baby Ointment Revenue undefined Forecast, by Application 2020 & 2033
- Table 2: Global Baby Ointment Volume K Forecast, by Application 2020 & 2033
- Table 3: Global Baby Ointment Revenue undefined Forecast, by Types 2020 & 2033
- Table 4: Global Baby Ointment Volume K Forecast, by Types 2020 & 2033
- Table 5: Global Baby Ointment Revenue undefined Forecast, by Region 2020 & 2033
- Table 6: Global Baby Ointment Volume K Forecast, by Region 2020 & 2033
- Table 7: Global Baby Ointment Revenue undefined Forecast, by Application 2020 & 2033
- Table 8: Global Baby Ointment Volume K Forecast, by Application 2020 & 2033
- Table 9: Global Baby Ointment Revenue undefined Forecast, by Types 2020 & 2033
- Table 10: Global Baby Ointment Volume K Forecast, by Types 2020 & 2033
- Table 11: Global Baby Ointment Revenue undefined Forecast, by Country 2020 & 2033
- Table 12: Global Baby Ointment Volume K Forecast, by Country 2020 & 2033
- Table 13: United States Baby Ointment Revenue (undefined) Forecast, by Application 2020 & 2033
- Table 14: United States Baby Ointment Volume (K) Forecast, by Application 2020 & 2033
- Table 15: Canada Baby Ointment Revenue (undefined) Forecast, by Application 2020 & 2033
- Table 16: Canada Baby Ointment Volume (K) Forecast, by Application 2020 & 2033
- Table 17: Mexico Baby Ointment Revenue (undefined) Forecast, by Application 2020 & 2033
- Table 18: Mexico Baby Ointment Volume (K) Forecast, by Application 2020 & 2033
- Table 19: Global Baby Ointment Revenue undefined Forecast, by Application 2020 & 2033
- Table 20: Global Baby Ointment Volume K Forecast, by Application 2020 & 2033
- Table 21: Global Baby Ointment Revenue undefined Forecast, by Types 2020 & 2033
- Table 22: Global Baby Ointment Volume K Forecast, by Types 2020 & 2033
- Table 23: Global Baby Ointment Revenue undefined Forecast, by Country 2020 & 2033
- Table 24: Global Baby Ointment Volume K Forecast, by Country 2020 & 2033
- Table 25: Brazil Baby Ointment Revenue (undefined) Forecast, by Application 2020 & 2033
- Table 26: Brazil Baby Ointment Volume (K) Forecast, by Application 2020 & 2033
- Table 27: Argentina Baby Ointment Revenue (undefined) Forecast, by Application 2020 & 2033
- Table 28: Argentina Baby Ointment Volume (K) Forecast, by Application 2020 & 2033
- Table 29: Rest of South America Baby Ointment Revenue (undefined) Forecast, by Application 2020 & 2033
- Table 30: Rest of South America Baby Ointment Volume (K) Forecast, by Application 2020 & 2033
- Table 31: Global Baby Ointment Revenue undefined Forecast, by Application 2020 & 2033
- Table 32: Global Baby Ointment Volume K Forecast, by Application 2020 & 2033
- Table 33: Global Baby Ointment Revenue undefined Forecast, by Types 2020 & 2033
- Table 34: Global Baby Ointment Volume K Forecast, by Types 2020 & 2033
- Table 35: Global Baby Ointment Revenue undefined Forecast, by Country 2020 & 2033
- Table 36: Global Baby Ointment Volume K Forecast, by Country 2020 & 2033
- Table 37: United Kingdom Baby Ointment Revenue (undefined) Forecast, by Application 2020 & 2033
- Table 38: United Kingdom Baby Ointment Volume (K) Forecast, by Application 2020 & 2033
- Table 39: Germany Baby Ointment Revenue (undefined) Forecast, by Application 2020 & 2033
- Table 40: Germany Baby Ointment Volume (K) Forecast, by Application 2020 & 2033
- Table 41: France Baby Ointment Revenue (undefined) Forecast, by Application 2020 & 2033
- Table 42: France Baby Ointment Volume (K) Forecast, by Application 2020 & 2033
- Table 43: Italy Baby Ointment Revenue (undefined) Forecast, by Application 2020 & 2033
- Table 44: Italy Baby Ointment Volume (K) Forecast, by Application 2020 & 2033
- Table 45: Spain Baby Ointment Revenue (undefined) Forecast, by Application 2020 & 2033
- Table 46: Spain Baby Ointment Volume (K) Forecast, by Application 2020 & 2033
- Table 47: Russia Baby Ointment Revenue (undefined) Forecast, by Application 2020 & 2033
- Table 48: Russia Baby Ointment Volume (K) Forecast, by Application 2020 & 2033
- Table 49: Benelux Baby Ointment Revenue (undefined) Forecast, by Application 2020 & 2033
- Table 50: Benelux Baby Ointment Volume (K) Forecast, by Application 2020 & 2033
- Table 51: Nordics Baby Ointment Revenue (undefined) Forecast, by Application 2020 & 2033
- Table 52: Nordics Baby Ointment Volume (K) Forecast, by Application 2020 & 2033
- Table 53: Rest of Europe Baby Ointment Revenue (undefined) Forecast, by Application 2020 & 2033
- Table 54: Rest of Europe Baby Ointment Volume (K) Forecast, by Application 2020 & 2033
- Table 55: Global Baby Ointment Revenue undefined Forecast, by Application 2020 & 2033
- Table 56: Global Baby Ointment Volume K Forecast, by Application 2020 & 2033
- Table 57: Global Baby Ointment Revenue undefined Forecast, by Types 2020 & 2033
- Table 58: Global Baby Ointment Volume K Forecast, by Types 2020 & 2033
- Table 59: Global Baby Ointment Revenue undefined Forecast, by Country 2020 & 2033
- Table 60: Global Baby Ointment Volume K Forecast, by Country 2020 & 2033
- Table 61: Turkey Baby Ointment Revenue (undefined) Forecast, by Application 2020 & 2033
- Table 62: Turkey Baby Ointment Volume (K) Forecast, by Application 2020 & 2033
- Table 63: Israel Baby Ointment Revenue (undefined) Forecast, by Application 2020 & 2033
- Table 64: Israel Baby Ointment Volume (K) Forecast, by Application 2020 & 2033
- Table 65: GCC Baby Ointment Revenue (undefined) Forecast, by Application 2020 & 2033
- Table 66: GCC Baby Ointment Volume (K) Forecast, by Application 2020 & 2033
- Table 67: North Africa Baby Ointment Revenue (undefined) Forecast, by Application 2020 & 2033
- Table 68: North Africa Baby Ointment Volume (K) Forecast, by Application 2020 & 2033
- Table 69: South Africa Baby Ointment Revenue (undefined) Forecast, by Application 2020 & 2033
- Table 70: South Africa Baby Ointment Volume (K) Forecast, by Application 2020 & 2033
- Table 71: Rest of Middle East & Africa Baby Ointment Revenue (undefined) Forecast, by Application 2020 & 2033
- Table 72: Rest of Middle East & Africa Baby Ointment Volume (K) Forecast, by Application 2020 & 2033
- Table 73: Global Baby Ointment Revenue undefined Forecast, by Application 2020 & 2033
- Table 74: Global Baby Ointment Volume K Forecast, by Application 2020 & 2033
- Table 75: Global Baby Ointment Revenue undefined Forecast, by Types 2020 & 2033
- Table 76: Global Baby Ointment Volume K Forecast, by Types 2020 & 2033
- Table 77: Global Baby Ointment Revenue undefined Forecast, by Country 2020 & 2033
- Table 78: Global Baby Ointment Volume K Forecast, by Country 2020 & 2033
- Table 79: China Baby Ointment Revenue (undefined) Forecast, by Application 2020 & 2033
- Table 80: China Baby Ointment Volume (K) Forecast, by Application 2020 & 2033
- Table 81: India Baby Ointment Revenue (undefined) Forecast, by Application 2020 & 2033
- Table 82: India Baby Ointment Volume (K) Forecast, by Application 2020 & 2033
- Table 83: Japan Baby Ointment Revenue (undefined) Forecast, by Application 2020 & 2033
- Table 84: Japan Baby Ointment Volume (K) Forecast, by Application 2020 & 2033
- Table 85: South Korea Baby Ointment Revenue (undefined) Forecast, by Application 2020 & 2033
- Table 86: South Korea Baby Ointment Volume (K) Forecast, by Application 2020 & 2033
- Table 87: ASEAN Baby Ointment Revenue (undefined) Forecast, by Application 2020 & 2033
- Table 88: ASEAN Baby Ointment Volume (K) Forecast, by Application 2020 & 2033
- Table 89: Oceania Baby Ointment Revenue (undefined) Forecast, by Application 2020 & 2033
- Table 90: Oceania Baby Ointment Volume (K) Forecast, by Application 2020 & 2033
- Table 91: Rest of Asia Pacific Baby Ointment Revenue (undefined) Forecast, by Application 2020 & 2033
- Table 92: Rest of Asia Pacific Baby Ointment Volume (K) Forecast, by Application 2020 & 2033
Frequently Asked Questions
1. What is the projected Compound Annual Growth Rate (CAGR) of the Baby Ointment?
The projected CAGR is approximately 16.43%.
2. Which companies are prominent players in the Baby Ointment?
Key companies in the market include Burts's Bees, Johnson & Johnson, Sebapharma, Beiersdorf, Himalaya, Naterra International.
3. What are the main segments of the Baby Ointment?
The market segments include Application, Types.
4. Can you provide details about the market size?
The market size is estimated to be USD XXX N/A as of 2022.
5. What are some drivers contributing to market growth?
N/A
6. What are the notable trends driving market growth?
N/A
7. Are there any restraints impacting market growth?
N/A
8. Can you provide examples of recent developments in the market?
N/A
9. What pricing options are available for accessing the report?
Pricing options include single-user, multi-user, and enterprise licenses priced at USD 3350.00, USD 5025.00, and USD 6700.00 respectively.
10. Is the market size provided in terms of value or volume?
The market size is provided in terms of value, measured in N/A and volume, measured in K.
11. Are there any specific market keywords associated with the report?
Yes, the market keyword associated with the report is "Baby Ointment," which aids in identifying and referencing the specific market segment covered.
12. How do I determine which pricing option suits my needs best?
The pricing options vary based on user requirements and access needs. Individual users may opt for single-user licenses, while businesses requiring broader access may choose multi-user or enterprise licenses for cost-effective access to the report.
13. Are there any additional resources or data provided in the Baby Ointment report?
While the report offers comprehensive insights, it's advisable to review the specific contents or supplementary materials provided to ascertain if additional resources or data are available.
14. How can I stay updated on further developments or reports in the Baby Ointment?
To stay informed about further developments, trends, and reports in the Baby Ointment, consider subscribing to industry newsletters, following relevant companies and organizations, or regularly checking reputable industry news sources and publications.
Methodology
Step 1 - Identification of Relevant Samples Size from Population Database


Step 2 - Approaches for Defining Global Market Size (Value, Volume* & Price*)

Note*: In applicable scenarios
Step 3 - Data Sources
Primary Research
- Web Analytics
- Survey Reports
- Research Institute
- Latest Research Reports
- Opinion Leaders
Secondary Research
- Annual Reports
- White Paper
- Latest Press Release
- Industry Association
- Paid Database
- Investor Presentations

Step 4 - Data Triangulation
Involves using different sources of information in order to increase the validity of a study
These sources are likely to be stakeholders in a program - participants, other researchers, program staff, other community members, and so on.
Then we put all data in single framework & apply various statistical tools to find out the dynamic on the market.
During the analysis stage, feedback from the stakeholder groups would be compared to determine areas of agreement as well as areas of divergence