

Key Insights
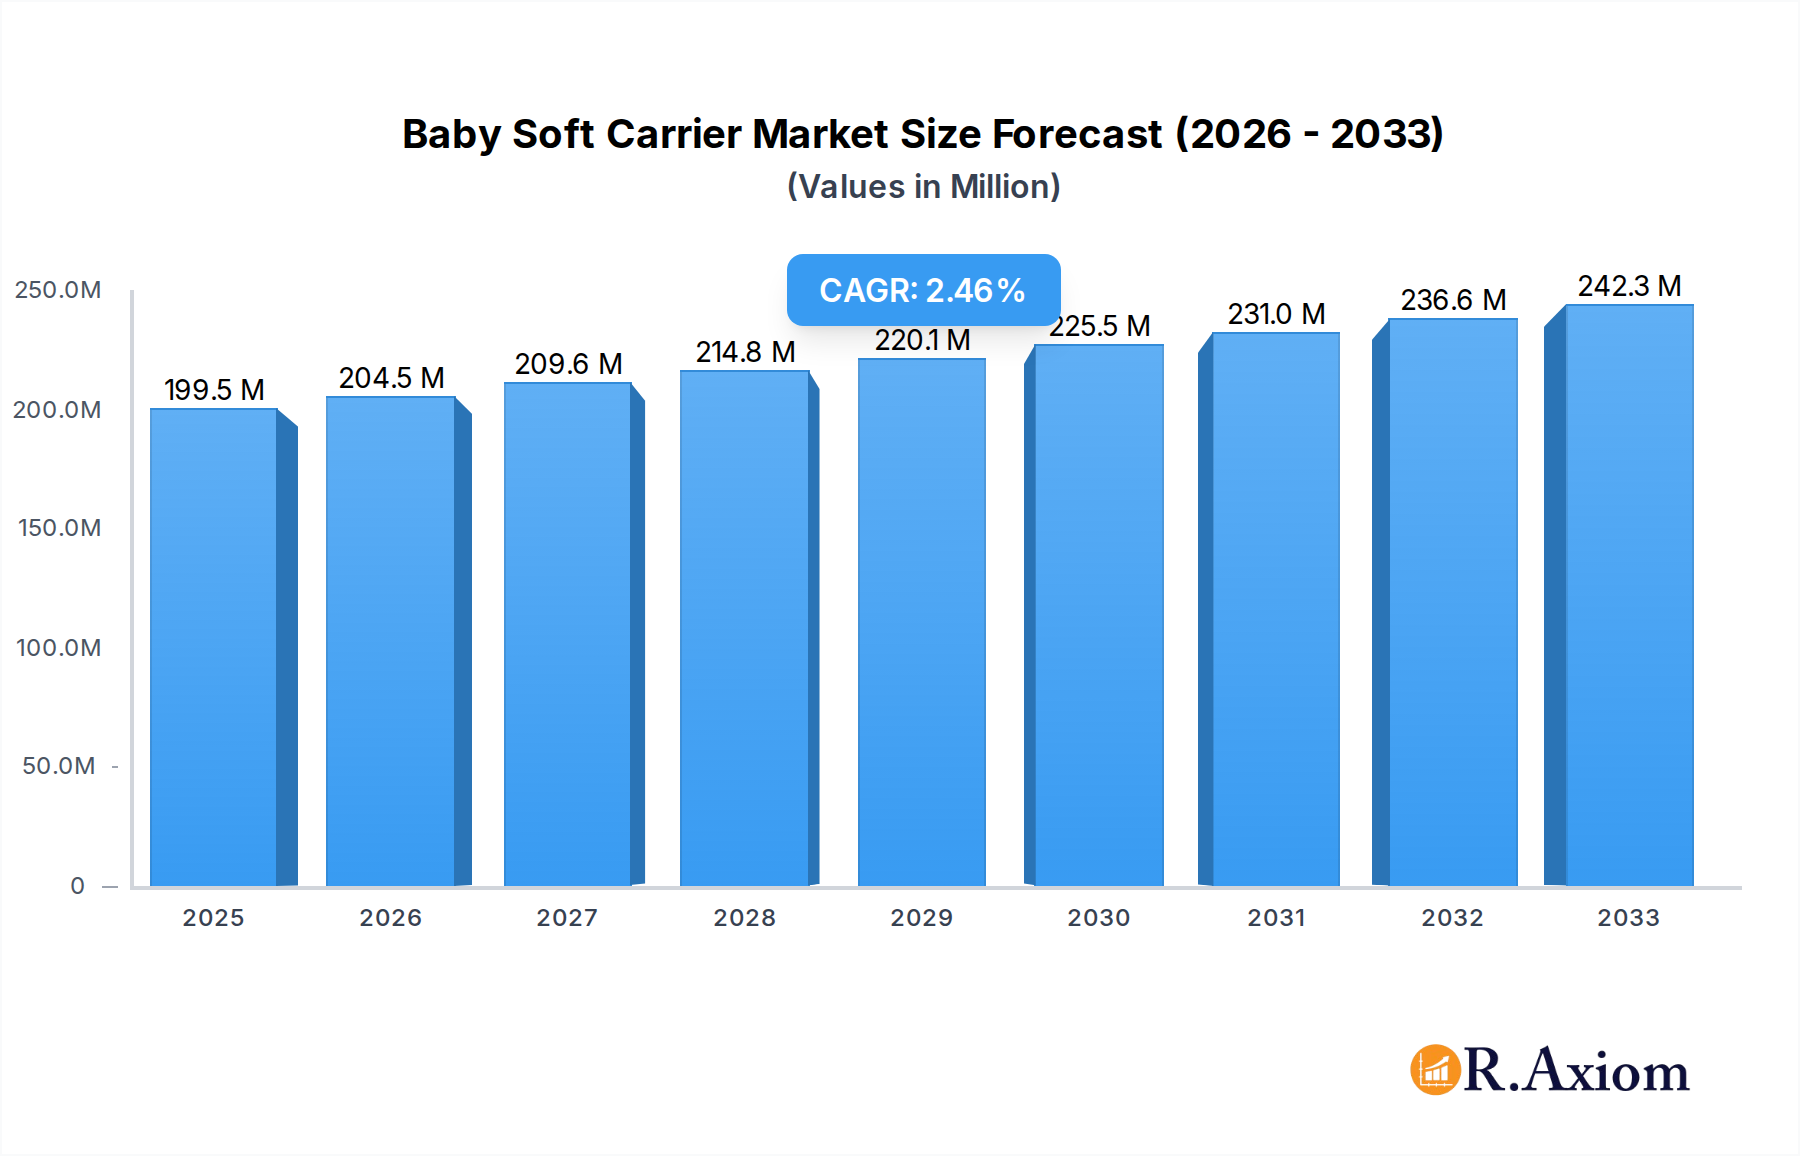
The global Baby Soft Carrier market is poised for steady growth, projected to reach a substantial $199.5 million by 2025. This growth is fueled by an anticipated Compound Annual Growth Rate (CAGR) of 2.5% from 2025 to 2033. A primary driver for this expansion is the increasing recognition among modern parents of the numerous benefits offered by soft baby carriers. These include enhanced bonding between parent and child, improved infant development through close physical contact, and the significant convenience for parents to keep their hands free while attending to daily tasks. The rising disposable income in developing regions and a growing awareness of ergonomic baby-carrying solutions further contribute to the demand. Furthermore, the growing influence of social media platforms showcasing parents actively using soft carriers for everyday activities and travel is a significant trend shaping consumer preferences and adoption rates.

Baby Soft Carrier Market Size (In Million)
Despite the positive outlook, the market faces certain restraints. The availability of alternative baby-carrying products, such as strollers and framed backpacks, presents a competitive challenge. Additionally, concerns regarding the correct usage of soft carriers to ensure infant safety and proper hip development can act as a deterrent for some parents, highlighting the need for robust consumer education initiatives. The market is segmented by application into Online Sales and Offline Sales, with online channels witnessing accelerated growth due to their convenience and wider reach. In terms of types, Polyester and Cotton dominate the product landscape, offering comfort and durability. Key players like Babycare, Sunveno, TushBaby, Bebamour, ThreeH, MiaMily, OSUKI, Ergobaby, LILLEbaby, Infantino, Baby K'tan, Bethbear, and Baby Bjorn are actively competing by innovating on designs, materials, and features to capture market share.
Baby Soft Carrier Company Market Share
Baby Soft Carrier Market Concentration & Innovation
The global baby soft carrier market exhibits a moderate to high concentration, with key players like Babycare, Sunveno, TushBaby, Bebamour, ThreeH, MiaMily, OSUKI, Ergobaby, LILLEbaby, Infantino, Baby K'tan, Bethbear, Baby Bjorn collectively holding a significant market share exceeding $200 million. Innovation is a primary driver, with companies investing heavily in ergonomic designs, advanced fabrics for breathability and comfort, and versatile carrying positions. Regulatory frameworks, particularly those related to child safety standards and material certifications, play a crucial role in shaping product development and market entry, impacting innovation cycles. Product substitutes, such as strollers and prams, offer alternative solutions for infant transportation, yet baby soft carriers maintain a distinct appeal for their portability, bonding benefits, and hands-free convenience. End-user trends indicate a growing preference for lightweight, adjustable, and aesthetically pleasing carriers, with a strong emphasis on organic and sustainable materials. Mergers and acquisitions (M&A) activity, while not dominant, has seen strategic consolidation, with estimated deal values in the range of $50 million to $100 million, aimed at expanding product portfolios and market reach.
Baby Soft Carrier Industry Trends & Insights
The baby soft carrier industry is poised for robust growth, driven by a confluence of evolving consumer lifestyles, increased awareness of infant development, and technological advancements. The market is projected to witness a Compound Annual Growth Rate (CAGR) of approximately 8.5% during the forecast period of 2025–2033. This expansion is fueled by several key trends. Firstly, the escalating demand for products that promote parent-child bonding and facilitate an active lifestyle for parents is a significant market growth driver. Modern parents, particularly millennials and Gen Z, are seeking convenience and the ability to integrate their infants into daily activities, from errands to outdoor adventures. Technological disruptions are also shaping the industry, with manufacturers incorporating innovative fabrics that offer enhanced breathability, moisture-wicking properties, and hypoallergenic qualities. The integration of smart features, though nascent, could further enhance user experience. Consumer preferences are shifting towards lightweight, easily adjustable, and ergonomically designed carriers that distribute weight evenly and support healthy infant hip development. Market penetration is steadily increasing across developed and developing economies, as awareness of the benefits of babywearing grows. The competitive dynamics are characterized by intense innovation, with companies constantly striving to differentiate their offerings through unique designs, material quality, and sustainability initiatives. Online sales channels are experiencing substantial growth, offering wider accessibility and a plethora of product choices, while offline retail continues to cater to consumers seeking a tactile shopping experience. The market penetration for specialized carriers, such as those designed for newborns or for specific activities like hiking, is also on the rise. The overall market size is projected to reach over $500 million by the end of the forecast period.
Dominant Markets & Segments in Baby Soft Carrier
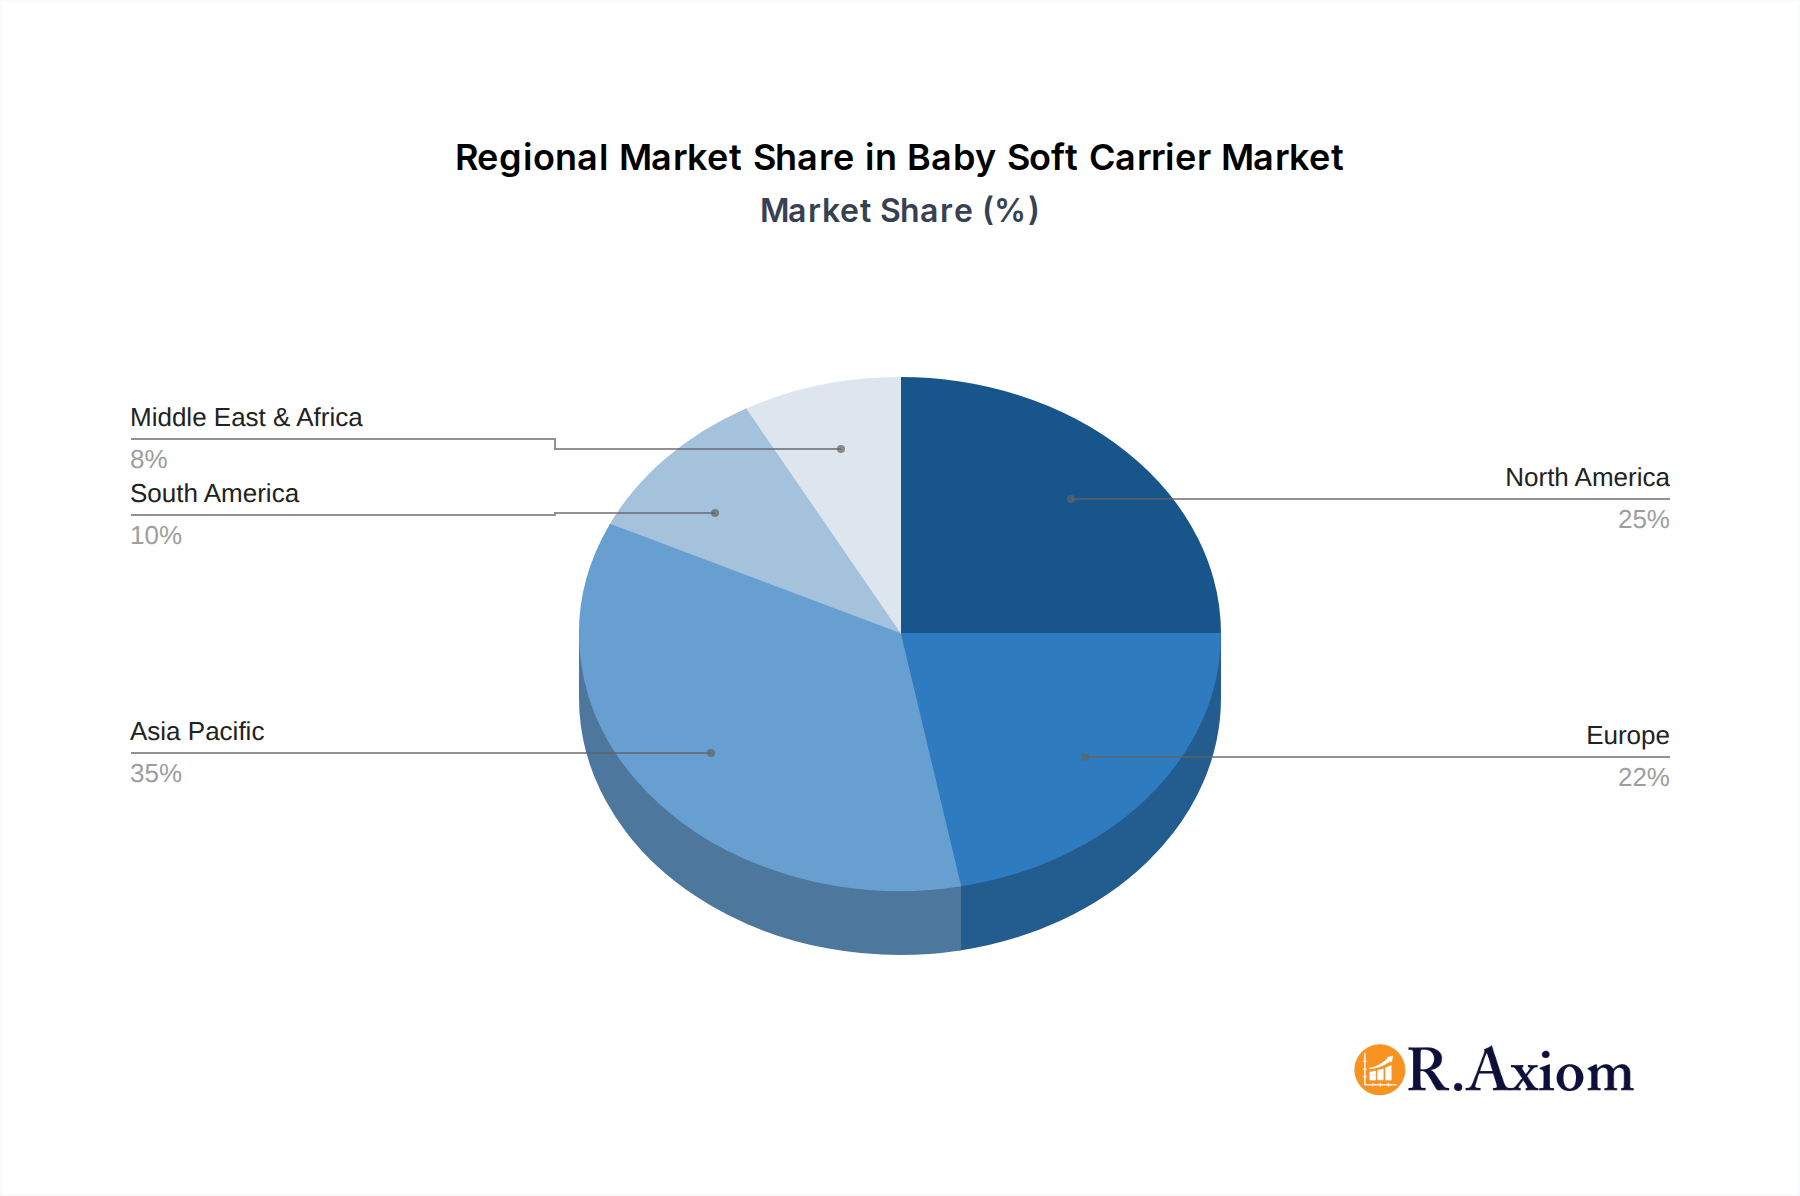
The global baby soft carrier market exhibits distinct regional dominance and segment preferences, influenced by socio-economic factors, cultural norms, and retail infrastructure.
Leading Region: North America and Europe
- Economic Policies & Infrastructure: These regions boast high disposable incomes, strong consumer spending power, and well-established retail networks, including robust online sales platforms and a significant presence of specialty baby product stores. Government initiatives promoting work-life balance and early childhood development also indirectly support the babywearing trend.
- Consumer Preferences: A strong emphasis on organic and eco-friendly products, coupled with a growing adoption of babywearing for its perceived benefits in infant development and parent-child bonding, drives demand. The active lifestyle trend further fuels the need for portable and convenient infant carrying solutions.
- Market Size and Growth: North America, particularly the United States, represents a substantial market share, estimated to be over $150 million. Europe, with countries like Germany, the UK, and France leading the way, contributes significantly, with a market size estimated to be over $120 million.
Dominant Application Segment: Online Sales
- Growth Drivers: The convenience of e-commerce platforms, wider product selection, competitive pricing, and ease of comparison have made online sales the dominant application. Digital marketing strategies and influencer endorsements further amplify reach.
- Market Penetration: Online sales account for an estimated 60% of the total market share, projected to grow at a CAGR of 9% during the forecast period. The market size for online sales is anticipated to exceed $300 million by 2033.
- Competitive Dynamics: Online retailers are fiercely competing on price, customer reviews, and delivery speed. Direct-to-consumer (DTC) models are also gaining traction.
Dominant Type Segment: Cotton
- Consumer Preference: Cotton remains a popular choice due to its natural fibers, breathability, softness, and hypoallergenic properties, making it ideal for sensitive infant skin.
- Market Share: Cotton-based baby soft carriers hold an estimated 45% market share, with a projected market size of over $225 million by 2033.
- Sustainability Appeal: The increasing demand for sustainable and eco-friendly products further bolsters the appeal of cotton.
Emerging Segment: Polyester Blends
- Technological Advancements: Innovations in polyester blends are offering enhanced durability, water resistance, and quick-drying capabilities, making them suitable for outdoor activities and varying weather conditions.
- Growth Potential: While currently holding a smaller share (estimated 25%), polyester blends are expected to witness a significant CAGR of 10% due to their performance attributes and competitive pricing. The market size for polyester blends is projected to reach over $125 million by 2033.
Baby Soft Carrier Product Developments
Recent product developments in the baby soft carrier market are characterized by a focus on enhanced comfort, adjustability, and safety. Innovations include lightweight, breathable fabrics like bamboo blends and recycled polyester, offering superior temperature regulation. Ergonomic designs that promote healthy hip alignment for infants and distribute weight evenly for parents are increasingly prevalent. Many new carriers feature multi-positional carrying options, catering to different stages of infant development and parent preferences. Competitive advantages are derived from user-friendly adjustment systems, integrated hoods for sun or sleep protection, and stylish, gender-neutral designs. The integration of sustainable materials and manufacturing processes is also a key trend, aligning with growing consumer demand for eco-conscious products.
Report Scope & Segmentation Analysis
This report provides a comprehensive analysis of the global baby soft carrier market, covering the period from 2019 to 2033. The segmentation analysis includes:
- Application: The market is segmented into Online Sales and Offline Sales. Online sales, projected to grow at a CAGR of 9% and reach over $300 million by 2033, dominate due to convenience and wider accessibility. Offline sales, while growing at a slower pace, still hold significant value, catering to consumers seeking in-person shopping experiences.
- Types: The market is segmented into Polyester, Cotton, and Others. Cotton, favored for its natural properties, holds a substantial market share (45%, over $225 million by 2033). Polyester blends are experiencing rapid growth (CAGR of 10%) due to their performance attributes, projected to reach over $125 million. The "Others" category, encompassing materials like linen and hemp, represents niche markets with specialized appeal.
Key Drivers of Baby Soft Carrier Growth
The baby soft carrier market is propelled by several key drivers. Demographic shifts, including rising birth rates in developing economies and the increasing trend of delayed parenthood, contribute to sustained demand. Growing awareness of the benefits of babywearing, such as enhanced parent-child bonding, improved infant development, and the practical advantages of hands-free mobility for parents, is a significant catalyst. Technological advancements in fabric technology, leading to lighter, more breathable, and durable carriers, enhance user comfort and product appeal. Furthermore, rising disposable incomes in emerging markets enable greater consumer spending on premium baby care products. The increasing popularity of active lifestyles among parents also fuels the demand for portable and convenient carrying solutions.
Challenges in the Baby Soft Carrier Sector
Despite its growth trajectory, the baby soft carrier sector faces several challenges. Stringent safety regulations and certification requirements in various regions can increase product development costs and time-to-market. Intense competition from established brands and new entrants leads to price pressures and necessitates continuous innovation. Supply chain disruptions, as witnessed in recent global events, can impact raw material availability and manufacturing timelines, affecting product availability and costs. Consumer education remains crucial, as incorrect usage can lead to safety concerns or discomfort for both parent and child. Lastly, the availability of affordable substitutes, such as lower-priced traditional carriers or secondhand options, can limit market expansion in price-sensitive segments.
Emerging Opportunities in Baby Soft Carrier
The baby soft carrier market is rife with emerging opportunities. The expanding e-commerce landscape in developing economies presents a vast untapped market for online sales. The growing consumer interest in sustainable and eco-friendly products creates opportunities for brands utilizing organic cotton, recycled materials, and ethical manufacturing processes. Innovation in smart carrier technology, such as integrated health monitoring or temperature control features, could cater to a tech-savvy consumer base. The development of specialized carriers for specific needs, like those for premature infants or for extended outdoor activities, offers niche market potential. Furthermore, the increasing global travel and the demand for convenient travel solutions for infants present significant growth avenues.
Leading Players in the Baby Soft Carrier Market
- Babycare
- Sunveno
- TushBaby
- Bebamour
- ThreeH
- MiaMily
- OSUKI
- Ergobaby
- LILLEbaby
- Infantino
- Baby K'tan
- Bethbear
- Baby Bjorn
Key Developments in Baby Soft Carrier Industry
- 2023/08: Ergobaby launches a new line of breathable, lightweight carriers made from sustainable materials, targeting active parents.
- 2023/05: Infantino introduces a multi-functional carrier designed to adapt to newborns through toddlers, emphasizing ease of use.
- 2023/02: LILLEbaby expands its all-season collection with enhanced features for temperature regulation and comfort.
- 2022/11: Baby K'tan releases a limited-edition designer collaboration, highlighting fashion-forward designs in soft carriers.
- 2022/07: Sunveno focuses on ergonomic design enhancements and material innovation to improve weight distribution and support.
- 2021/10: Bebamour invests in expanding its global distribution network, with a particular focus on online retail penetration.
Strategic Outlook for Baby Soft Carrier Market
The strategic outlook for the baby soft carrier market is highly positive, driven by sustained consumer demand for convenience, bonding, and an active lifestyle. Future growth will be significantly shaped by continuous innovation in ergonomic designs, sustainable materials, and enhanced comfort features. The increasing adoption of e-commerce platforms in emerging economies presents substantial expansion opportunities. Brands that can effectively leverage digital marketing, build strong online communities, and prioritize eco-friendly practices are well-positioned for success. Strategic collaborations and potential M&A activities may further consolidate market leadership and expand product portfolios, creating a dynamic and evolving landscape for baby soft carrier manufacturers and distributors.
Baby Soft Carrier Segmentation
-
1. Application
- 1.1. Online Sales
- 1.2. Offline Sales
-
2. Types
- 2.1. Polyester
- 2.2. Cotton
- 2.3. Others
Baby Soft Carrier Segmentation By Geography
-
1. North America
- 1.1. United States
- 1.2. Canada
- 1.3. Mexico
-
2. South America
- 2.1. Brazil
- 2.2. Argentina
- 2.3. Rest of South America
-
3. Europe
- 3.1. United Kingdom
- 3.2. Germany
- 3.3. France
- 3.4. Italy
- 3.5. Spain
- 3.6. Russia
- 3.7. Benelux
- 3.8. Nordics
- 3.9. Rest of Europe
-
4. Middle East & Africa
- 4.1. Turkey
- 4.2. Israel
- 4.3. GCC
- 4.4. North Africa
- 4.5. South Africa
- 4.6. Rest of Middle East & Africa
-
5. Asia Pacific
- 5.1. China
- 5.2. India
- 5.3. Japan
- 5.4. South Korea
- 5.5. ASEAN
- 5.6. Oceania
- 5.7. Rest of Asia Pacific
Baby Soft Carrier Regional Market Share
Geographic Coverage of Baby Soft Carrier
Baby Soft Carrier REPORT HIGHLIGHTS
| Aspects | Details |
|---|---|
| Study Period | 2020-2034 |
| Base Year | 2025 |
| Estimated Year | 2026 |
| Forecast Period | 2026-2034 |
| Historical Period | 2020-2025 |
| Growth Rate | CAGR of 2.5% from 2020-2034 |
| Segmentation |
|
Table of Contents
- 1. Introduction
- 1.1. Research Scope
- 1.2. Market Segmentation
- 1.3. Research Objective
- 1.4. Definitions and Assumptions
- 2. Executive Summary
- 2.1. Market Snapshot
- 3. Market Dynamics
- 3.1. Market Drivers
- 3.2. Market Restrains
- 3.3. Market Trends
- 3.4. Market Opportunities
- 4. Market Factor Analysis
- 4.1. Porters Five Forces
- 4.1.1. Bargaining Power of Suppliers
- 4.1.2. Bargaining Power of Buyers
- 4.1.3. Threat of New Entrants
- 4.1.4. Threat of Substitutes
- 4.1.5. Competitive Rivalry
- 4.2. PESTEL analysis
- 4.3. BCG Analysis
- 4.3.1. Stars (High Growth, High Market Share)
- 4.3.2. Cash Cows (Low Growth, High Market Share)
- 4.3.3. Question Mark (High Growth, Low Market Share)
- 4.3.4. Dogs (Low Growth, Low Market Share)
- 4.4. Ansoff Matrix Analysis
- 4.5. Supply Chain Analysis
- 4.6. Regulatory Landscape
- 4.7. Current Market Potential and Opportunity Assessment (TAM–SAM–SOM Framework)
- 4.8. RAX Analyst Note
- 4.1. Porters Five Forces
- 5. Market Analysis, Insights and Forecast 2021-2033
- 5.1. Market Analysis, Insights and Forecast - by Application
- 5.1.1. Online Sales
- 5.1.2. Offline Sales
- 5.2. Market Analysis, Insights and Forecast - by Types
- 5.2.1. Polyester
- 5.2.2. Cotton
- 5.2.3. Others
- 5.3. Market Analysis, Insights and Forecast - by Region
- 5.3.1. North America
- 5.3.2. South America
- 5.3.3. Europe
- 5.3.4. Middle East & Africa
- 5.3.5. Asia Pacific
- 5.1. Market Analysis, Insights and Forecast - by Application
- 6. Global Baby Soft Carrier Analysis, Insights and Forecast, 2021-2033
- 6.1. Market Analysis, Insights and Forecast - by Application
- 6.1.1. Online Sales
- 6.1.2. Offline Sales
- 6.2. Market Analysis, Insights and Forecast - by Types
- 6.2.1. Polyester
- 6.2.2. Cotton
- 6.2.3. Others
- 6.1. Market Analysis, Insights and Forecast - by Application
- 7. North America Baby Soft Carrier Analysis, Insights and Forecast, 2020-2032
- 7.1. Market Analysis, Insights and Forecast - by Application
- 7.1.1. Online Sales
- 7.1.2. Offline Sales
- 7.2. Market Analysis, Insights and Forecast - by Types
- 7.2.1. Polyester
- 7.2.2. Cotton
- 7.2.3. Others
- 7.1. Market Analysis, Insights and Forecast - by Application
- 8. South America Baby Soft Carrier Analysis, Insights and Forecast, 2020-2032
- 8.1. Market Analysis, Insights and Forecast - by Application
- 8.1.1. Online Sales
- 8.1.2. Offline Sales
- 8.2. Market Analysis, Insights and Forecast - by Types
- 8.2.1. Polyester
- 8.2.2. Cotton
- 8.2.3. Others
- 8.1. Market Analysis, Insights and Forecast - by Application
- 9. Europe Baby Soft Carrier Analysis, Insights and Forecast, 2020-2032
- 9.1. Market Analysis, Insights and Forecast - by Application
- 9.1.1. Online Sales
- 9.1.2. Offline Sales
- 9.2. Market Analysis, Insights and Forecast - by Types
- 9.2.1. Polyester
- 9.2.2. Cotton
- 9.2.3. Others
- 9.1. Market Analysis, Insights and Forecast - by Application
- 10. Middle East & Africa Baby Soft Carrier Analysis, Insights and Forecast, 2020-2032
- 10.1. Market Analysis, Insights and Forecast - by Application
- 10.1.1. Online Sales
- 10.1.2. Offline Sales
- 10.2. Market Analysis, Insights and Forecast - by Types
- 10.2.1. Polyester
- 10.2.2. Cotton
- 10.2.3. Others
- 10.1. Market Analysis, Insights and Forecast - by Application
- 11. Asia Pacific Baby Soft Carrier Analysis, Insights and Forecast, 2020-2032
- 11.1. Market Analysis, Insights and Forecast - by Application
- 11.1.1. Online Sales
- 11.1.2. Offline Sales
- 11.2. Market Analysis, Insights and Forecast - by Types
- 11.2.1. Polyester
- 11.2.2. Cotton
- 11.2.3. Others
- 11.1. Market Analysis, Insights and Forecast - by Application
- 12. Competitive Analysis
- 12.1. Company Profiles
- 12.1.1 Babycare
- 12.1.1.1. Company Overview
- 12.1.1.2. Products
- 12.1.1.3. Company Financials
- 12.1.1.4. SWOT Analysis
- 12.1.2 Sunveno
- 12.1.2.1. Company Overview
- 12.1.2.2. Products
- 12.1.2.3. Company Financials
- 12.1.2.4. SWOT Analysis
- 12.1.3 TushBaby
- 12.1.3.1. Company Overview
- 12.1.3.2. Products
- 12.1.3.3. Company Financials
- 12.1.3.4. SWOT Analysis
- 12.1.4 Bebamour
- 12.1.4.1. Company Overview
- 12.1.4.2. Products
- 12.1.4.3. Company Financials
- 12.1.4.4. SWOT Analysis
- 12.1.5 ThreeH
- 12.1.5.1. Company Overview
- 12.1.5.2. Products
- 12.1.5.3. Company Financials
- 12.1.5.4. SWOT Analysis
- 12.1.6 MiaMily
- 12.1.6.1. Company Overview
- 12.1.6.2. Products
- 12.1.6.3. Company Financials
- 12.1.6.4. SWOT Analysis
- 12.1.7 OSUKI
- 12.1.7.1. Company Overview
- 12.1.7.2. Products
- 12.1.7.3. Company Financials
- 12.1.7.4. SWOT Analysis
- 12.1.8 Ergobaby
- 12.1.8.1. Company Overview
- 12.1.8.2. Products
- 12.1.8.3. Company Financials
- 12.1.8.4. SWOT Analysis
- 12.1.9 LILLEbaby
- 12.1.9.1. Company Overview
- 12.1.9.2. Products
- 12.1.9.3. Company Financials
- 12.1.9.4. SWOT Analysis
- 12.1.10 Infantino
- 12.1.10.1. Company Overview
- 12.1.10.2. Products
- 12.1.10.3. Company Financials
- 12.1.10.4. SWOT Analysis
- 12.1.11 Baby K'tan
- 12.1.11.1. Company Overview
- 12.1.11.2. Products
- 12.1.11.3. Company Financials
- 12.1.11.4. SWOT Analysis
- 12.1.12 Bethbear
- 12.1.12.1. Company Overview
- 12.1.12.2. Products
- 12.1.12.3. Company Financials
- 12.1.12.4. SWOT Analysis
- 12.1.13 Baby Bjorn
- 12.1.13.1. Company Overview
- 12.1.13.2. Products
- 12.1.13.3. Company Financials
- 12.1.13.4. SWOT Analysis
- 12.1.1 Babycare
- 12.2. Market Entropy
- 12.2.1 Company's Key Areas Served
- 12.2.2 Recent Developments
- 12.3. Company Market Share Analysis 2025
- 12.3.1 Top 5 Companies Market Share Analysis
- 12.3.2 Top 3 Companies Market Share Analysis
- 12.4. List of Potential Customers
- 13. Research Methodology
List of Figures
- Figure 1: Global Baby Soft Carrier Revenue Breakdown (million, %) by Region 2025 & 2033
- Figure 2: Global Baby Soft Carrier Volume Breakdown (K, %) by Region 2025 & 2033
- Figure 3: North America Baby Soft Carrier Revenue (million), by Application 2025 & 2033
- Figure 4: North America Baby Soft Carrier Volume (K), by Application 2025 & 2033
- Figure 5: North America Baby Soft Carrier Revenue Share (%), by Application 2025 & 2033
- Figure 6: North America Baby Soft Carrier Volume Share (%), by Application 2025 & 2033
- Figure 7: North America Baby Soft Carrier Revenue (million), by Types 2025 & 2033
- Figure 8: North America Baby Soft Carrier Volume (K), by Types 2025 & 2033
- Figure 9: North America Baby Soft Carrier Revenue Share (%), by Types 2025 & 2033
- Figure 10: North America Baby Soft Carrier Volume Share (%), by Types 2025 & 2033
- Figure 11: North America Baby Soft Carrier Revenue (million), by Country 2025 & 2033
- Figure 12: North America Baby Soft Carrier Volume (K), by Country 2025 & 2033
- Figure 13: North America Baby Soft Carrier Revenue Share (%), by Country 2025 & 2033
- Figure 14: North America Baby Soft Carrier Volume Share (%), by Country 2025 & 2033
- Figure 15: South America Baby Soft Carrier Revenue (million), by Application 2025 & 2033
- Figure 16: South America Baby Soft Carrier Volume (K), by Application 2025 & 2033
- Figure 17: South America Baby Soft Carrier Revenue Share (%), by Application 2025 & 2033
- Figure 18: South America Baby Soft Carrier Volume Share (%), by Application 2025 & 2033
- Figure 19: South America Baby Soft Carrier Revenue (million), by Types 2025 & 2033
- Figure 20: South America Baby Soft Carrier Volume (K), by Types 2025 & 2033
- Figure 21: South America Baby Soft Carrier Revenue Share (%), by Types 2025 & 2033
- Figure 22: South America Baby Soft Carrier Volume Share (%), by Types 2025 & 2033
- Figure 23: South America Baby Soft Carrier Revenue (million), by Country 2025 & 2033
- Figure 24: South America Baby Soft Carrier Volume (K), by Country 2025 & 2033
- Figure 25: South America Baby Soft Carrier Revenue Share (%), by Country 2025 & 2033
- Figure 26: South America Baby Soft Carrier Volume Share (%), by Country 2025 & 2033
- Figure 27: Europe Baby Soft Carrier Revenue (million), by Application 2025 & 2033
- Figure 28: Europe Baby Soft Carrier Volume (K), by Application 2025 & 2033
- Figure 29: Europe Baby Soft Carrier Revenue Share (%), by Application 2025 & 2033
- Figure 30: Europe Baby Soft Carrier Volume Share (%), by Application 2025 & 2033
- Figure 31: Europe Baby Soft Carrier Revenue (million), by Types 2025 & 2033
- Figure 32: Europe Baby Soft Carrier Volume (K), by Types 2025 & 2033
- Figure 33: Europe Baby Soft Carrier Revenue Share (%), by Types 2025 & 2033
- Figure 34: Europe Baby Soft Carrier Volume Share (%), by Types 2025 & 2033
- Figure 35: Europe Baby Soft Carrier Revenue (million), by Country 2025 & 2033
- Figure 36: Europe Baby Soft Carrier Volume (K), by Country 2025 & 2033
- Figure 37: Europe Baby Soft Carrier Revenue Share (%), by Country 2025 & 2033
- Figure 38: Europe Baby Soft Carrier Volume Share (%), by Country 2025 & 2033
- Figure 39: Middle East & Africa Baby Soft Carrier Revenue (million), by Application 2025 & 2033
- Figure 40: Middle East & Africa Baby Soft Carrier Volume (K), by Application 2025 & 2033
- Figure 41: Middle East & Africa Baby Soft Carrier Revenue Share (%), by Application 2025 & 2033
- Figure 42: Middle East & Africa Baby Soft Carrier Volume Share (%), by Application 2025 & 2033
- Figure 43: Middle East & Africa Baby Soft Carrier Revenue (million), by Types 2025 & 2033
- Figure 44: Middle East & Africa Baby Soft Carrier Volume (K), by Types 2025 & 2033
- Figure 45: Middle East & Africa Baby Soft Carrier Revenue Share (%), by Types 2025 & 2033
- Figure 46: Middle East & Africa Baby Soft Carrier Volume Share (%), by Types 2025 & 2033
- Figure 47: Middle East & Africa Baby Soft Carrier Revenue (million), by Country 2025 & 2033
- Figure 48: Middle East & Africa Baby Soft Carrier Volume (K), by Country 2025 & 2033
- Figure 49: Middle East & Africa Baby Soft Carrier Revenue Share (%), by Country 2025 & 2033
- Figure 50: Middle East & Africa Baby Soft Carrier Volume Share (%), by Country 2025 & 2033
- Figure 51: Asia Pacific Baby Soft Carrier Revenue (million), by Application 2025 & 2033
- Figure 52: Asia Pacific Baby Soft Carrier Volume (K), by Application 2025 & 2033
- Figure 53: Asia Pacific Baby Soft Carrier Revenue Share (%), by Application 2025 & 2033
- Figure 54: Asia Pacific Baby Soft Carrier Volume Share (%), by Application 2025 & 2033
- Figure 55: Asia Pacific Baby Soft Carrier Revenue (million), by Types 2025 & 2033
- Figure 56: Asia Pacific Baby Soft Carrier Volume (K), by Types 2025 & 2033
- Figure 57: Asia Pacific Baby Soft Carrier Revenue Share (%), by Types 2025 & 2033
- Figure 58: Asia Pacific Baby Soft Carrier Volume Share (%), by Types 2025 & 2033
- Figure 59: Asia Pacific Baby Soft Carrier Revenue (million), by Country 2025 & 2033
- Figure 60: Asia Pacific Baby Soft Carrier Volume (K), by Country 2025 & 2033
- Figure 61: Asia Pacific Baby Soft Carrier Revenue Share (%), by Country 2025 & 2033
- Figure 62: Asia Pacific Baby Soft Carrier Volume Share (%), by Country 2025 & 2033
List of Tables
- Table 1: Global Baby Soft Carrier Revenue million Forecast, by Application 2020 & 2033
- Table 2: Global Baby Soft Carrier Volume K Forecast, by Application 2020 & 2033
- Table 3: Global Baby Soft Carrier Revenue million Forecast, by Types 2020 & 2033
- Table 4: Global Baby Soft Carrier Volume K Forecast, by Types 2020 & 2033
- Table 5: Global Baby Soft Carrier Revenue million Forecast, by Region 2020 & 2033
- Table 6: Global Baby Soft Carrier Volume K Forecast, by Region 2020 & 2033
- Table 7: Global Baby Soft Carrier Revenue million Forecast, by Application 2020 & 2033
- Table 8: Global Baby Soft Carrier Volume K Forecast, by Application 2020 & 2033
- Table 9: Global Baby Soft Carrier Revenue million Forecast, by Types 2020 & 2033
- Table 10: Global Baby Soft Carrier Volume K Forecast, by Types 2020 & 2033
- Table 11: Global Baby Soft Carrier Revenue million Forecast, by Country 2020 & 2033
- Table 12: Global Baby Soft Carrier Volume K Forecast, by Country 2020 & 2033
- Table 13: United States Baby Soft Carrier Revenue (million) Forecast, by Application 2020 & 2033
- Table 14: United States Baby Soft Carrier Volume (K) Forecast, by Application 2020 & 2033
- Table 15: Canada Baby Soft Carrier Revenue (million) Forecast, by Application 2020 & 2033
- Table 16: Canada Baby Soft Carrier Volume (K) Forecast, by Application 2020 & 2033
- Table 17: Mexico Baby Soft Carrier Revenue (million) Forecast, by Application 2020 & 2033
- Table 18: Mexico Baby Soft Carrier Volume (K) Forecast, by Application 2020 & 2033
- Table 19: Global Baby Soft Carrier Revenue million Forecast, by Application 2020 & 2033
- Table 20: Global Baby Soft Carrier Volume K Forecast, by Application 2020 & 2033
- Table 21: Global Baby Soft Carrier Revenue million Forecast, by Types 2020 & 2033
- Table 22: Global Baby Soft Carrier Volume K Forecast, by Types 2020 & 2033
- Table 23: Global Baby Soft Carrier Revenue million Forecast, by Country 2020 & 2033
- Table 24: Global Baby Soft Carrier Volume K Forecast, by Country 2020 & 2033
- Table 25: Brazil Baby Soft Carrier Revenue (million) Forecast, by Application 2020 & 2033
- Table 26: Brazil Baby Soft Carrier Volume (K) Forecast, by Application 2020 & 2033
- Table 27: Argentina Baby Soft Carrier Revenue (million) Forecast, by Application 2020 & 2033
- Table 28: Argentina Baby Soft Carrier Volume (K) Forecast, by Application 2020 & 2033
- Table 29: Rest of South America Baby Soft Carrier Revenue (million) Forecast, by Application 2020 & 2033
- Table 30: Rest of South America Baby Soft Carrier Volume (K) Forecast, by Application 2020 & 2033
- Table 31: Global Baby Soft Carrier Revenue million Forecast, by Application 2020 & 2033
- Table 32: Global Baby Soft Carrier Volume K Forecast, by Application 2020 & 2033
- Table 33: Global Baby Soft Carrier Revenue million Forecast, by Types 2020 & 2033
- Table 34: Global Baby Soft Carrier Volume K Forecast, by Types 2020 & 2033
- Table 35: Global Baby Soft Carrier Revenue million Forecast, by Country 2020 & 2033
- Table 36: Global Baby Soft Carrier Volume K Forecast, by Country 2020 & 2033
- Table 37: United Kingdom Baby Soft Carrier Revenue (million) Forecast, by Application 2020 & 2033
- Table 38: United Kingdom Baby Soft Carrier Volume (K) Forecast, by Application 2020 & 2033
- Table 39: Germany Baby Soft Carrier Revenue (million) Forecast, by Application 2020 & 2033
- Table 40: Germany Baby Soft Carrier Volume (K) Forecast, by Application 2020 & 2033
- Table 41: France Baby Soft Carrier Revenue (million) Forecast, by Application 2020 & 2033
- Table 42: France Baby Soft Carrier Volume (K) Forecast, by Application 2020 & 2033
- Table 43: Italy Baby Soft Carrier Revenue (million) Forecast, by Application 2020 & 2033
- Table 44: Italy Baby Soft Carrier Volume (K) Forecast, by Application 2020 & 2033
- Table 45: Spain Baby Soft Carrier Revenue (million) Forecast, by Application 2020 & 2033
- Table 46: Spain Baby Soft Carrier Volume (K) Forecast, by Application 2020 & 2033
- Table 47: Russia Baby Soft Carrier Revenue (million) Forecast, by Application 2020 & 2033
- Table 48: Russia Baby Soft Carrier Volume (K) Forecast, by Application 2020 & 2033
- Table 49: Benelux Baby Soft Carrier Revenue (million) Forecast, by Application 2020 & 2033
- Table 50: Benelux Baby Soft Carrier Volume (K) Forecast, by Application 2020 & 2033
- Table 51: Nordics Baby Soft Carrier Revenue (million) Forecast, by Application 2020 & 2033
- Table 52: Nordics Baby Soft Carrier Volume (K) Forecast, by Application 2020 & 2033
- Table 53: Rest of Europe Baby Soft Carrier Revenue (million) Forecast, by Application 2020 & 2033
- Table 54: Rest of Europe Baby Soft Carrier Volume (K) Forecast, by Application 2020 & 2033
- Table 55: Global Baby Soft Carrier Revenue million Forecast, by Application 2020 & 2033
- Table 56: Global Baby Soft Carrier Volume K Forecast, by Application 2020 & 2033
- Table 57: Global Baby Soft Carrier Revenue million Forecast, by Types 2020 & 2033
- Table 58: Global Baby Soft Carrier Volume K Forecast, by Types 2020 & 2033
- Table 59: Global Baby Soft Carrier Revenue million Forecast, by Country 2020 & 2033
- Table 60: Global Baby Soft Carrier Volume K Forecast, by Country 2020 & 2033
- Table 61: Turkey Baby Soft Carrier Revenue (million) Forecast, by Application 2020 & 2033
- Table 62: Turkey Baby Soft Carrier Volume (K) Forecast, by Application 2020 & 2033
- Table 63: Israel Baby Soft Carrier Revenue (million) Forecast, by Application 2020 & 2033
- Table 64: Israel Baby Soft Carrier Volume (K) Forecast, by Application 2020 & 2033
- Table 65: GCC Baby Soft Carrier Revenue (million) Forecast, by Application 2020 & 2033
- Table 66: GCC Baby Soft Carrier Volume (K) Forecast, by Application 2020 & 2033
- Table 67: North Africa Baby Soft Carrier Revenue (million) Forecast, by Application 2020 & 2033
- Table 68: North Africa Baby Soft Carrier Volume (K) Forecast, by Application 2020 & 2033
- Table 69: South Africa Baby Soft Carrier Revenue (million) Forecast, by Application 2020 & 2033
- Table 70: South Africa Baby Soft Carrier Volume (K) Forecast, by Application 2020 & 2033
- Table 71: Rest of Middle East & Africa Baby Soft Carrier Revenue (million) Forecast, by Application 2020 & 2033
- Table 72: Rest of Middle East & Africa Baby Soft Carrier Volume (K) Forecast, by Application 2020 & 2033
- Table 73: Global Baby Soft Carrier Revenue million Forecast, by Application 2020 & 2033
- Table 74: Global Baby Soft Carrier Volume K Forecast, by Application 2020 & 2033
- Table 75: Global Baby Soft Carrier Revenue million Forecast, by Types 2020 & 2033
- Table 76: Global Baby Soft Carrier Volume K Forecast, by Types 2020 & 2033
- Table 77: Global Baby Soft Carrier Revenue million Forecast, by Country 2020 & 2033
- Table 78: Global Baby Soft Carrier Volume K Forecast, by Country 2020 & 2033
- Table 79: China Baby Soft Carrier Revenue (million) Forecast, by Application 2020 & 2033
- Table 80: China Baby Soft Carrier Volume (K) Forecast, by Application 2020 & 2033
- Table 81: India Baby Soft Carrier Revenue (million) Forecast, by Application 2020 & 2033
- Table 82: India Baby Soft Carrier Volume (K) Forecast, by Application 2020 & 2033
- Table 83: Japan Baby Soft Carrier Revenue (million) Forecast, by Application 2020 & 2033
- Table 84: Japan Baby Soft Carrier Volume (K) Forecast, by Application 2020 & 2033
- Table 85: South Korea Baby Soft Carrier Revenue (million) Forecast, by Application 2020 & 2033
- Table 86: South Korea Baby Soft Carrier Volume (K) Forecast, by Application 2020 & 2033
- Table 87: ASEAN Baby Soft Carrier Revenue (million) Forecast, by Application 2020 & 2033
- Table 88: ASEAN Baby Soft Carrier Volume (K) Forecast, by Application 2020 & 2033
- Table 89: Oceania Baby Soft Carrier Revenue (million) Forecast, by Application 2020 & 2033
- Table 90: Oceania Baby Soft Carrier Volume (K) Forecast, by Application 2020 & 2033
- Table 91: Rest of Asia Pacific Baby Soft Carrier Revenue (million) Forecast, by Application 2020 & 2033
- Table 92: Rest of Asia Pacific Baby Soft Carrier Volume (K) Forecast, by Application 2020 & 2033
Frequently Asked Questions
1. What is the projected Compound Annual Growth Rate (CAGR) of the Baby Soft Carrier?
The projected CAGR is approximately 2.5%.
2. Which companies are prominent players in the Baby Soft Carrier?
Key companies in the market include Babycare, Sunveno, TushBaby, Bebamour, ThreeH, MiaMily, OSUKI, Ergobaby, LILLEbaby, Infantino, Baby K'tan, Bethbear, Baby Bjorn.
3. What are the main segments of the Baby Soft Carrier?
The market segments include Application, Types.
4. Can you provide details about the market size?
The market size is estimated to be USD 199.5 million as of 2022.
5. What are some drivers contributing to market growth?
N/A
6. What are the notable trends driving market growth?
N/A
7. Are there any restraints impacting market growth?
N/A
8. Can you provide examples of recent developments in the market?
N/A
9. What pricing options are available for accessing the report?
Pricing options include single-user, multi-user, and enterprise licenses priced at USD 3350.00, USD 5025.00, and USD 6700.00 respectively.
10. Is the market size provided in terms of value or volume?
The market size is provided in terms of value, measured in million and volume, measured in K.
11. Are there any specific market keywords associated with the report?
Yes, the market keyword associated with the report is "Baby Soft Carrier," which aids in identifying and referencing the specific market segment covered.
12. How do I determine which pricing option suits my needs best?
The pricing options vary based on user requirements and access needs. Individual users may opt for single-user licenses, while businesses requiring broader access may choose multi-user or enterprise licenses for cost-effective access to the report.
13. Are there any additional resources or data provided in the Baby Soft Carrier report?
While the report offers comprehensive insights, it's advisable to review the specific contents or supplementary materials provided to ascertain if additional resources or data are available.
14. How can I stay updated on further developments or reports in the Baby Soft Carrier?
To stay informed about further developments, trends, and reports in the Baby Soft Carrier, consider subscribing to industry newsletters, following relevant companies and organizations, or regularly checking reputable industry news sources and publications.
Methodology
Step 1 - Identification of Relevant Samples Size from Population Database


Step 2 - Approaches for Defining Global Market Size (Value, Volume* & Price*)

Note*: In applicable scenarios
Step 3 - Data Sources
Primary Research
- Web Analytics
- Survey Reports
- Research Institute
- Latest Research Reports
- Opinion Leaders
Secondary Research
- Annual Reports
- White Paper
- Latest Press Release
- Industry Association
- Paid Database
- Investor Presentations

Step 4 - Data Triangulation
Involves using different sources of information in order to increase the validity of a study
These sources are likely to be stakeholders in a program - participants, other researchers, program staff, other community members, and so on.
Then we put all data in single framework & apply various statistical tools to find out the dynamic on the market.
During the analysis stage, feedback from the stakeholder groups would be compared to determine areas of agreement as well as areas of divergence