

Key Insights
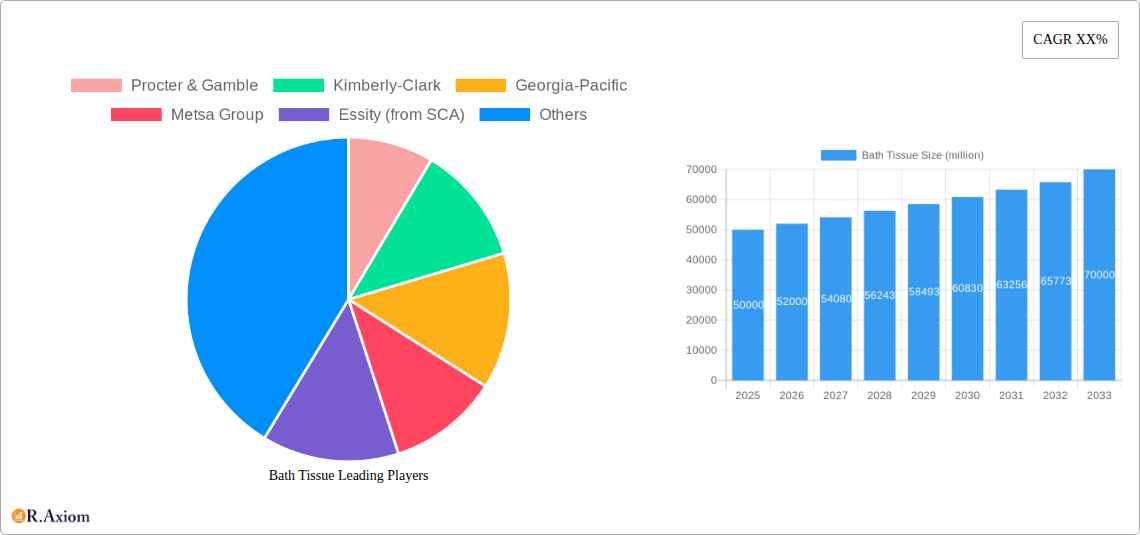
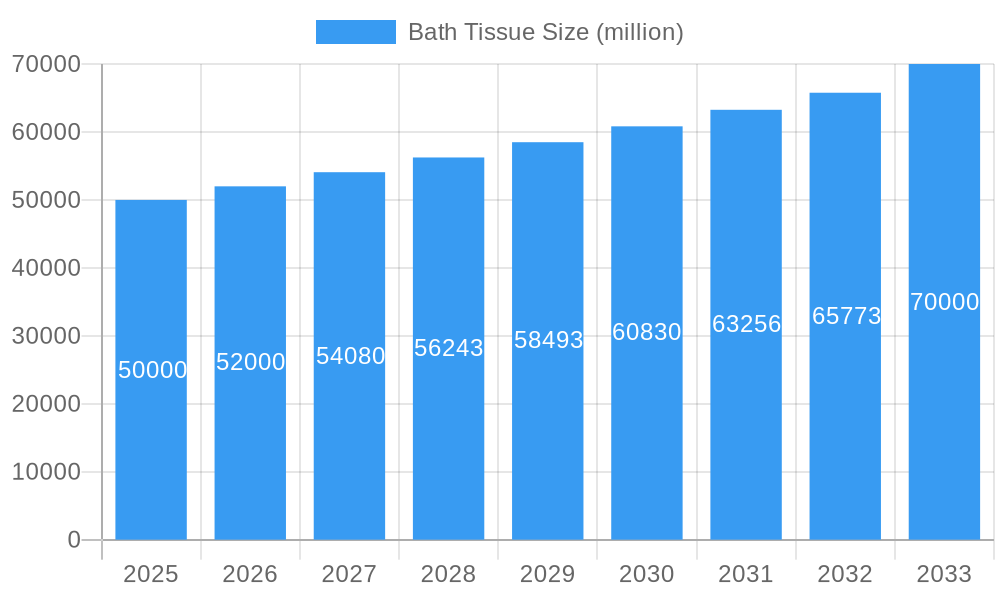
The global bath tissue market exhibits robust growth, driven by increasing disposable incomes, rising hygiene awareness, and a preference for convenient, high-quality products. The market, estimated at $50 billion in 2025, is projected to experience a Compound Annual Growth Rate (CAGR) of 4% from 2025 to 2033, reaching approximately $70 billion by 2033. Key growth drivers include the increasing adoption of premium bath tissue products, such as those offering enhanced softness, strength, and eco-friendly attributes. Expanding e-commerce channels and the rising popularity of subscription models are further fueling market expansion. However, fluctuations in raw material prices (particularly pulp) and growing environmental concerns related to deforestation and water consumption pose significant challenges to sustained growth. Market segmentation reveals a strong preference for multi-ply tissue and a growing demand for sustainable and recycled options. Leading players like Procter & Gamble, Kimberly-Clark, and Essity are investing heavily in research and development to innovate and cater to these evolving consumer preferences, incorporating features like enhanced absorbency, antibacterial properties, and reduced environmental impact.
Bath Tissue Market Size (In Billion)
Competition within the bath tissue market is intense, with established players facing pressure from smaller, regional manufacturers focused on niche segments or sustainable products. Regional variations in consumption patterns are evident, with developed economies exhibiting higher per capita consumption than developing markets. North America and Europe currently hold the largest market shares, but Asia-Pacific is anticipated to witness significant growth in the coming years driven by rising urbanization and disposable incomes. The market is witnessing the emergence of new technologies in production and packaging, with companies exploring sustainable alternatives and automated manufacturing processes to reduce costs and improve efficiency. The increasing focus on sustainability and responsible sourcing is expected to reshape the competitive landscape, favouring companies that demonstrate commitment to eco-friendly practices throughout their supply chain.
Bath Tissue Company Market Share
Bath Tissue Market Report: A Comprehensive Analysis (2019-2033)
This comprehensive report provides an in-depth analysis of the global bath tissue market, encompassing historical data (2019-2024), current estimations (2025), and future projections (2025-2033). The study covers market size, segmentation, growth drivers, challenges, competitive landscape, and emerging opportunities, offering actionable insights for industry stakeholders, investors, and businesses involved in the production, distribution, and sale of bath tissue. The report utilizes data from various sources and estimates a total market value exceeding $xx million by 2033.
Bath Tissue Market Concentration & Innovation
The global bath tissue market exhibits moderate concentration, with key players holding significant market share. Procter & Gamble, Kimberly-Clark, and Georgia-Pacific are established leaders, commanding a combined market share of approximately xx%. However, regional players and smaller companies contribute significantly to the overall market volume. Innovation within the industry centers around sustainability initiatives (recycled materials, reduced packaging), improved softness and absorbency, and the introduction of premium, value-added products. Regulatory frameworks focusing on environmental impact and product safety significantly influence market dynamics. The prevalence of private label brands acts as a key product substitute. End-user trends show a shift toward premium and eco-friendly options. M&A activity, while not rampant, demonstrates consolidation efforts with notable transactions exceeding $xx million in recent years, shaping the competitive landscape.
- Market Share (Estimated 2025): Procter & Gamble (xx%), Kimberly-Clark (xx%), Georgia-Pacific (xx%), Others (xx%)
- M&A Deal Value (2019-2024): Estimated at over $xx million
Bath Tissue Industry Trends & Insights
The bath tissue market demonstrates consistent growth, driven by increasing disposable incomes, population growth, and rising hygiene awareness, particularly in developing economies. The CAGR for the period 2025-2033 is projected at xx%, with market penetration increasing in emerging regions. Technological disruptions in manufacturing processes (automation, improved efficiency) are driving down production costs. Consumer preferences are shifting towards premium, environmentally friendly, and specialized products (e.g., hypoallergenic, sensitive skin options). Intense competition necessitates continuous product innovation, effective branding, and efficient supply chain management. The market is witnessing a rise in e-commerce sales and subscription services, changing distribution channels and customer engagement strategies.
Dominant Markets & Segments in Bath Tissue
North America currently holds the largest market share globally, driven by high per capita consumption, strong consumer demand for premium products, and established distribution networks. Key drivers for this dominance include robust economic conditions, well-developed retail infrastructure, and high awareness of hygiene standards.
- Key Drivers for North American Dominance:
- High per capita consumption
- Strong consumer disposable income
- Extensive retail network
- Well-established supply chains
- High levels of hygiene awareness
Further analysis reveals significant growth potential in Asia-Pacific and Latin America, fueled by rising middle classes, increasing urbanization, and improving hygiene infrastructure. The market is segmented by product type (e.g., rolls, sheets), material (e.g., virgin pulp, recycled pulp), and distribution channel (e.g., supermarkets, online retailers).
Bath Tissue Product Developments
Recent innovations in bath tissue focus on enhanced softness through advanced fiber technology, improved absorbency for greater efficiency, and sustainable manufacturing processes utilizing recycled materials and reduced packaging. These developments are responding to growing consumer demand for eco-friendly options and enhanced product performance. The introduction of innovative packaging formats and value-added features (e.g., embedded lotions) aims to enhance the customer experience and generate premium pricing.
Report Scope & Segmentation Analysis
This report segments the bath tissue market by region (North America, Europe, Asia-Pacific, Latin America, Middle East & Africa), product type (rolls, sheets, packs), material (virgin pulp, recycled pulp, blends), and distribution channel (supermarkets, hypermarkets, convenience stores, online retailers). Each segment is analyzed based on growth projections, market size, and competitive dynamics. Market size estimates, presented in millions of dollars, are provided for each segment across the forecast period.
Key Drivers of Bath Tissue Growth
Several factors contribute to bath tissue market growth. These include increasing disposable incomes globally, enabling greater spending on hygiene products. Rising population levels, particularly in emerging markets, create a larger consumer base. Growing awareness of hygiene and sanitation contributes to increased demand. Technological advancements in manufacturing lead to cost efficiencies and improved product quality. Finally, favorable regulatory environments promoting sustainable practices further support market expansion.
Challenges in the Bath Tissue Sector
The bath tissue industry faces challenges such as fluctuating raw material prices (pulp), particularly impacting profit margins. Stringent environmental regulations regarding waste management and sustainable sourcing necessitate significant investments. Intense competition from established players and private label brands pressures pricing strategies. Supply chain disruptions can impact production and delivery times. Furthermore, economic downturns can affect consumer purchasing behavior and dampen demand for non-essential products.
Emerging Opportunities in Bath Tissue
Emerging opportunities include expanding into untapped markets, particularly in developing economies where hygiene awareness is growing. Sustainable and eco-friendly options represent a significant growth area, catering to environmentally conscious consumers. Innovations in product design (e.g., antimicrobial properties, innovative dispensing systems) offer additional opportunities. Finally, increased focus on personalized health and hygiene creates potential for niche products and targeted marketing campaigns.
Leading Players in the Bath Tissue Market
- Procter & Gamble
- Kimberly-Clark
- Georgia-Pacific
- Metsa Group
- Essity (from SCA)
- Oji Holdings
- Cascades
- Sofidel
- Resolute (Atlas Toilet Papers)
- First Quality
- Clearwater
- Irving
- Kruger
- WEPA
- Empresas CMPC
- Hengan Group
- APP (Sinar Mas Group)
- C & S Paper
Key Developments in Bath Tissue Industry
- 2022 Q4: Kimberly-Clark launches a new line of sustainable bath tissue.
- 2023 Q1: Procter & Gamble invests in advanced manufacturing technology.
- 2023 Q3: Merger between two smaller bath tissue companies resulting in an increased market share for the combined entity.
- 2024 Q2: Georgia-Pacific introduces a new line of premium bath tissue with enhanced softness. (Further developments to be included based on data availability)
Strategic Outlook for Bath Tissue Market
The bath tissue market is poised for sustained growth over the next decade, driven by various factors such as increasing population, higher disposable incomes, and a growing focus on personal hygiene. Opportunities exist in developing regions, premium product segments, and sustainable product innovations. Companies that can adapt to evolving consumer preferences, embrace sustainability initiatives, and leverage technological advancements will be well-positioned to succeed in this dynamic market.
Bath Tissue Segmentation
-
1. Application
- 1.1. Household
- 1.2. Commercial
-
2. Types
- 2.1. Pulp Paper
- 2.2. Recycled Paper
Bath Tissue Segmentation By Geography
-
1. North America
- 1.1. United States
- 1.2. Canada
- 1.3. Mexico
-
2. South America
- 2.1. Brazil
- 2.2. Argentina
- 2.3. Rest of South America
-
3. Europe
- 3.1. United Kingdom
- 3.2. Germany
- 3.3. France
- 3.4. Italy
- 3.5. Spain
- 3.6. Russia
- 3.7. Benelux
- 3.8. Nordics
- 3.9. Rest of Europe
-
4. Middle East & Africa
- 4.1. Turkey
- 4.2. Israel
- 4.3. GCC
- 4.4. North Africa
- 4.5. South Africa
- 4.6. Rest of Middle East & Africa
-
5. Asia Pacific
- 5.1. China
- 5.2. India
- 5.3. Japan
- 5.4. South Korea
- 5.5. ASEAN
- 5.6. Oceania
- 5.7. Rest of Asia Pacific

Bath Tissue Regional Market Share
Geographic Coverage of Bath Tissue
Bath Tissue REPORT HIGHLIGHTS
| Aspects | Details |
|---|---|
| Study Period | 2020-2034 |
| Base Year | 2025 |
| Estimated Year | 2026 |
| Forecast Period | 2026-2034 |
| Historical Period | 2020-2025 |
| Growth Rate | CAGR of XX% from 2020-2034 |
| Segmentation |
|
Table of Contents
- 1. Introduction
- 1.1. Research Scope
- 1.2. Market Segmentation
- 1.3. Research Objective
- 1.4. Definitions and Assumptions
- 2. Executive Summary
- 2.1. Market Snapshot
- 3. Market Dynamics
- 3.1. Market Drivers
- 3.2. Market Restrains
- 3.3. Market Trends
- 3.4. Market Opportunities
- 4. Market Factor Analysis
- 4.1. Porters Five Forces
- 4.1.1. Bargaining Power of Suppliers
- 4.1.2. Bargaining Power of Buyers
- 4.1.3. Threat of New Entrants
- 4.1.4. Threat of Substitutes
- 4.1.5. Competitive Rivalry
- 4.2. PESTEL analysis
- 4.3. BCG Analysis
- 4.3.1. Stars (High Growth, High Market Share)
- 4.3.2. Cash Cows (Low Growth, High Market Share)
- 4.3.3. Question Mark (High Growth, Low Market Share)
- 4.3.4. Dogs (Low Growth, Low Market Share)
- 4.4. Ansoff Matrix Analysis
- 4.5. Supply Chain Analysis
- 4.6. Regulatory Landscape
- 4.7. Current Market Potential and Opportunity Assessment (TAM–SAM–SOM Framework)
- 4.8. RAX Analyst Note
- 4.1. Porters Five Forces
- 5. Market Analysis, Insights and Forecast 2021-2033
- 5.1. Market Analysis, Insights and Forecast - by Application
- 5.1.1. Household
- 5.1.2. Commercial
- 5.2. Market Analysis, Insights and Forecast - by Types
- 5.2.1. Pulp Paper
- 5.2.2. Recycled Paper
- 5.3. Market Analysis, Insights and Forecast - by Region
- 5.3.1. North America
- 5.3.2. South America
- 5.3.3. Europe
- 5.3.4. Middle East & Africa
- 5.3.5. Asia Pacific
- 5.1. Market Analysis, Insights and Forecast - by Application
- 6. Global Bath Tissue Analysis, Insights and Forecast, 2021-2033
- 6.1. Market Analysis, Insights and Forecast - by Application
- 6.1.1. Household
- 6.1.2. Commercial
- 6.2. Market Analysis, Insights and Forecast - by Types
- 6.2.1. Pulp Paper
- 6.2.2. Recycled Paper
- 6.1. Market Analysis, Insights and Forecast - by Application
- 7. North America Bath Tissue Analysis, Insights and Forecast, 2020-2032
- 7.1. Market Analysis, Insights and Forecast - by Application
- 7.1.1. Household
- 7.1.2. Commercial
- 7.2. Market Analysis, Insights and Forecast - by Types
- 7.2.1. Pulp Paper
- 7.2.2. Recycled Paper
- 7.1. Market Analysis, Insights and Forecast - by Application
- 8. South America Bath Tissue Analysis, Insights and Forecast, 2020-2032
- 8.1. Market Analysis, Insights and Forecast - by Application
- 8.1.1. Household
- 8.1.2. Commercial
- 8.2. Market Analysis, Insights and Forecast - by Types
- 8.2.1. Pulp Paper
- 8.2.2. Recycled Paper
- 8.1. Market Analysis, Insights and Forecast - by Application
- 9. Europe Bath Tissue Analysis, Insights and Forecast, 2020-2032
- 9.1. Market Analysis, Insights and Forecast - by Application
- 9.1.1. Household
- 9.1.2. Commercial
- 9.2. Market Analysis, Insights and Forecast - by Types
- 9.2.1. Pulp Paper
- 9.2.2. Recycled Paper
- 9.1. Market Analysis, Insights and Forecast - by Application
- 10. Middle East & Africa Bath Tissue Analysis, Insights and Forecast, 2020-2032
- 10.1. Market Analysis, Insights and Forecast - by Application
- 10.1.1. Household
- 10.1.2. Commercial
- 10.2. Market Analysis, Insights and Forecast - by Types
- 10.2.1. Pulp Paper
- 10.2.2. Recycled Paper
- 10.1. Market Analysis, Insights and Forecast - by Application
- 11. Asia Pacific Bath Tissue Analysis, Insights and Forecast, 2020-2032
- 11.1. Market Analysis, Insights and Forecast - by Application
- 11.1.1. Household
- 11.1.2. Commercial
- 11.2. Market Analysis, Insights and Forecast - by Types
- 11.2.1. Pulp Paper
- 11.2.2. Recycled Paper
- 11.1. Market Analysis, Insights and Forecast - by Application
- 12. Competitive Analysis
- 12.1. Company Profiles
- 12.1.1 Procter & Gamble
- 12.1.1.1. Company Overview
- 12.1.1.2. Products
- 12.1.1.3. Company Financials
- 12.1.1.4. SWOT Analysis
- 12.1.2 Kimberly-Clark
- 12.1.2.1. Company Overview
- 12.1.2.2. Products
- 12.1.2.3. Company Financials
- 12.1.2.4. SWOT Analysis
- 12.1.3 Georgia-Pacific
- 12.1.3.1. Company Overview
- 12.1.3.2. Products
- 12.1.3.3. Company Financials
- 12.1.3.4. SWOT Analysis
- 12.1.4 Metsa Group
- 12.1.4.1. Company Overview
- 12.1.4.2. Products
- 12.1.4.3. Company Financials
- 12.1.4.4. SWOT Analysis
- 12.1.5 Essity (from SCA)
- 12.1.5.1. Company Overview
- 12.1.5.2. Products
- 12.1.5.3. Company Financials
- 12.1.5.4. SWOT Analysis
- 12.1.6 Oji Holdings
- 12.1.6.1. Company Overview
- 12.1.6.2. Products
- 12.1.6.3. Company Financials
- 12.1.6.4. SWOT Analysis
- 12.1.7 Cascades
- 12.1.7.1. Company Overview
- 12.1.7.2. Products
- 12.1.7.3. Company Financials
- 12.1.7.4. SWOT Analysis
- 12.1.8 Sofidel
- 12.1.8.1. Company Overview
- 12.1.8.2. Products
- 12.1.8.3. Company Financials
- 12.1.8.4. SWOT Analysis
- 12.1.9 Resolute (Atlas Toilet Papers)
- 12.1.9.1. Company Overview
- 12.1.9.2. Products
- 12.1.9.3. Company Financials
- 12.1.9.4. SWOT Analysis
- 12.1.10 First Quality
- 12.1.10.1. Company Overview
- 12.1.10.2. Products
- 12.1.10.3. Company Financials
- 12.1.10.4. SWOT Analysis
- 12.1.11 Clearwater
- 12.1.11.1. Company Overview
- 12.1.11.2. Products
- 12.1.11.3. Company Financials
- 12.1.11.4. SWOT Analysis
- 12.1.12 Irving
- 12.1.12.1. Company Overview
- 12.1.12.2. Products
- 12.1.12.3. Company Financials
- 12.1.12.4. SWOT Analysis
- 12.1.13 Kruger
- 12.1.13.1. Company Overview
- 12.1.13.2. Products
- 12.1.13.3. Company Financials
- 12.1.13.4. SWOT Analysis
- 12.1.14 WEPA
- 12.1.14.1. Company Overview
- 12.1.14.2. Products
- 12.1.14.3. Company Financials
- 12.1.14.4. SWOT Analysis
- 12.1.15 Empresas CMPC
- 12.1.15.1. Company Overview
- 12.1.15.2. Products
- 12.1.15.3. Company Financials
- 12.1.15.4. SWOT Analysis
- 12.1.16 Hengan Group
- 12.1.16.1. Company Overview
- 12.1.16.2. Products
- 12.1.16.3. Company Financials
- 12.1.16.4. SWOT Analysis
- 12.1.17 APP (Sinar Mas Group)
- 12.1.17.1. Company Overview
- 12.1.17.2. Products
- 12.1.17.3. Company Financials
- 12.1.17.4. SWOT Analysis
- 12.1.18 C & S Paper
- 12.1.18.1. Company Overview
- 12.1.18.2. Products
- 12.1.18.3. Company Financials
- 12.1.18.4. SWOT Analysis
- 12.1.1 Procter & Gamble
- 12.2. Market Entropy
- 12.2.1 Company's Key Areas Served
- 12.2.2 Recent Developments
- 12.3. Company Market Share Analysis 2025
- 12.3.1 Top 5 Companies Market Share Analysis
- 12.3.2 Top 3 Companies Market Share Analysis
- 12.4. List of Potential Customers
- 13. Research Methodology
List of Figures
- Figure 1: Global Bath Tissue Revenue Breakdown (million, %) by Region 2025 & 2033
- Figure 2: Global Bath Tissue Volume Breakdown (K, %) by Region 2025 & 2033
- Figure 3: North America Bath Tissue Revenue (million), by Application 2025 & 2033
- Figure 4: North America Bath Tissue Volume (K), by Application 2025 & 2033
- Figure 5: North America Bath Tissue Revenue Share (%), by Application 2025 & 2033
- Figure 6: North America Bath Tissue Volume Share (%), by Application 2025 & 2033
- Figure 7: North America Bath Tissue Revenue (million), by Types 2025 & 2033
- Figure 8: North America Bath Tissue Volume (K), by Types 2025 & 2033
- Figure 9: North America Bath Tissue Revenue Share (%), by Types 2025 & 2033
- Figure 10: North America Bath Tissue Volume Share (%), by Types 2025 & 2033
- Figure 11: North America Bath Tissue Revenue (million), by Country 2025 & 2033
- Figure 12: North America Bath Tissue Volume (K), by Country 2025 & 2033
- Figure 13: North America Bath Tissue Revenue Share (%), by Country 2025 & 2033
- Figure 14: North America Bath Tissue Volume Share (%), by Country 2025 & 2033
- Figure 15: South America Bath Tissue Revenue (million), by Application 2025 & 2033
- Figure 16: South America Bath Tissue Volume (K), by Application 2025 & 2033
- Figure 17: South America Bath Tissue Revenue Share (%), by Application 2025 & 2033
- Figure 18: South America Bath Tissue Volume Share (%), by Application 2025 & 2033
- Figure 19: South America Bath Tissue Revenue (million), by Types 2025 & 2033
- Figure 20: South America Bath Tissue Volume (K), by Types 2025 & 2033
- Figure 21: South America Bath Tissue Revenue Share (%), by Types 2025 & 2033
- Figure 22: South America Bath Tissue Volume Share (%), by Types 2025 & 2033
- Figure 23: South America Bath Tissue Revenue (million), by Country 2025 & 2033
- Figure 24: South America Bath Tissue Volume (K), by Country 2025 & 2033
- Figure 25: South America Bath Tissue Revenue Share (%), by Country 2025 & 2033
- Figure 26: South America Bath Tissue Volume Share (%), by Country 2025 & 2033
- Figure 27: Europe Bath Tissue Revenue (million), by Application 2025 & 2033
- Figure 28: Europe Bath Tissue Volume (K), by Application 2025 & 2033
- Figure 29: Europe Bath Tissue Revenue Share (%), by Application 2025 & 2033
- Figure 30: Europe Bath Tissue Volume Share (%), by Application 2025 & 2033
- Figure 31: Europe Bath Tissue Revenue (million), by Types 2025 & 2033
- Figure 32: Europe Bath Tissue Volume (K), by Types 2025 & 2033
- Figure 33: Europe Bath Tissue Revenue Share (%), by Types 2025 & 2033
- Figure 34: Europe Bath Tissue Volume Share (%), by Types 2025 & 2033
- Figure 35: Europe Bath Tissue Revenue (million), by Country 2025 & 2033
- Figure 36: Europe Bath Tissue Volume (K), by Country 2025 & 2033
- Figure 37: Europe Bath Tissue Revenue Share (%), by Country 2025 & 2033
- Figure 38: Europe Bath Tissue Volume Share (%), by Country 2025 & 2033
- Figure 39: Middle East & Africa Bath Tissue Revenue (million), by Application 2025 & 2033
- Figure 40: Middle East & Africa Bath Tissue Volume (K), by Application 2025 & 2033
- Figure 41: Middle East & Africa Bath Tissue Revenue Share (%), by Application 2025 & 2033
- Figure 42: Middle East & Africa Bath Tissue Volume Share (%), by Application 2025 & 2033
- Figure 43: Middle East & Africa Bath Tissue Revenue (million), by Types 2025 & 2033
- Figure 44: Middle East & Africa Bath Tissue Volume (K), by Types 2025 & 2033
- Figure 45: Middle East & Africa Bath Tissue Revenue Share (%), by Types 2025 & 2033
- Figure 46: Middle East & Africa Bath Tissue Volume Share (%), by Types 2025 & 2033
- Figure 47: Middle East & Africa Bath Tissue Revenue (million), by Country 2025 & 2033
- Figure 48: Middle East & Africa Bath Tissue Volume (K), by Country 2025 & 2033
- Figure 49: Middle East & Africa Bath Tissue Revenue Share (%), by Country 2025 & 2033
- Figure 50: Middle East & Africa Bath Tissue Volume Share (%), by Country 2025 & 2033
- Figure 51: Asia Pacific Bath Tissue Revenue (million), by Application 2025 & 2033
- Figure 52: Asia Pacific Bath Tissue Volume (K), by Application 2025 & 2033
- Figure 53: Asia Pacific Bath Tissue Revenue Share (%), by Application 2025 & 2033
- Figure 54: Asia Pacific Bath Tissue Volume Share (%), by Application 2025 & 2033
- Figure 55: Asia Pacific Bath Tissue Revenue (million), by Types 2025 & 2033
- Figure 56: Asia Pacific Bath Tissue Volume (K), by Types 2025 & 2033
- Figure 57: Asia Pacific Bath Tissue Revenue Share (%), by Types 2025 & 2033
- Figure 58: Asia Pacific Bath Tissue Volume Share (%), by Types 2025 & 2033
- Figure 59: Asia Pacific Bath Tissue Revenue (million), by Country 2025 & 2033
- Figure 60: Asia Pacific Bath Tissue Volume (K), by Country 2025 & 2033
- Figure 61: Asia Pacific Bath Tissue Revenue Share (%), by Country 2025 & 2033
- Figure 62: Asia Pacific Bath Tissue Volume Share (%), by Country 2025 & 2033
List of Tables
- Table 1: Global Bath Tissue Revenue million Forecast, by Application 2020 & 2033
- Table 2: Global Bath Tissue Volume K Forecast, by Application 2020 & 2033
- Table 3: Global Bath Tissue Revenue million Forecast, by Types 2020 & 2033
- Table 4: Global Bath Tissue Volume K Forecast, by Types 2020 & 2033
- Table 5: Global Bath Tissue Revenue million Forecast, by Region 2020 & 2033
- Table 6: Global Bath Tissue Volume K Forecast, by Region 2020 & 2033
- Table 7: Global Bath Tissue Revenue million Forecast, by Application 2020 & 2033
- Table 8: Global Bath Tissue Volume K Forecast, by Application 2020 & 2033
- Table 9: Global Bath Tissue Revenue million Forecast, by Types 2020 & 2033
- Table 10: Global Bath Tissue Volume K Forecast, by Types 2020 & 2033
- Table 11: Global Bath Tissue Revenue million Forecast, by Country 2020 & 2033
- Table 12: Global Bath Tissue Volume K Forecast, by Country 2020 & 2033
- Table 13: United States Bath Tissue Revenue (million) Forecast, by Application 2020 & 2033
- Table 14: United States Bath Tissue Volume (K) Forecast, by Application 2020 & 2033
- Table 15: Canada Bath Tissue Revenue (million) Forecast, by Application 2020 & 2033
- Table 16: Canada Bath Tissue Volume (K) Forecast, by Application 2020 & 2033
- Table 17: Mexico Bath Tissue Revenue (million) Forecast, by Application 2020 & 2033
- Table 18: Mexico Bath Tissue Volume (K) Forecast, by Application 2020 & 2033
- Table 19: Global Bath Tissue Revenue million Forecast, by Application 2020 & 2033
- Table 20: Global Bath Tissue Volume K Forecast, by Application 2020 & 2033
- Table 21: Global Bath Tissue Revenue million Forecast, by Types 2020 & 2033
- Table 22: Global Bath Tissue Volume K Forecast, by Types 2020 & 2033
- Table 23: Global Bath Tissue Revenue million Forecast, by Country 2020 & 2033
- Table 24: Global Bath Tissue Volume K Forecast, by Country 2020 & 2033
- Table 25: Brazil Bath Tissue Revenue (million) Forecast, by Application 2020 & 2033
- Table 26: Brazil Bath Tissue Volume (K) Forecast, by Application 2020 & 2033
- Table 27: Argentina Bath Tissue Revenue (million) Forecast, by Application 2020 & 2033
- Table 28: Argentina Bath Tissue Volume (K) Forecast, by Application 2020 & 2033
- Table 29: Rest of South America Bath Tissue Revenue (million) Forecast, by Application 2020 & 2033
- Table 30: Rest of South America Bath Tissue Volume (K) Forecast, by Application 2020 & 2033
- Table 31: Global Bath Tissue Revenue million Forecast, by Application 2020 & 2033
- Table 32: Global Bath Tissue Volume K Forecast, by Application 2020 & 2033
- Table 33: Global Bath Tissue Revenue million Forecast, by Types 2020 & 2033
- Table 34: Global Bath Tissue Volume K Forecast, by Types 2020 & 2033
- Table 35: Global Bath Tissue Revenue million Forecast, by Country 2020 & 2033
- Table 36: Global Bath Tissue Volume K Forecast, by Country 2020 & 2033
- Table 37: United Kingdom Bath Tissue Revenue (million) Forecast, by Application 2020 & 2033
- Table 38: United Kingdom Bath Tissue Volume (K) Forecast, by Application 2020 & 2033
- Table 39: Germany Bath Tissue Revenue (million) Forecast, by Application 2020 & 2033
- Table 40: Germany Bath Tissue Volume (K) Forecast, by Application 2020 & 2033
- Table 41: France Bath Tissue Revenue (million) Forecast, by Application 2020 & 2033
- Table 42: France Bath Tissue Volume (K) Forecast, by Application 2020 & 2033
- Table 43: Italy Bath Tissue Revenue (million) Forecast, by Application 2020 & 2033
- Table 44: Italy Bath Tissue Volume (K) Forecast, by Application 2020 & 2033
- Table 45: Spain Bath Tissue Revenue (million) Forecast, by Application 2020 & 2033
- Table 46: Spain Bath Tissue Volume (K) Forecast, by Application 2020 & 2033
- Table 47: Russia Bath Tissue Revenue (million) Forecast, by Application 2020 & 2033
- Table 48: Russia Bath Tissue Volume (K) Forecast, by Application 2020 & 2033
- Table 49: Benelux Bath Tissue Revenue (million) Forecast, by Application 2020 & 2033
- Table 50: Benelux Bath Tissue Volume (K) Forecast, by Application 2020 & 2033
- Table 51: Nordics Bath Tissue Revenue (million) Forecast, by Application 2020 & 2033
- Table 52: Nordics Bath Tissue Volume (K) Forecast, by Application 2020 & 2033
- Table 53: Rest of Europe Bath Tissue Revenue (million) Forecast, by Application 2020 & 2033
- Table 54: Rest of Europe Bath Tissue Volume (K) Forecast, by Application 2020 & 2033
- Table 55: Global Bath Tissue Revenue million Forecast, by Application 2020 & 2033
- Table 56: Global Bath Tissue Volume K Forecast, by Application 2020 & 2033
- Table 57: Global Bath Tissue Revenue million Forecast, by Types 2020 & 2033
- Table 58: Global Bath Tissue Volume K Forecast, by Types 2020 & 2033
- Table 59: Global Bath Tissue Revenue million Forecast, by Country 2020 & 2033
- Table 60: Global Bath Tissue Volume K Forecast, by Country 2020 & 2033
- Table 61: Turkey Bath Tissue Revenue (million) Forecast, by Application 2020 & 2033
- Table 62: Turkey Bath Tissue Volume (K) Forecast, by Application 2020 & 2033
- Table 63: Israel Bath Tissue Revenue (million) Forecast, by Application 2020 & 2033
- Table 64: Israel Bath Tissue Volume (K) Forecast, by Application 2020 & 2033
- Table 65: GCC Bath Tissue Revenue (million) Forecast, by Application 2020 & 2033
- Table 66: GCC Bath Tissue Volume (K) Forecast, by Application 2020 & 2033
- Table 67: North Africa Bath Tissue Revenue (million) Forecast, by Application 2020 & 2033
- Table 68: North Africa Bath Tissue Volume (K) Forecast, by Application 2020 & 2033
- Table 69: South Africa Bath Tissue Revenue (million) Forecast, by Application 2020 & 2033
- Table 70: South Africa Bath Tissue Volume (K) Forecast, by Application 2020 & 2033
- Table 71: Rest of Middle East & Africa Bath Tissue Revenue (million) Forecast, by Application 2020 & 2033
- Table 72: Rest of Middle East & Africa Bath Tissue Volume (K) Forecast, by Application 2020 & 2033
- Table 73: Global Bath Tissue Revenue million Forecast, by Application 2020 & 2033
- Table 74: Global Bath Tissue Volume K Forecast, by Application 2020 & 2033
- Table 75: Global Bath Tissue Revenue million Forecast, by Types 2020 & 2033
- Table 76: Global Bath Tissue Volume K Forecast, by Types 2020 & 2033
- Table 77: Global Bath Tissue Revenue million Forecast, by Country 2020 & 2033
- Table 78: Global Bath Tissue Volume K Forecast, by Country 2020 & 2033
- Table 79: China Bath Tissue Revenue (million) Forecast, by Application 2020 & 2033
- Table 80: China Bath Tissue Volume (K) Forecast, by Application 2020 & 2033
- Table 81: India Bath Tissue Revenue (million) Forecast, by Application 2020 & 2033
- Table 82: India Bath Tissue Volume (K) Forecast, by Application 2020 & 2033
- Table 83: Japan Bath Tissue Revenue (million) Forecast, by Application 2020 & 2033
- Table 84: Japan Bath Tissue Volume (K) Forecast, by Application 2020 & 2033
- Table 85: South Korea Bath Tissue Revenue (million) Forecast, by Application 2020 & 2033
- Table 86: South Korea Bath Tissue Volume (K) Forecast, by Application 2020 & 2033
- Table 87: ASEAN Bath Tissue Revenue (million) Forecast, by Application 2020 & 2033
- Table 88: ASEAN Bath Tissue Volume (K) Forecast, by Application 2020 & 2033
- Table 89: Oceania Bath Tissue Revenue (million) Forecast, by Application 2020 & 2033
- Table 90: Oceania Bath Tissue Volume (K) Forecast, by Application 2020 & 2033
- Table 91: Rest of Asia Pacific Bath Tissue Revenue (million) Forecast, by Application 2020 & 2033
- Table 92: Rest of Asia Pacific Bath Tissue Volume (K) Forecast, by Application 2020 & 2033
Frequently Asked Questions
1. What is the projected Compound Annual Growth Rate (CAGR) of the Bath Tissue?
The projected CAGR is approximately XX%.
2. Which companies are prominent players in the Bath Tissue?
Key companies in the market include Procter & Gamble, Kimberly-Clark, Georgia-Pacific, Metsa Group, Essity (from SCA), Oji Holdings, Cascades, Sofidel, Resolute (Atlas Toilet Papers), First Quality, Clearwater, Irving, Kruger, WEPA, Empresas CMPC, Hengan Group, APP (Sinar Mas Group), C & S Paper.
3. What are the main segments of the Bath Tissue?
The market segments include Application, Types.
4. Can you provide details about the market size?
The market size is estimated to be USD XXX million as of 2022.
5. What are some drivers contributing to market growth?
N/A
6. What are the notable trends driving market growth?
N/A
7. Are there any restraints impacting market growth?
N/A
8. Can you provide examples of recent developments in the market?
N/A
9. What pricing options are available for accessing the report?
Pricing options include single-user, multi-user, and enterprise licenses priced at USD 3350.00, USD 5025.00, and USD 6700.00 respectively.
10. Is the market size provided in terms of value or volume?
The market size is provided in terms of value, measured in million and volume, measured in K.
11. Are there any specific market keywords associated with the report?
Yes, the market keyword associated with the report is "Bath Tissue," which aids in identifying and referencing the specific market segment covered.
12. How do I determine which pricing option suits my needs best?
The pricing options vary based on user requirements and access needs. Individual users may opt for single-user licenses, while businesses requiring broader access may choose multi-user or enterprise licenses for cost-effective access to the report.
13. Are there any additional resources or data provided in the Bath Tissue report?
While the report offers comprehensive insights, it's advisable to review the specific contents or supplementary materials provided to ascertain if additional resources or data are available.
14. How can I stay updated on further developments or reports in the Bath Tissue?
To stay informed about further developments, trends, and reports in the Bath Tissue, consider subscribing to industry newsletters, following relevant companies and organizations, or regularly checking reputable industry news sources and publications.
Methodology
Step 1 - Identification of Relevant Samples Size from Population Database


Step 2 - Approaches for Defining Global Market Size (Value, Volume* & Price*)

Note*: In applicable scenarios
Step 3 - Data Sources
Primary Research
- Web Analytics
- Survey Reports
- Research Institute
- Latest Research Reports
- Opinion Leaders
Secondary Research
- Annual Reports
- White Paper
- Latest Press Release
- Industry Association
- Paid Database
- Investor Presentations

Step 4 - Data Triangulation
Involves using different sources of information in order to increase the validity of a study
These sources are likely to be stakeholders in a program - participants, other researchers, program staff, other community members, and so on.
Then we put all data in single framework & apply various statistical tools to find out the dynamic on the market.
During the analysis stage, feedback from the stakeholder groups would be compared to determine areas of agreement as well as areas of divergence