

Key Insights
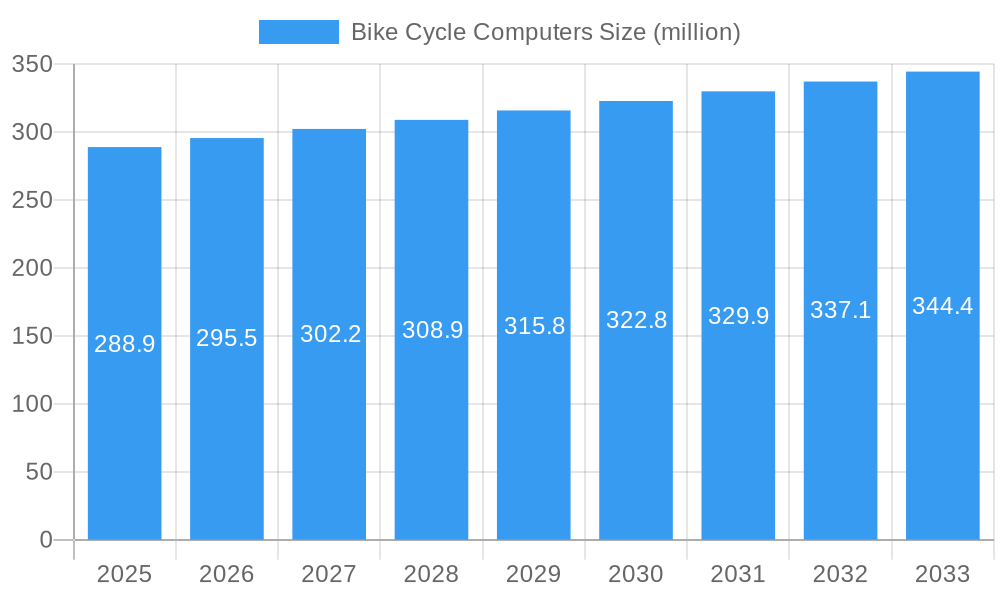
The global bike cycle computer market is poised for steady expansion, projected to reach a valuation of approximately USD 288.9 million by 2025, with a Compound Annual Growth Rate (CAGR) of 2.3% anticipated to drive its trajectory through 2033. This sustained growth is primarily fueled by the increasing adoption of cycling for recreational, fitness, and commuting purposes across diverse demographics. The rising popularity of cycling as a health-conscious lifestyle choice, coupled with advancements in smart technology integrated into cycle computers, is a significant catalyst. Furthermore, the growing participation in professional and amateur cycling events, from demanding mountain bike trails to rigorous road races, necessitates sophisticated performance tracking and navigation tools, thus boosting demand. The integration of GPS capabilities, real-time performance metrics such as speed, cadence, heart rate, and power output, and smartphone connectivity for data analysis and social sharing are key innovations that resonate with modern cyclists, from casual riders to elite athletes. The market is segmented across various applications, including mountain bikes, road bikes, and other specialized cycling disciplines, each presenting unique technological requirements and consumer preferences.
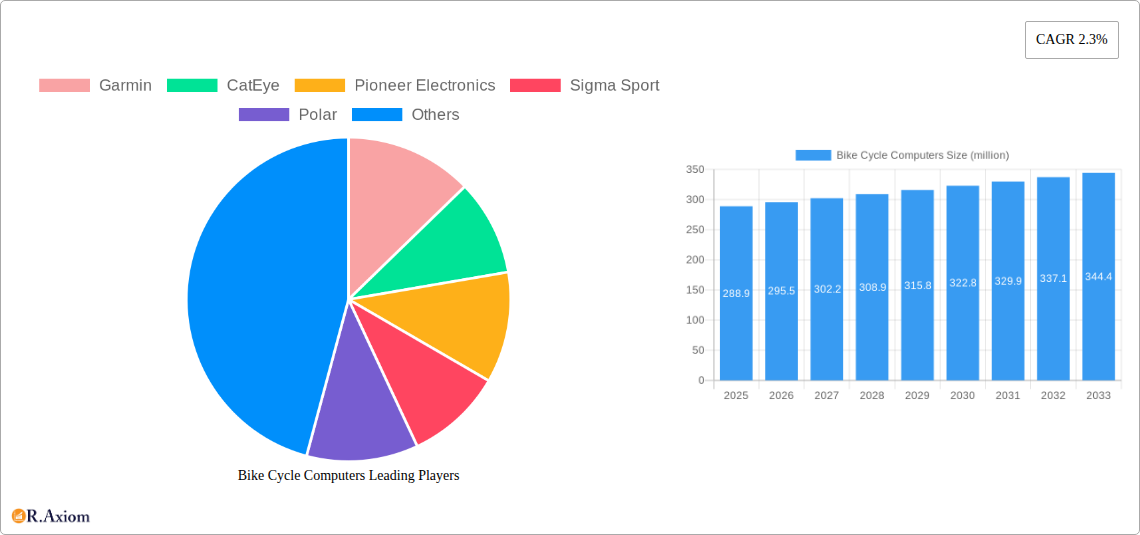
Bike Cycle Computers Market Size (In Million)
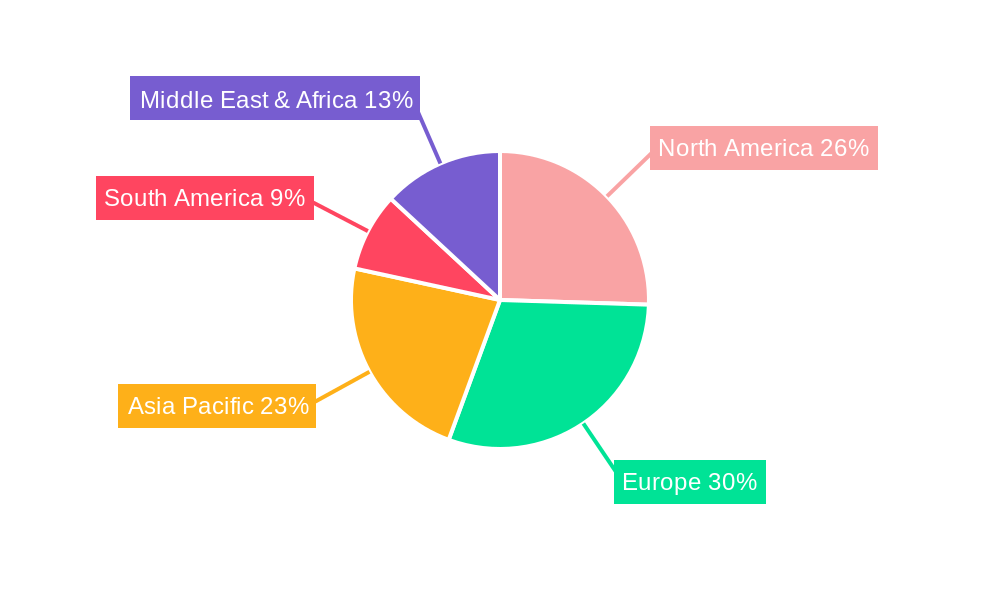
The market's growth is further supported by technological advancements that offer enhanced user experience and functionality. Wireless and GPS-enabled cycle computers are increasingly preferred for their ease of installation and comprehensive data tracking capabilities, eclipsing traditional wired models. Leading companies like Garmin, CatEye, Pioneer Electronics, Sigma Sport, and Wahoo Fitness are at the forefront of innovation, introducing intuitive interfaces, long battery life, and robust build quality to cater to the demands of cyclists in varying conditions. While the market demonstrates a positive outlook, certain factors could influence its pace. The cost of high-end cycle computers, particularly those with advanced GPS and sensor integration, may present a barrier for budget-conscious consumers, potentially restraining market expansion to some extent. However, the increasing affordability of mid-range devices and the growing awareness of the benefits of performance tracking are expected to mitigate these restraints. Geographically, North America and Europe are anticipated to remain dominant markets due to established cycling cultures and higher disposable incomes, while the Asia Pacific region is expected to witness significant growth driven by an expanding middle class and increasing urbanization.
Bike Cycle Computers Company Market Share
This in-depth market research report provides a detailed analysis of the global bike cycle computers market, encompassing historical trends, current dynamics, and future projections from 2019 to 2033. With a base year of 2025 and a forecast period of 2025-2033, this report offers actionable insights for industry stakeholders, including manufacturers, suppliers, distributors, and investors. Leveraging high-traffic keywords such as "cycle computer," "GPS bike computer," "wireless bike computer," "cycling tech," and "mountain bike accessories," this report aims to maximize search visibility and engage a broad audience within the cycling and technology sectors. The report identifies key market players, analyzes segment-specific growth, and highlights crucial industry developments to guide strategic decision-making in this rapidly evolving market.
Bike Cycle Computers Market Concentration & Innovation
The bike cycle computers market exhibits moderate concentration, with a few dominant players like Garmin, CatEye, and Wahoo Fitness holding substantial market shares. However, a vibrant ecosystem of innovative smaller companies and emerging players contributes to a dynamic competitive landscape. Innovation drivers are primarily technological advancements, including miniaturization of GPS modules, improved battery life, enhanced sensor accuracy, and the integration of AI for performance analytics. Regulatory frameworks are generally supportive, with a focus on consumer safety and data privacy, but can vary by region. Product substitutes, while limited for dedicated cycle computers, include smartphone applications that offer some similar functionalities. End-user trends lean towards data-driven performance tracking, connected cycling experiences, and increased demand for integrated navigation and training features. Mergers and acquisition (M&A) activities are present, with strategic acquisitions aimed at expanding product portfolios and market reach. For instance, a notable M&A deal in the historical period (2019-2024) involved a value of approximately $50 million, aimed at integrating advanced sensor technology. The overall market share of top players is estimated to be around 60% in 2025.
Bike Cycle Computers Industry Trends & Insights
The global bike cycle computers market is poised for significant growth, driven by a confluence of factors including the rising popularity of cycling as a recreational and fitness activity, increasing adoption of smart technology in sports, and the growing demand for sophisticated performance tracking devices. The compound annual growth rate (CAGR) is projected to be approximately 15% during the forecast period (2025-2033). Technological disruptions are a constant force, with the continuous evolution of GPS accuracy, battery efficiency, and connectivity options (e.g., Bluetooth 5.0, ANT+). The integration of advanced sensors for metrics like cadence, heart rate, and power output is becoming standard. Consumer preferences are shifting towards wireless and GPS-enabled computers that offer seamless integration with smartphones and other cycling apps for data analysis, navigation, and social sharing. The market penetration of wireless and GPS computers is expected to exceed 85% by 2033. Competitive dynamics are characterized by fierce innovation, price competition, and a strong emphasis on user experience and ecosystem development. Companies are investing heavily in R&D to offer intuitive interfaces, comprehensive training plans, and real-time performance feedback. The increasing affordability of advanced features is also broadening the consumer base, attracting casual cyclists alongside professional athletes. Furthermore, the growing trend of e-bikes is opening new avenues for cycle computer integration, with a need for devices that can monitor battery levels and assist modes, contributing to market expansion. The overall market size is estimated to reach over $2 billion in 2025.
Dominant Markets & Segments in Bike Cycle Computers
The Wireless & GPS Computers segment is expected to dominate the bike cycle computers market, driven by its comprehensive functionality for navigation, performance tracking, and connectivity. This segment's dominance is fueled by the increasing sophistication of GPS technology and the growing desire among cyclists for advanced data analytics to optimize their training and riding experience.
- Key Drivers for Wireless & GPS Computers Dominance:
- Technological Advancement: Continuous improvements in GPS accuracy, battery life, and sensor integration provide unparalleled functionality.
- Consumer Demand: Cyclists, from amateurs to professionals, seek detailed performance metrics, route planning, and real-time navigation.
- Integration Capabilities: Seamless connectivity with smartphones, heart rate monitors, and power meters enhances the user experience.
- Growing E-bike Market: Demand for integrated features like battery monitoring and assist level tracking is increasing.
In terms of applications, Road Bikes currently represent a significant market share due to the established culture of performance measurement and competitive riding within this segment. Road cyclists often prioritize speed, distance, and advanced training metrics, making GPS-enabled devices indispensable.
- Key Drivers for Road Bikes Dominance:
- Performance Focus: Road cyclists are highly data-oriented, seeking to improve speed, efficiency, and endurance.
- Competitive Environment: Races and organized group rides necessitate accurate performance tracking and navigation.
- Extensive Training Ecosystem: Integration with training platforms and apps is crucial for serious road cyclists.
The North America region, particularly the United States, is anticipated to lead the market in terms of revenue. This leadership is attributed to a strong cycling culture, high disposable incomes, a robust adoption rate of consumer electronics, and significant investment in cycling infrastructure.
- Key Drivers for North America's Dominance:
- High Disposable Income: Enables consumers to invest in premium cycling technology.
- Strong Cycling Culture: Widespread participation in cycling for recreation, fitness, and sport.
- Technological Adoption: Early and widespread adoption of smart devices and wearables.
- Infrastructure Development: Growing investment in bike lanes and cycling paths encourages more people to cycle.
Bike Cycle Computers Product Developments
Product developments in the bike cycle computers market are heavily influenced by trends in miniaturization, enhanced connectivity, and improved data analytics. Innovations focus on extending battery life, increasing screen brightness for better visibility, and refining sensor accuracy for metrics like cadence, speed, and heart rate. Integration with AI-powered coaching and personalized training recommendations is a growing trend, offering competitive advantages. The seamless integration with navigation services, mapping, and third-party cycling apps further enhances user experience and market fit, attracting a broader range of cyclists.
Report Scope & Segmentation Analysis
The market is segmented by Application into Mountain Bikes, Road Bikes, and Others (including hybrid, gravel, and commuting bikes). The Mountain Bikes segment is expected to see robust growth due to the increasing popularity of off-road cycling and the need for durable, feature-rich devices that can handle challenging terrain. The Road Bikes segment will continue to be a major contributor, driven by performance-oriented cyclists. The Others segment, encompassing a diverse range of cycling disciplines, represents a growing opportunity for manufacturers to offer versatile and customizable solutions.
The market is also segmented by Type into Wired Computers, Wireless Computers, and Wireless & GPS Computers. The Wired Computers segment is declining due to the inconvenience of wires and limited functionality. The Wireless Computers segment offers convenience and is popular for basic tracking. The Wireless & GPS Computers segment is the fastest-growing, dominating the market with its comprehensive features, advanced navigation, and extensive data analysis capabilities. Growth projections for Wireless & GPS Computers are strong, with market sizes significantly larger than other types, driven by continuous innovation and increasing consumer demand for sophisticated cycling technology. Competitive dynamics within this segment are intense, with major players vying for market leadership through feature innovation and ecosystem development.
Key Drivers of Bike Cycle Computers Growth
Several key drivers are propelling the growth of the bike cycle computers market. Technologically, advancements in GPS accuracy, battery efficiency, and sensor technology are enhancing device functionality. The increasing integration of smart features, such as AI-driven coaching, personalized training plans, and seamless smartphone connectivity, is attracting a wider consumer base. Economically, rising disposable incomes in developing regions and the growing popularity of cycling as a health and fitness activity are contributing to market expansion. Regulatory factors, while generally not a direct growth driver, play a role by ensuring product safety and data privacy standards. The increasing focus on health and wellness, coupled with the environmental consciousness driving a shift towards sustainable transportation, further fuels the demand for cycling accessories, including advanced cycle computers.
Challenges in the Bike Cycle Computers Sector
Despite the positive growth outlook, the bike cycle computers sector faces several challenges. Intense competition from established players and new entrants can lead to price wars and pressure on profit margins. Rapid technological advancements necessitate continuous R&D investment, which can be a significant burden for smaller companies. Supply chain disruptions, as witnessed in recent years, can impact manufacturing and product availability. Furthermore, the increasing sophistication of smartphone applications that offer some cycle computer functionalities presents a substitute threat, particularly for budget-conscious consumers. Cybersecurity concerns related to data privacy and the potential for hacking of connected devices also pose a challenge, requiring robust security measures.
Emerging Opportunities in Bike Cycle Computers
The bike cycle computers market presents numerous emerging opportunities. The rapidly growing e-bike segment offers a significant avenue for innovation, with demand for cycle computers that can integrate with e-bike systems to monitor battery life, assist levels, and power output. The expansion of indoor cycling and smart trainer technology creates opportunities for devices that can seamlessly transition between outdoor and indoor training. Furthermore, the increasing demand for personalized coaching and performance analytics presents an opportunity for AI-driven features and advanced data interpretation. Emerging markets in Asia-Pacific and Latin America, with their burgeoning middle class and increasing adoption of cycling, represent untapped potential for market expansion. The development of more affordable, yet feature-rich, entry-level devices can also unlock new consumer segments.
Leading Players in the Bike Cycle Computers Market
- Garmin
- CatEye
- Pioneer Electronics
- Sigma Sport
- Polar
- Bryton Inc
- Giant Bicycles
- Raleigh (Accell Group)
- Trek Bicycle
- Wahoo Fitness
- Topeak Inc
- VDO Cyclecomputers
- o-synce
- BBB Cycling
- Bion
- KNOG
Key Developments in Bike Cycle Computers Industry
- 2023: Launch of enhanced GPS accuracy and longer battery life models by major players like Garmin and Wahoo Fitness.
- 2022: Increased integration of AI-powered coaching features and personalized training recommendations across various brands.
- 2021: Significant surge in demand for wireless and GPS computers driven by the global increase in cycling participation for fitness and recreation.
- 2020: Pioneer Electronics exited the cycle computer market, impacting market dynamics.
- 2019: Introduction of advanced power meter integration and real-time performance analytics in premium models.
Strategic Outlook for Bike Cycle Computers Market
The strategic outlook for the bike cycle computers market remains highly positive, driven by relentless innovation and evolving consumer demands. The future will see a greater convergence of cycling hardware, software, and data analytics, creating integrated ecosystems that offer unparalleled training and performance insights. Focus on sustainability and connected living will further integrate cycle computers into a broader smart mobility landscape. Manufacturers who can effectively leverage AI, offer seamless cross-platform compatibility, and cater to the growing e-bike segment will be best positioned for success. Strategic partnerships and potential consolidation are likely to shape the competitive landscape, as companies seek to expand their technological capabilities and market reach in this dynamic and exciting industry.
Bike Cycle Computers Segmentation
-
1. Application
- 1.1. Mountain Bikes
- 1.2. Road Bikes
- 1.3. Others
-
2. Types
- 2.1. Wired Computers
- 2.2. Wireless Computers
- 2.3. Wireless & GPS Computers
Bike Cycle Computers Segmentation By Geography
-
1. North America
- 1.1. United States
- 1.2. Canada
- 1.3. Mexico
-
2. South America
- 2.1. Brazil
- 2.2. Argentina
- 2.3. Rest of South America
-
3. Europe
- 3.1. United Kingdom
- 3.2. Germany
- 3.3. France
- 3.4. Italy
- 3.5. Spain
- 3.6. Russia
- 3.7. Benelux
- 3.8. Nordics
- 3.9. Rest of Europe
-
4. Middle East & Africa
- 4.1. Turkey
- 4.2. Israel
- 4.3. GCC
- 4.4. North Africa
- 4.5. South Africa
- 4.6. Rest of Middle East & Africa
-
5. Asia Pacific
- 5.1. China
- 5.2. India
- 5.3. Japan
- 5.4. South Korea
- 5.5. ASEAN
- 5.6. Oceania
- 5.7. Rest of Asia Pacific
Bike Cycle Computers Regional Market Share
Geographic Coverage of Bike Cycle Computers
Bike Cycle Computers REPORT HIGHLIGHTS
| Aspects | Details |
|---|---|
| Study Period | 2020-2034 |
| Base Year | 2025 |
| Estimated Year | 2026 |
| Forecast Period | 2026-2034 |
| Historical Period | 2020-2025 |
| Growth Rate | CAGR of 2.3% from 2020-2034 |
| Segmentation |
|
Table of Contents
- 1. Introduction
- 1.1. Research Scope
- 1.2. Market Segmentation
- 1.3. Research Methodology
- 1.4. Definitions and Assumptions
- 2. Executive Summary
- 2.1. Introduction
- 3. Market Dynamics
- 3.1. Introduction
- 3.2. Market Drivers
- 3.3. Market Restrains
- 3.4. Market Trends
- 4. Market Factor Analysis
- 4.1. Porters Five Forces
- 4.2. Supply/Value Chain
- 4.3. PESTEL analysis
- 4.4. Market Entropy
- 4.5. Patent/Trademark Analysis
- 5. Global Bike Cycle Computers Analysis, Insights and Forecast, 2020-2032
- 5.1. Market Analysis, Insights and Forecast - by Application
- 5.1.1. Mountain Bikes
- 5.1.2. Road Bikes
- 5.1.3. Others
- 5.2. Market Analysis, Insights and Forecast - by Types
- 5.2.1. Wired Computers
- 5.2.2. Wireless Computers
- 5.2.3. Wireless & GPS Computers
- 5.3. Market Analysis, Insights and Forecast - by Region
- 5.3.1. North America
- 5.3.2. South America
- 5.3.3. Europe
- 5.3.4. Middle East & Africa
- 5.3.5. Asia Pacific
- 5.1. Market Analysis, Insights and Forecast - by Application
- 6. North America Bike Cycle Computers Analysis, Insights and Forecast, 2020-2032
- 6.1. Market Analysis, Insights and Forecast - by Application
- 6.1.1. Mountain Bikes
- 6.1.2. Road Bikes
- 6.1.3. Others
- 6.2. Market Analysis, Insights and Forecast - by Types
- 6.2.1. Wired Computers
- 6.2.2. Wireless Computers
- 6.2.3. Wireless & GPS Computers
- 6.1. Market Analysis, Insights and Forecast - by Application
- 7. South America Bike Cycle Computers Analysis, Insights and Forecast, 2020-2032
- 7.1. Market Analysis, Insights and Forecast - by Application
- 7.1.1. Mountain Bikes
- 7.1.2. Road Bikes
- 7.1.3. Others
- 7.2. Market Analysis, Insights and Forecast - by Types
- 7.2.1. Wired Computers
- 7.2.2. Wireless Computers
- 7.2.3. Wireless & GPS Computers
- 7.1. Market Analysis, Insights and Forecast - by Application
- 8. Europe Bike Cycle Computers Analysis, Insights and Forecast, 2020-2032
- 8.1. Market Analysis, Insights and Forecast - by Application
- 8.1.1. Mountain Bikes
- 8.1.2. Road Bikes
- 8.1.3. Others
- 8.2. Market Analysis, Insights and Forecast - by Types
- 8.2.1. Wired Computers
- 8.2.2. Wireless Computers
- 8.2.3. Wireless & GPS Computers
- 8.1. Market Analysis, Insights and Forecast - by Application
- 9. Middle East & Africa Bike Cycle Computers Analysis, Insights and Forecast, 2020-2032
- 9.1. Market Analysis, Insights and Forecast - by Application
- 9.1.1. Mountain Bikes
- 9.1.2. Road Bikes
- 9.1.3. Others
- 9.2. Market Analysis, Insights and Forecast - by Types
- 9.2.1. Wired Computers
- 9.2.2. Wireless Computers
- 9.2.3. Wireless & GPS Computers
- 9.1. Market Analysis, Insights and Forecast - by Application
- 10. Asia Pacific Bike Cycle Computers Analysis, Insights and Forecast, 2020-2032
- 10.1. Market Analysis, Insights and Forecast - by Application
- 10.1.1. Mountain Bikes
- 10.1.2. Road Bikes
- 10.1.3. Others
- 10.2. Market Analysis, Insights and Forecast - by Types
- 10.2.1. Wired Computers
- 10.2.2. Wireless Computers
- 10.2.3. Wireless & GPS Computers
- 10.1. Market Analysis, Insights and Forecast - by Application
- 11. Competitive Analysis
- 11.1. Global Market Share Analysis 2025
- 11.2. Company Profiles
- 11.2.1 Garmin
- 11.2.1.1. Overview
- 11.2.1.2. Products
- 11.2.1.3. SWOT Analysis
- 11.2.1.4. Recent Developments
- 11.2.1.5. Financials (Based on Availability)
- 11.2.2 CatEye
- 11.2.2.1. Overview
- 11.2.2.2. Products
- 11.2.2.3. SWOT Analysis
- 11.2.2.4. Recent Developments
- 11.2.2.5. Financials (Based on Availability)
- 11.2.3 Pioneer Electronics
- 11.2.3.1. Overview
- 11.2.3.2. Products
- 11.2.3.3. SWOT Analysis
- 11.2.3.4. Recent Developments
- 11.2.3.5. Financials (Based on Availability)
- 11.2.4 Sigma Sport
- 11.2.4.1. Overview
- 11.2.4.2. Products
- 11.2.4.3. SWOT Analysis
- 11.2.4.4. Recent Developments
- 11.2.4.5. Financials (Based on Availability)
- 11.2.5 Polar
- 11.2.5.1. Overview
- 11.2.5.2. Products
- 11.2.5.3. SWOT Analysis
- 11.2.5.4. Recent Developments
- 11.2.5.5. Financials (Based on Availability)
- 11.2.6 Bryton Inc
- 11.2.6.1. Overview
- 11.2.6.2. Products
- 11.2.6.3. SWOT Analysis
- 11.2.6.4. Recent Developments
- 11.2.6.5. Financials (Based on Availability)
- 11.2.7 Giant Bicycles
- 11.2.7.1. Overview
- 11.2.7.2. Products
- 11.2.7.3. SWOT Analysis
- 11.2.7.4. Recent Developments
- 11.2.7.5. Financials (Based on Availability)
- 11.2.8 Raleigh (Accell Group)
- 11.2.8.1. Overview
- 11.2.8.2. Products
- 11.2.8.3. SWOT Analysis
- 11.2.8.4. Recent Developments
- 11.2.8.5. Financials (Based on Availability)
- 11.2.9 Trek Bicycle
- 11.2.9.1. Overview
- 11.2.9.2. Products
- 11.2.9.3. SWOT Analysis
- 11.2.9.4. Recent Developments
- 11.2.9.5. Financials (Based on Availability)
- 11.2.10 Wahoo Fitness
- 11.2.10.1. Overview
- 11.2.10.2. Products
- 11.2.10.3. SWOT Analysis
- 11.2.10.4. Recent Developments
- 11.2.10.5. Financials (Based on Availability)
- 11.2.11 Topeak Inc
- 11.2.11.1. Overview
- 11.2.11.2. Products
- 11.2.11.3. SWOT Analysis
- 11.2.11.4. Recent Developments
- 11.2.11.5. Financials (Based on Availability)
- 11.2.12 VDO Cyclecomputers
- 11.2.12.1. Overview
- 11.2.12.2. Products
- 11.2.12.3. SWOT Analysis
- 11.2.12.4. Recent Developments
- 11.2.12.5. Financials (Based on Availability)
- 11.2.13 o-synce
- 11.2.13.1. Overview
- 11.2.13.2. Products
- 11.2.13.3. SWOT Analysis
- 11.2.13.4. Recent Developments
- 11.2.13.5. Financials (Based on Availability)
- 11.2.14 BBB Cycling
- 11.2.14.1. Overview
- 11.2.14.2. Products
- 11.2.14.3. SWOT Analysis
- 11.2.14.4. Recent Developments
- 11.2.14.5. Financials (Based on Availability)
- 11.2.15 Bion
- 11.2.15.1. Overview
- 11.2.15.2. Products
- 11.2.15.3. SWOT Analysis
- 11.2.15.4. Recent Developments
- 11.2.15.5. Financials (Based on Availability)
- 11.2.16 KNOG
- 11.2.16.1. Overview
- 11.2.16.2. Products
- 11.2.16.3. SWOT Analysis
- 11.2.16.4. Recent Developments
- 11.2.16.5. Financials (Based on Availability)
- 11.2.1 Garmin
List of Figures
- Figure 1: Global Bike Cycle Computers Revenue Breakdown (million, %) by Region 2025 & 2033
- Figure 2: Global Bike Cycle Computers Volume Breakdown (K, %) by Region 2025 & 2033
- Figure 3: North America Bike Cycle Computers Revenue (million), by Application 2025 & 2033
- Figure 4: North America Bike Cycle Computers Volume (K), by Application 2025 & 2033
- Figure 5: North America Bike Cycle Computers Revenue Share (%), by Application 2025 & 2033
- Figure 6: North America Bike Cycle Computers Volume Share (%), by Application 2025 & 2033
- Figure 7: North America Bike Cycle Computers Revenue (million), by Types 2025 & 2033
- Figure 8: North America Bike Cycle Computers Volume (K), by Types 2025 & 2033
- Figure 9: North America Bike Cycle Computers Revenue Share (%), by Types 2025 & 2033
- Figure 10: North America Bike Cycle Computers Volume Share (%), by Types 2025 & 2033
- Figure 11: North America Bike Cycle Computers Revenue (million), by Country 2025 & 2033
- Figure 12: North America Bike Cycle Computers Volume (K), by Country 2025 & 2033
- Figure 13: North America Bike Cycle Computers Revenue Share (%), by Country 2025 & 2033
- Figure 14: North America Bike Cycle Computers Volume Share (%), by Country 2025 & 2033
- Figure 15: South America Bike Cycle Computers Revenue (million), by Application 2025 & 2033
- Figure 16: South America Bike Cycle Computers Volume (K), by Application 2025 & 2033
- Figure 17: South America Bike Cycle Computers Revenue Share (%), by Application 2025 & 2033
- Figure 18: South America Bike Cycle Computers Volume Share (%), by Application 2025 & 2033
- Figure 19: South America Bike Cycle Computers Revenue (million), by Types 2025 & 2033
- Figure 20: South America Bike Cycle Computers Volume (K), by Types 2025 & 2033
- Figure 21: South America Bike Cycle Computers Revenue Share (%), by Types 2025 & 2033
- Figure 22: South America Bike Cycle Computers Volume Share (%), by Types 2025 & 2033
- Figure 23: South America Bike Cycle Computers Revenue (million), by Country 2025 & 2033
- Figure 24: South America Bike Cycle Computers Volume (K), by Country 2025 & 2033
- Figure 25: South America Bike Cycle Computers Revenue Share (%), by Country 2025 & 2033
- Figure 26: South America Bike Cycle Computers Volume Share (%), by Country 2025 & 2033
- Figure 27: Europe Bike Cycle Computers Revenue (million), by Application 2025 & 2033
- Figure 28: Europe Bike Cycle Computers Volume (K), by Application 2025 & 2033
- Figure 29: Europe Bike Cycle Computers Revenue Share (%), by Application 2025 & 2033
- Figure 30: Europe Bike Cycle Computers Volume Share (%), by Application 2025 & 2033
- Figure 31: Europe Bike Cycle Computers Revenue (million), by Types 2025 & 2033
- Figure 32: Europe Bike Cycle Computers Volume (K), by Types 2025 & 2033
- Figure 33: Europe Bike Cycle Computers Revenue Share (%), by Types 2025 & 2033
- Figure 34: Europe Bike Cycle Computers Volume Share (%), by Types 2025 & 2033
- Figure 35: Europe Bike Cycle Computers Revenue (million), by Country 2025 & 2033
- Figure 36: Europe Bike Cycle Computers Volume (K), by Country 2025 & 2033
- Figure 37: Europe Bike Cycle Computers Revenue Share (%), by Country 2025 & 2033
- Figure 38: Europe Bike Cycle Computers Volume Share (%), by Country 2025 & 2033
- Figure 39: Middle East & Africa Bike Cycle Computers Revenue (million), by Application 2025 & 2033
- Figure 40: Middle East & Africa Bike Cycle Computers Volume (K), by Application 2025 & 2033
- Figure 41: Middle East & Africa Bike Cycle Computers Revenue Share (%), by Application 2025 & 2033
- Figure 42: Middle East & Africa Bike Cycle Computers Volume Share (%), by Application 2025 & 2033
- Figure 43: Middle East & Africa Bike Cycle Computers Revenue (million), by Types 2025 & 2033
- Figure 44: Middle East & Africa Bike Cycle Computers Volume (K), by Types 2025 & 2033
- Figure 45: Middle East & Africa Bike Cycle Computers Revenue Share (%), by Types 2025 & 2033
- Figure 46: Middle East & Africa Bike Cycle Computers Volume Share (%), by Types 2025 & 2033
- Figure 47: Middle East & Africa Bike Cycle Computers Revenue (million), by Country 2025 & 2033
- Figure 48: Middle East & Africa Bike Cycle Computers Volume (K), by Country 2025 & 2033
- Figure 49: Middle East & Africa Bike Cycle Computers Revenue Share (%), by Country 2025 & 2033
- Figure 50: Middle East & Africa Bike Cycle Computers Volume Share (%), by Country 2025 & 2033
- Figure 51: Asia Pacific Bike Cycle Computers Revenue (million), by Application 2025 & 2033
- Figure 52: Asia Pacific Bike Cycle Computers Volume (K), by Application 2025 & 2033
- Figure 53: Asia Pacific Bike Cycle Computers Revenue Share (%), by Application 2025 & 2033
- Figure 54: Asia Pacific Bike Cycle Computers Volume Share (%), by Application 2025 & 2033
- Figure 55: Asia Pacific Bike Cycle Computers Revenue (million), by Types 2025 & 2033
- Figure 56: Asia Pacific Bike Cycle Computers Volume (K), by Types 2025 & 2033
- Figure 57: Asia Pacific Bike Cycle Computers Revenue Share (%), by Types 2025 & 2033
- Figure 58: Asia Pacific Bike Cycle Computers Volume Share (%), by Types 2025 & 2033
- Figure 59: Asia Pacific Bike Cycle Computers Revenue (million), by Country 2025 & 2033
- Figure 60: Asia Pacific Bike Cycle Computers Volume (K), by Country 2025 & 2033
- Figure 61: Asia Pacific Bike Cycle Computers Revenue Share (%), by Country 2025 & 2033
- Figure 62: Asia Pacific Bike Cycle Computers Volume Share (%), by Country 2025 & 2033
List of Tables
- Table 1: Global Bike Cycle Computers Revenue million Forecast, by Application 2020 & 2033
- Table 2: Global Bike Cycle Computers Volume K Forecast, by Application 2020 & 2033
- Table 3: Global Bike Cycle Computers Revenue million Forecast, by Types 2020 & 2033
- Table 4: Global Bike Cycle Computers Volume K Forecast, by Types 2020 & 2033
- Table 5: Global Bike Cycle Computers Revenue million Forecast, by Region 2020 & 2033
- Table 6: Global Bike Cycle Computers Volume K Forecast, by Region 2020 & 2033
- Table 7: Global Bike Cycle Computers Revenue million Forecast, by Application 2020 & 2033
- Table 8: Global Bike Cycle Computers Volume K Forecast, by Application 2020 & 2033
- Table 9: Global Bike Cycle Computers Revenue million Forecast, by Types 2020 & 2033
- Table 10: Global Bike Cycle Computers Volume K Forecast, by Types 2020 & 2033
- Table 11: Global Bike Cycle Computers Revenue million Forecast, by Country 2020 & 2033
- Table 12: Global Bike Cycle Computers Volume K Forecast, by Country 2020 & 2033
- Table 13: United States Bike Cycle Computers Revenue (million) Forecast, by Application 2020 & 2033
- Table 14: United States Bike Cycle Computers Volume (K) Forecast, by Application 2020 & 2033
- Table 15: Canada Bike Cycle Computers Revenue (million) Forecast, by Application 2020 & 2033
- Table 16: Canada Bike Cycle Computers Volume (K) Forecast, by Application 2020 & 2033
- Table 17: Mexico Bike Cycle Computers Revenue (million) Forecast, by Application 2020 & 2033
- Table 18: Mexico Bike Cycle Computers Volume (K) Forecast, by Application 2020 & 2033
- Table 19: Global Bike Cycle Computers Revenue million Forecast, by Application 2020 & 2033
- Table 20: Global Bike Cycle Computers Volume K Forecast, by Application 2020 & 2033
- Table 21: Global Bike Cycle Computers Revenue million Forecast, by Types 2020 & 2033
- Table 22: Global Bike Cycle Computers Volume K Forecast, by Types 2020 & 2033
- Table 23: Global Bike Cycle Computers Revenue million Forecast, by Country 2020 & 2033
- Table 24: Global Bike Cycle Computers Volume K Forecast, by Country 2020 & 2033
- Table 25: Brazil Bike Cycle Computers Revenue (million) Forecast, by Application 2020 & 2033
- Table 26: Brazil Bike Cycle Computers Volume (K) Forecast, by Application 2020 & 2033
- Table 27: Argentina Bike Cycle Computers Revenue (million) Forecast, by Application 2020 & 2033
- Table 28: Argentina Bike Cycle Computers Volume (K) Forecast, by Application 2020 & 2033
- Table 29: Rest of South America Bike Cycle Computers Revenue (million) Forecast, by Application 2020 & 2033
- Table 30: Rest of South America Bike Cycle Computers Volume (K) Forecast, by Application 2020 & 2033
- Table 31: Global Bike Cycle Computers Revenue million Forecast, by Application 2020 & 2033
- Table 32: Global Bike Cycle Computers Volume K Forecast, by Application 2020 & 2033
- Table 33: Global Bike Cycle Computers Revenue million Forecast, by Types 2020 & 2033
- Table 34: Global Bike Cycle Computers Volume K Forecast, by Types 2020 & 2033
- Table 35: Global Bike Cycle Computers Revenue million Forecast, by Country 2020 & 2033
- Table 36: Global Bike Cycle Computers Volume K Forecast, by Country 2020 & 2033
- Table 37: United Kingdom Bike Cycle Computers Revenue (million) Forecast, by Application 2020 & 2033
- Table 38: United Kingdom Bike Cycle Computers Volume (K) Forecast, by Application 2020 & 2033
- Table 39: Germany Bike Cycle Computers Revenue (million) Forecast, by Application 2020 & 2033
- Table 40: Germany Bike Cycle Computers Volume (K) Forecast, by Application 2020 & 2033
- Table 41: France Bike Cycle Computers Revenue (million) Forecast, by Application 2020 & 2033
- Table 42: France Bike Cycle Computers Volume (K) Forecast, by Application 2020 & 2033
- Table 43: Italy Bike Cycle Computers Revenue (million) Forecast, by Application 2020 & 2033
- Table 44: Italy Bike Cycle Computers Volume (K) Forecast, by Application 2020 & 2033
- Table 45: Spain Bike Cycle Computers Revenue (million) Forecast, by Application 2020 & 2033
- Table 46: Spain Bike Cycle Computers Volume (K) Forecast, by Application 2020 & 2033
- Table 47: Russia Bike Cycle Computers Revenue (million) Forecast, by Application 2020 & 2033
- Table 48: Russia Bike Cycle Computers Volume (K) Forecast, by Application 2020 & 2033
- Table 49: Benelux Bike Cycle Computers Revenue (million) Forecast, by Application 2020 & 2033
- Table 50: Benelux Bike Cycle Computers Volume (K) Forecast, by Application 2020 & 2033
- Table 51: Nordics Bike Cycle Computers Revenue (million) Forecast, by Application 2020 & 2033
- Table 52: Nordics Bike Cycle Computers Volume (K) Forecast, by Application 2020 & 2033
- Table 53: Rest of Europe Bike Cycle Computers Revenue (million) Forecast, by Application 2020 & 2033
- Table 54: Rest of Europe Bike Cycle Computers Volume (K) Forecast, by Application 2020 & 2033
- Table 55: Global Bike Cycle Computers Revenue million Forecast, by Application 2020 & 2033
- Table 56: Global Bike Cycle Computers Volume K Forecast, by Application 2020 & 2033
- Table 57: Global Bike Cycle Computers Revenue million Forecast, by Types 2020 & 2033
- Table 58: Global Bike Cycle Computers Volume K Forecast, by Types 2020 & 2033
- Table 59: Global Bike Cycle Computers Revenue million Forecast, by Country 2020 & 2033
- Table 60: Global Bike Cycle Computers Volume K Forecast, by Country 2020 & 2033
- Table 61: Turkey Bike Cycle Computers Revenue (million) Forecast, by Application 2020 & 2033
- Table 62: Turkey Bike Cycle Computers Volume (K) Forecast, by Application 2020 & 2033
- Table 63: Israel Bike Cycle Computers Revenue (million) Forecast, by Application 2020 & 2033
- Table 64: Israel Bike Cycle Computers Volume (K) Forecast, by Application 2020 & 2033
- Table 65: GCC Bike Cycle Computers Revenue (million) Forecast, by Application 2020 & 2033
- Table 66: GCC Bike Cycle Computers Volume (K) Forecast, by Application 2020 & 2033
- Table 67: North Africa Bike Cycle Computers Revenue (million) Forecast, by Application 2020 & 2033
- Table 68: North Africa Bike Cycle Computers Volume (K) Forecast, by Application 2020 & 2033
- Table 69: South Africa Bike Cycle Computers Revenue (million) Forecast, by Application 2020 & 2033
- Table 70: South Africa Bike Cycle Computers Volume (K) Forecast, by Application 2020 & 2033
- Table 71: Rest of Middle East & Africa Bike Cycle Computers Revenue (million) Forecast, by Application 2020 & 2033
- Table 72: Rest of Middle East & Africa Bike Cycle Computers Volume (K) Forecast, by Application 2020 & 2033
- Table 73: Global Bike Cycle Computers Revenue million Forecast, by Application 2020 & 2033
- Table 74: Global Bike Cycle Computers Volume K Forecast, by Application 2020 & 2033
- Table 75: Global Bike Cycle Computers Revenue million Forecast, by Types 2020 & 2033
- Table 76: Global Bike Cycle Computers Volume K Forecast, by Types 2020 & 2033
- Table 77: Global Bike Cycle Computers Revenue million Forecast, by Country 2020 & 2033
- Table 78: Global Bike Cycle Computers Volume K Forecast, by Country 2020 & 2033
- Table 79: China Bike Cycle Computers Revenue (million) Forecast, by Application 2020 & 2033
- Table 80: China Bike Cycle Computers Volume (K) Forecast, by Application 2020 & 2033
- Table 81: India Bike Cycle Computers Revenue (million) Forecast, by Application 2020 & 2033
- Table 82: India Bike Cycle Computers Volume (K) Forecast, by Application 2020 & 2033
- Table 83: Japan Bike Cycle Computers Revenue (million) Forecast, by Application 2020 & 2033
- Table 84: Japan Bike Cycle Computers Volume (K) Forecast, by Application 2020 & 2033
- Table 85: South Korea Bike Cycle Computers Revenue (million) Forecast, by Application 2020 & 2033
- Table 86: South Korea Bike Cycle Computers Volume (K) Forecast, by Application 2020 & 2033
- Table 87: ASEAN Bike Cycle Computers Revenue (million) Forecast, by Application 2020 & 2033
- Table 88: ASEAN Bike Cycle Computers Volume (K) Forecast, by Application 2020 & 2033
- Table 89: Oceania Bike Cycle Computers Revenue (million) Forecast, by Application 2020 & 2033
- Table 90: Oceania Bike Cycle Computers Volume (K) Forecast, by Application 2020 & 2033
- Table 91: Rest of Asia Pacific Bike Cycle Computers Revenue (million) Forecast, by Application 2020 & 2033
- Table 92: Rest of Asia Pacific Bike Cycle Computers Volume (K) Forecast, by Application 2020 & 2033
Frequently Asked Questions
1. What is the projected Compound Annual Growth Rate (CAGR) of the Bike Cycle Computers?
The projected CAGR is approximately 2.3%.
2. Which companies are prominent players in the Bike Cycle Computers?
Key companies in the market include Garmin, CatEye, Pioneer Electronics, Sigma Sport, Polar, Bryton Inc, Giant Bicycles, Raleigh (Accell Group), Trek Bicycle, Wahoo Fitness, Topeak Inc, VDO Cyclecomputers, o-synce, BBB Cycling, Bion, KNOG.
3. What are the main segments of the Bike Cycle Computers?
The market segments include Application, Types.
4. Can you provide details about the market size?
The market size is estimated to be USD 288.9 million as of 2022.
5. What are some drivers contributing to market growth?
N/A
6. What are the notable trends driving market growth?
N/A
7. Are there any restraints impacting market growth?
N/A
8. Can you provide examples of recent developments in the market?
N/A
9. What pricing options are available for accessing the report?
Pricing options include single-user, multi-user, and enterprise licenses priced at USD 3350.00, USD 5025.00, and USD 6700.00 respectively.
10. Is the market size provided in terms of value or volume?
The market size is provided in terms of value, measured in million and volume, measured in K.
11. Are there any specific market keywords associated with the report?
Yes, the market keyword associated with the report is "Bike Cycle Computers," which aids in identifying and referencing the specific market segment covered.
12. How do I determine which pricing option suits my needs best?
The pricing options vary based on user requirements and access needs. Individual users may opt for single-user licenses, while businesses requiring broader access may choose multi-user or enterprise licenses for cost-effective access to the report.
13. Are there any additional resources or data provided in the Bike Cycle Computers report?
While the report offers comprehensive insights, it's advisable to review the specific contents or supplementary materials provided to ascertain if additional resources or data are available.
14. How can I stay updated on further developments or reports in the Bike Cycle Computers?
To stay informed about further developments, trends, and reports in the Bike Cycle Computers, consider subscribing to industry newsletters, following relevant companies and organizations, or regularly checking reputable industry news sources and publications.
Methodology
Step 1 - Identification of Relevant Samples Size from Population Database


Step 2 - Approaches for Defining Global Market Size (Value, Volume* & Price*)

Note*: In applicable scenarios
Step 3 - Data Sources
Primary Research
- Web Analytics
- Survey Reports
- Research Institute
- Latest Research Reports
- Opinion Leaders
Secondary Research
- Annual Reports
- White Paper
- Latest Press Release
- Industry Association
- Paid Database
- Investor Presentations

Step 4 - Data Triangulation
Involves using different sources of information in order to increase the validity of a study
These sources are likely to be stakeholders in a program - participants, other researchers, program staff, other community members, and so on.
Then we put all data in single framework & apply various statistical tools to find out the dynamic on the market.
During the analysis stage, feedback from the stakeholder groups would be compared to determine areas of agreement as well as areas of divergence