

Key Insights
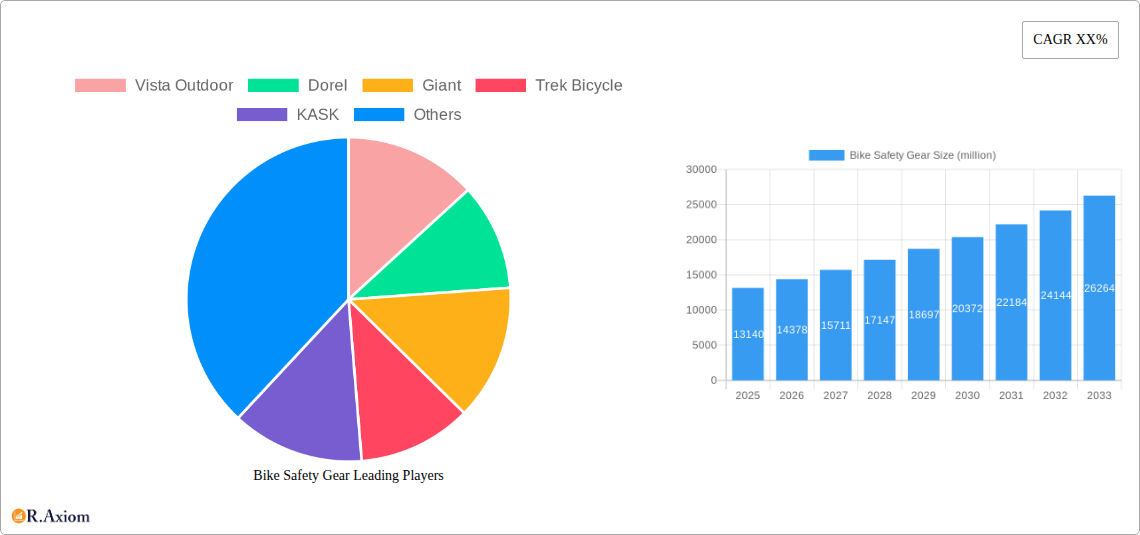
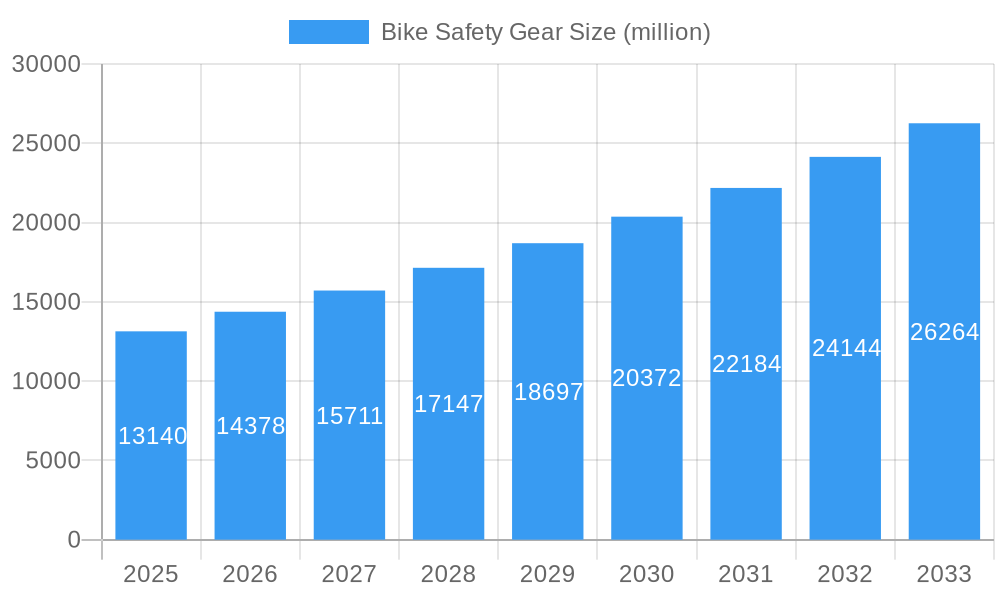
The global Bike Safety Gear market is poised for robust growth, projected to reach approximately $13.14 billion by 2025. This expansion is fueled by a significant compound annual growth rate (CAGR) of 9.47% projected from 2025 to 2033. A primary driver for this impressive trajectory is the escalating global awareness of cycling safety, spurred by increased participation in cycling for both recreation and commuting, and a growing number of reported cycling-related incidents. Government initiatives promoting cycling infrastructure and safety regulations further bolster market demand. Additionally, technological advancements in materials science are leading to lighter, more durable, and feature-rich safety equipment, appealing to a wider consumer base. The growing trend of e-bikes, which can reach higher speeds, also necessitates enhanced safety measures, creating a consistent demand for advanced protective gear.
Bike Safety Gear Market Size (In Billion)
The market is segmented across various applications, with Online Stores and Hypermarkets/Supermarkets expected to dominate sales channels due to their accessibility and competitive pricing. Specialty Stores will cater to niche markets and high-end consumers seeking premium products. In terms of product types, Helmets and Mouth Guards remain fundamental protective items, while Reflectors and Lights are gaining prominence due to their crucial role in low-visibility conditions. The increasing adoption of cycling as a sustainable and healthy lifestyle choice, coupled with rising disposable incomes in emerging economies, will continue to drive market penetration. However, challenges such as the high initial cost of premium safety gear and the availability of counterfeit products in some regions might temper growth. Despite these restraints, the overwhelming focus on rider well-being and the continuous innovation within the industry point towards a highly promising future for the Bike Safety Gear market.
Bike Safety Gear Company Market Share
Bike Safety Gear Market Concentration & Innovation
The global bike safety gear market exhibits a moderate concentration, with key players like Vista Outdoor, Dorel, Giant, and Trek Bicycle holding significant market share. In the historical period (2019-2024), M&A activities were substantial, with an estimated deal value of over $2.5 billion, aimed at consolidating market presence and expanding product portfolios. Innovation remains a critical driver, with advancements in material science, smart technology integration, and ergonomic design continually shaping product offerings. Regulatory frameworks, particularly in developed regions, mandate certain safety standards, pushing manufacturers like KASK and MET to prioritize compliance and certifications. The prevalence of product substitutes, ranging from everyday athletic wear adapted for cycling to increasingly sophisticated integrated protective systems, necessitates continuous product differentiation. End-user trends reveal a growing demand for lightweight, breathable, and aesthetically appealing safety gear, particularly among recreational cyclists and commuters. This shift is prompting companies such as Specialized and Scott Sports to invest heavily in R&D to meet these evolving consumer preferences.
Bike Safety Gear Industry Trends & Insights
The bike safety gear industry is poised for significant expansion, driven by a confluence of factors that are reshaping consumer behavior and market dynamics. A primary growth driver is the escalating global awareness regarding cycling safety, fueled by a surge in cycling participation for both recreational purposes and daily commuting. This heightened awareness is directly translating into increased consumer spending on essential protective equipment. The market penetration of specialized bike safety gear is steadily rising, particularly in urban areas where cycling infrastructure is improving and government initiatives promote cycling as a sustainable transportation mode. Technological disruptions are playing a pivotal role in this evolution. The integration of smart technologies, such as integrated lighting systems, impact sensors, and communication devices within helmets, is creating new product categories and enhancing the perceived value of safety gear. For instance, innovations by companies like CatEye and SIGMA SPORT in smart lighting solutions are not only improving visibility but also offering data-driven insights to riders.
Consumer preferences are increasingly leaning towards products that offer a blend of superior protection, comfort, and style. This trend is evident in the growing demand for aerodynamic helmets, impact-resistant gloves with enhanced grip, and reflective apparel that offers both safety and fashionable aesthetics. Brands like Rudy Project and GUB are capitalizing on this by offering stylish yet highly protective eyewear and helmets. The competitive landscape is dynamic, characterized by both established global players and emerging regional manufacturers. This competition fosters innovation and drives down prices, making safety gear more accessible to a wider consumer base. The compound annual growth rate (CAGR) for the bike safety gear market is projected to be robust, estimated at approximately 7.8% from 2025 to 2033, indicating a healthy and expanding market. This growth is underpinned by the continuous influx of new products and the sustained efforts by industry stakeholders to educate consumers on the importance of adequate protection. The increasing adoption of e-bikes also contributes to this trend, as they enable riders to travel at higher speeds, thereby increasing the perceived need for enhanced safety measures. Furthermore, the growing emphasis on health and wellness, coupled with environmental concerns, is encouraging more individuals to embrace cycling, directly benefiting the bike safety gear sector. The market's trajectory is further bolstered by the expanding reach of online retail channels, making it easier for consumers worldwide to access a diverse range of safety products from brands like Topeak and Planet Bike.
Dominant Markets & Segments in Bike Safety Gear
The dominance in the bike safety gear market is multifaceted, influenced by regional economic conditions, regulatory landscapes, and evolving consumer preferences across various segments.
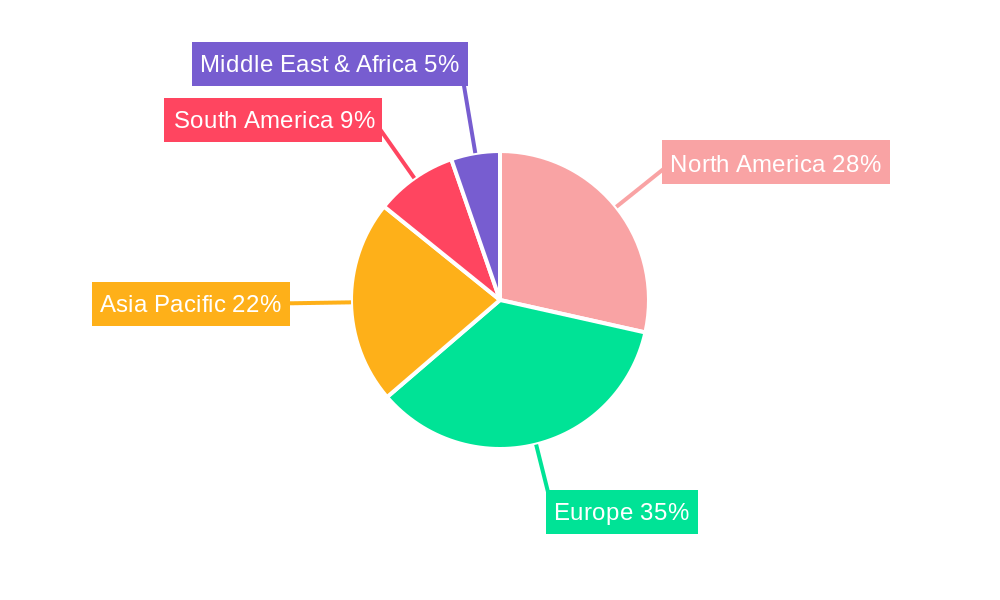
Leading Regions: North America and Europe currently dominate the bike safety gear market, driven by established cycling cultures, robust economic conditions, and stringent safety regulations. The United States, in particular, presents a significant market due to its large population of cyclists, both recreational and commuter, and a proactive approach to promoting cycling infrastructure and safety. Economic policies in these regions often favor sustainable transport, indirectly boosting demand for cycling accessories. Infrastructure development, including dedicated bike lanes and safety awareness campaigns, further solidifies their leading positions.
Dominant Applications:
- Specialty Stores: This segment holds substantial sway due to the expertise and curated product selections offered. Customers seeking high-performance or specific safety features often patronize these stores, benefiting from knowledgeable staff and a wide array of options from brands like Mavic and Orbea. The focus on niche products and personalized advice drives higher transaction values and customer loyalty.
- Online Stores: The e-commerce boom has significantly expanded the reach of bike safety gear. Online platforms offer unparalleled convenience, a vast selection from global manufacturers such as Specialized and Uvex, and competitive pricing. Their market share is projected to grow exponentially, particularly with advancements in logistics and online customer support. The accessibility to brands like Knog and Exposure Lights globally is a key advantage.
- Multi-Brand Stores: These outlets provide a convenient one-stop shop for consumers, stocking a variety of brands like Giant and Trek Bicycle. Their strength lies in offering a balance between selection and accessibility, catering to a broad spectrum of cyclists.
Dominant Product Types:
- Helmets: Helmets consistently lead the market, primarily due to their non-negotiable safety role and increasing regulatory mandates in many regions. Innovations in aerodynamics, ventilation, and impact absorption by companies like KASK, MET, and OGK KABUTO continue to drive demand. The market penetration of advanced helmet technologies, including MIPS (Multi-directional Impact Protection System), is a significant factor.
- Reflectors and Lights: With the growing emphasis on visibility, especially for urban commuters and night riders, this segment has witnessed substantial growth. Brands such as CatEye, SIGMA SPORT, NiteRider, and Magicshine are at the forefront, offering increasingly sophisticated and integrated lighting solutions that enhance rider safety. The development of rechargeable and smart lighting systems contributes to their market dominance.
- Gloves: Offering protection from abrasions, impact, and improving grip, gloves are another essential item. Manufacturers like SenHai Sports Goods and Strategic Sports are focusing on ergonomic designs, breathable materials, and impact-resistant padding to cater to diverse cycling disciplines.
- Protective Glasses: Essential for shielding eyes from debris, wind, and UV radiation, protective glasses from brands like Rudy Project and GUB are crucial for rider comfort and safety. Advancements in lens technology, including anti-fog and impact resistance, are key market drivers.
Bike Safety Gear Product Developments
Recent product developments in the bike safety gear market emphasize the integration of smart technologies and enhanced protective materials. Innovations include helmets with built-in LED lighting and turn signals, gloves with integrated impact protection, and advanced reflective materials that offer superior visibility in low-light conditions. Companies like Exposure Lights and NiteRider are leading the charge in sophisticated illumination systems, while brands such as ABUS are focusing on advanced locking mechanisms and helmet security. The competitive advantage lies in offering a holistic safety solution that combines protection, comfort, and technological integration, appealing to a growing segment of safety-conscious cyclists seeking advanced features.
Report Scope & Segmentation Analysis
This report provides a comprehensive analysis of the global bike safety gear market, segmented by Application and Product Type. The Applications segment encompasses Online Stores, Hypermarkets/Supermarkets, Multi-Brand Stores, Specialty Stores, Independent Small Stores, and Others, each offering distinct market dynamics and growth trajectories. Online Stores are projected to experience the highest growth rate due to increasing e-commerce penetration. The Product Types segment includes Helmets, Mouth Guards, Gloves, Reflectors and Lights, Protective Glasses, Mirrors, Bike Kits, and Others. Helmets and Reflectors/Lights are anticipated to maintain their leading market positions due to mandatory safety requirements and increased awareness, respectively. Competitive dynamics vary across these segments, with online channels fostering broader reach and specialty stores catering to niche demands. Growth projections for each segment are detailed within the report.
Key Drivers of Bike Safety Gear Growth
The growth of the bike safety gear market is propelled by several key drivers. A significant factor is the increasing global awareness and adoption of cycling for both commuting and recreation, leading to a higher demand for protective equipment. Government initiatives promoting sustainable transportation and investing in cycling infrastructure further encourage ridership. Technological advancements, such as the integration of smart features like lights, sensors, and communication devices into helmets and apparel, are creating new product categories and enhancing safety. Furthermore, stringent safety regulations in various regions mandate the use of specific safety gear, particularly helmets, thereby ensuring a consistent demand.
Challenges in the Bike Safety Gear Sector
Despite the positive growth trajectory, the bike safety gear sector faces several challenges. Price sensitivity among a segment of consumers can be a barrier, especially for premium or technologically advanced products. The presence of counterfeit products also poses a threat to genuine manufacturers and can erode consumer trust. Supply chain disruptions, as experienced globally, can impact the availability and cost of raw materials and finished goods. Intense competition from both established brands and emerging players can lead to pricing pressures and necessitate continuous innovation to maintain market share. Regulatory variations across different countries can also create complexities for global manufacturers.
Emerging Opportunities in Bike Safety Gear
Emerging opportunities in the bike safety gear market are abundant, driven by evolving consumer needs and technological advancements. The growing popularity of e-bikes, which enable higher speeds, presents a significant opportunity for manufacturers to develop enhanced protective gear. The demand for sustainable and eco-friendly safety products is also on the rise, offering potential for brands utilizing recycled or biodegradable materials. The integration of advanced connectivity features, such as GPS tracking and emergency alert systems within helmets, is another promising area. Furthermore, the expansion of cycling tourism and the increasing focus on health and wellness activities worldwide are creating new market niches for specialized safety gear.
Leading Players in the Bike Safety Gear Market
- Vista Outdoor
- Dorel
- Giant
- Trek Bicycle
- KASK
- Mavic
- Merida
- Specialized
- Uvex
- Scott Sports
- OGK KABUTO
- MET
- ABUS
- SenHai Sports Goods
- Strategic Sports
- Orbea
- Rudy Project
- GUB
- One Industries
- CatEye
- SIGMA SPORT
- Serfas
- Knog
- Exposure Lights
- Topeak
- Planet Bike
- NiteRider
- Magicshine
- BBB Cycling
- Ferei
Key Developments in Bike Safety Gear Industry
- 2023: Launch of smart helmets with integrated AI-powered impact detection and emergency services connectivity by multiple leading manufacturers.
- 2023: Increased investment in sustainable material research for helmets and apparel by major brands, aiming for reduced environmental impact.
- 2022: Significant mergers and acquisitions activity focused on consolidating the smart cycling accessories market.
- 2021: Introduction of highly breathable and lightweight protective gear using advanced composite materials.
- 2020: Accelerated development and adoption of integrated lighting and reflective technologies in response to increased urban cycling.
Strategic Outlook for Bike Safety Gear Market
The strategic outlook for the bike safety gear market remains exceptionally positive, driven by a sustained increase in cycling participation and a heightened awareness of safety protocols. The market is expected to witness continued innovation, particularly in the integration of smart technologies that offer enhanced protection and connectivity. The growing demand for sustainable and aesthetically pleasing products will also shape future product development strategies. Opportunities lie in expanding into emerging markets, developing specialized gear for diverse cycling disciplines (e.g., gravel biking, e-biking), and leveraging online retail channels for wider global reach. Companies that focus on product differentiation, technological advancement, and understanding evolving consumer preferences will be well-positioned for sustained growth and market leadership.
Bike Safety Gear Segmentation
-
1. Application
- 1.1. Online Stores
- 1.2. Hypermarkets/Supermarkets
- 1.3. Multi-Brand Stores
- 1.4. Specialty Stores
- 1.5. Independent Small Stores
- 1.6. Others
-
2. Types
- 2.1. Helmet
- 2.2. Mouth Guard
- 2.3. Gloves
- 2.4. Reflectors and Lights
- 2.5. Protective Glasses
- 2.6. Mirrors
- 2.7. Bike Kit
- 2.8. Others
Bike Safety Gear Segmentation By Geography
-
1. North America
- 1.1. United States
- 1.2. Canada
- 1.3. Mexico
-
2. South America
- 2.1. Brazil
- 2.2. Argentina
- 2.3. Rest of South America
-
3. Europe
- 3.1. United Kingdom
- 3.2. Germany
- 3.3. France
- 3.4. Italy
- 3.5. Spain
- 3.6. Russia
- 3.7. Benelux
- 3.8. Nordics
- 3.9. Rest of Europe
-
4. Middle East & Africa
- 4.1. Turkey
- 4.2. Israel
- 4.3. GCC
- 4.4. North Africa
- 4.5. South Africa
- 4.6. Rest of Middle East & Africa
-
5. Asia Pacific
- 5.1. China
- 5.2. India
- 5.3. Japan
- 5.4. South Korea
- 5.5. ASEAN
- 5.6. Oceania
- 5.7. Rest of Asia Pacific
Bike Safety Gear Regional Market Share
Geographic Coverage of Bike Safety Gear
Bike Safety Gear REPORT HIGHLIGHTS
| Aspects | Details |
|---|---|
| Study Period | 2020-2034 |
| Base Year | 2025 |
| Estimated Year | 2026 |
| Forecast Period | 2026-2034 |
| Historical Period | 2020-2025 |
| Growth Rate | CAGR of 9.47% from 2020-2034 |
| Segmentation |
|
Table of Contents
- 1. Introduction
- 1.1. Research Scope
- 1.2. Market Segmentation
- 1.3. Research Methodology
- 1.4. Definitions and Assumptions
- 2. Executive Summary
- 2.1. Introduction
- 3. Market Dynamics
- 3.1. Introduction
- 3.2. Market Drivers
- 3.3. Market Restrains
- 3.4. Market Trends
- 4. Market Factor Analysis
- 4.1. Porters Five Forces
- 4.2. Supply/Value Chain
- 4.3. PESTEL analysis
- 4.4. Market Entropy
- 4.5. Patent/Trademark Analysis
- 5. Global Bike Safety Gear Analysis, Insights and Forecast, 2020-2032
- 5.1. Market Analysis, Insights and Forecast - by Application
- 5.1.1. Online Stores
- 5.1.2. Hypermarkets/Supermarkets
- 5.1.3. Multi-Brand Stores
- 5.1.4. Specialty Stores
- 5.1.5. Independent Small Stores
- 5.1.6. Others
- 5.2. Market Analysis, Insights and Forecast - by Types
- 5.2.1. Helmet
- 5.2.2. Mouth Guard
- 5.2.3. Gloves
- 5.2.4. Reflectors and Lights
- 5.2.5. Protective Glasses
- 5.2.6. Mirrors
- 5.2.7. Bike Kit
- 5.2.8. Others
- 5.3. Market Analysis, Insights and Forecast - by Region
- 5.3.1. North America
- 5.3.2. South America
- 5.3.3. Europe
- 5.3.4. Middle East & Africa
- 5.3.5. Asia Pacific
- 5.1. Market Analysis, Insights and Forecast - by Application
- 6. North America Bike Safety Gear Analysis, Insights and Forecast, 2020-2032
- 6.1. Market Analysis, Insights and Forecast - by Application
- 6.1.1. Online Stores
- 6.1.2. Hypermarkets/Supermarkets
- 6.1.3. Multi-Brand Stores
- 6.1.4. Specialty Stores
- 6.1.5. Independent Small Stores
- 6.1.6. Others
- 6.2. Market Analysis, Insights and Forecast - by Types
- 6.2.1. Helmet
- 6.2.2. Mouth Guard
- 6.2.3. Gloves
- 6.2.4. Reflectors and Lights
- 6.2.5. Protective Glasses
- 6.2.6. Mirrors
- 6.2.7. Bike Kit
- 6.2.8. Others
- 6.1. Market Analysis, Insights and Forecast - by Application
- 7. South America Bike Safety Gear Analysis, Insights and Forecast, 2020-2032
- 7.1. Market Analysis, Insights and Forecast - by Application
- 7.1.1. Online Stores
- 7.1.2. Hypermarkets/Supermarkets
- 7.1.3. Multi-Brand Stores
- 7.1.4. Specialty Stores
- 7.1.5. Independent Small Stores
- 7.1.6. Others
- 7.2. Market Analysis, Insights and Forecast - by Types
- 7.2.1. Helmet
- 7.2.2. Mouth Guard
- 7.2.3. Gloves
- 7.2.4. Reflectors and Lights
- 7.2.5. Protective Glasses
- 7.2.6. Mirrors
- 7.2.7. Bike Kit
- 7.2.8. Others
- 7.1. Market Analysis, Insights and Forecast - by Application
- 8. Europe Bike Safety Gear Analysis, Insights and Forecast, 2020-2032
- 8.1. Market Analysis, Insights and Forecast - by Application
- 8.1.1. Online Stores
- 8.1.2. Hypermarkets/Supermarkets
- 8.1.3. Multi-Brand Stores
- 8.1.4. Specialty Stores
- 8.1.5. Independent Small Stores
- 8.1.6. Others
- 8.2. Market Analysis, Insights and Forecast - by Types
- 8.2.1. Helmet
- 8.2.2. Mouth Guard
- 8.2.3. Gloves
- 8.2.4. Reflectors and Lights
- 8.2.5. Protective Glasses
- 8.2.6. Mirrors
- 8.2.7. Bike Kit
- 8.2.8. Others
- 8.1. Market Analysis, Insights and Forecast - by Application
- 9. Middle East & Africa Bike Safety Gear Analysis, Insights and Forecast, 2020-2032
- 9.1. Market Analysis, Insights and Forecast - by Application
- 9.1.1. Online Stores
- 9.1.2. Hypermarkets/Supermarkets
- 9.1.3. Multi-Brand Stores
- 9.1.4. Specialty Stores
- 9.1.5. Independent Small Stores
- 9.1.6. Others
- 9.2. Market Analysis, Insights and Forecast - by Types
- 9.2.1. Helmet
- 9.2.2. Mouth Guard
- 9.2.3. Gloves
- 9.2.4. Reflectors and Lights
- 9.2.5. Protective Glasses
- 9.2.6. Mirrors
- 9.2.7. Bike Kit
- 9.2.8. Others
- 9.1. Market Analysis, Insights and Forecast - by Application
- 10. Asia Pacific Bike Safety Gear Analysis, Insights and Forecast, 2020-2032
- 10.1. Market Analysis, Insights and Forecast - by Application
- 10.1.1. Online Stores
- 10.1.2. Hypermarkets/Supermarkets
- 10.1.3. Multi-Brand Stores
- 10.1.4. Specialty Stores
- 10.1.5. Independent Small Stores
- 10.1.6. Others
- 10.2. Market Analysis, Insights and Forecast - by Types
- 10.2.1. Helmet
- 10.2.2. Mouth Guard
- 10.2.3. Gloves
- 10.2.4. Reflectors and Lights
- 10.2.5. Protective Glasses
- 10.2.6. Mirrors
- 10.2.7. Bike Kit
- 10.2.8. Others
- 10.1. Market Analysis, Insights and Forecast - by Application
- 11. Competitive Analysis
- 11.1. Global Market Share Analysis 2025
- 11.2. Company Profiles
- 11.2.1 Vista Outdoor
- 11.2.1.1. Overview
- 11.2.1.2. Products
- 11.2.1.3. SWOT Analysis
- 11.2.1.4. Recent Developments
- 11.2.1.5. Financials (Based on Availability)
- 11.2.2 Dorel
- 11.2.2.1. Overview
- 11.2.2.2. Products
- 11.2.2.3. SWOT Analysis
- 11.2.2.4. Recent Developments
- 11.2.2.5. Financials (Based on Availability)
- 11.2.3 Giant
- 11.2.3.1. Overview
- 11.2.3.2. Products
- 11.2.3.3. SWOT Analysis
- 11.2.3.4. Recent Developments
- 11.2.3.5. Financials (Based on Availability)
- 11.2.4 Trek Bicycle
- 11.2.4.1. Overview
- 11.2.4.2. Products
- 11.2.4.3. SWOT Analysis
- 11.2.4.4. Recent Developments
- 11.2.4.5. Financials (Based on Availability)
- 11.2.5 KASK
- 11.2.5.1. Overview
- 11.2.5.2. Products
- 11.2.5.3. SWOT Analysis
- 11.2.5.4. Recent Developments
- 11.2.5.5. Financials (Based on Availability)
- 11.2.6 Mavic
- 11.2.6.1. Overview
- 11.2.6.2. Products
- 11.2.6.3. SWOT Analysis
- 11.2.6.4. Recent Developments
- 11.2.6.5. Financials (Based on Availability)
- 11.2.7 Merida
- 11.2.7.1. Overview
- 11.2.7.2. Products
- 11.2.7.3. SWOT Analysis
- 11.2.7.4. Recent Developments
- 11.2.7.5. Financials (Based on Availability)
- 11.2.8 Specialized
- 11.2.8.1. Overview
- 11.2.8.2. Products
- 11.2.8.3. SWOT Analysis
- 11.2.8.4. Recent Developments
- 11.2.8.5. Financials (Based on Availability)
- 11.2.9 Uvex
- 11.2.9.1. Overview
- 11.2.9.2. Products
- 11.2.9.3. SWOT Analysis
- 11.2.9.4. Recent Developments
- 11.2.9.5. Financials (Based on Availability)
- 11.2.10 Scott Sports
- 11.2.10.1. Overview
- 11.2.10.2. Products
- 11.2.10.3. SWOT Analysis
- 11.2.10.4. Recent Developments
- 11.2.10.5. Financials (Based on Availability)
- 11.2.11 OGK KABUTO
- 11.2.11.1. Overview
- 11.2.11.2. Products
- 11.2.11.3. SWOT Analysis
- 11.2.11.4. Recent Developments
- 11.2.11.5. Financials (Based on Availability)
- 11.2.12 MET
- 11.2.12.1. Overview
- 11.2.12.2. Products
- 11.2.12.3. SWOT Analysis
- 11.2.12.4. Recent Developments
- 11.2.12.5. Financials (Based on Availability)
- 11.2.13 ABUS
- 11.2.13.1. Overview
- 11.2.13.2. Products
- 11.2.13.3. SWOT Analysis
- 11.2.13.4. Recent Developments
- 11.2.13.5. Financials (Based on Availability)
- 11.2.14 SenHai Sports Goods
- 11.2.14.1. Overview
- 11.2.14.2. Products
- 11.2.14.3. SWOT Analysis
- 11.2.14.4. Recent Developments
- 11.2.14.5. Financials (Based on Availability)
- 11.2.15 Strategic Sports
- 11.2.15.1. Overview
- 11.2.15.2. Products
- 11.2.15.3. SWOT Analysis
- 11.2.15.4. Recent Developments
- 11.2.15.5. Financials (Based on Availability)
- 11.2.16 Orbea
- 11.2.16.1. Overview
- 11.2.16.2. Products
- 11.2.16.3. SWOT Analysis
- 11.2.16.4. Recent Developments
- 11.2.16.5. Financials (Based on Availability)
- 11.2.17 Rudy Project
- 11.2.17.1. Overview
- 11.2.17.2. Products
- 11.2.17.3. SWOT Analysis
- 11.2.17.4. Recent Developments
- 11.2.17.5. Financials (Based on Availability)
- 11.2.18 GUB
- 11.2.18.1. Overview
- 11.2.18.2. Products
- 11.2.18.3. SWOT Analysis
- 11.2.18.4. Recent Developments
- 11.2.18.5. Financials (Based on Availability)
- 11.2.19 One Industries
- 11.2.19.1. Overview
- 11.2.19.2. Products
- 11.2.19.3. SWOT Analysis
- 11.2.19.4. Recent Developments
- 11.2.19.5. Financials (Based on Availability)
- 11.2.20 CatEye
- 11.2.20.1. Overview
- 11.2.20.2. Products
- 11.2.20.3. SWOT Analysis
- 11.2.20.4. Recent Developments
- 11.2.20.5. Financials (Based on Availability)
- 11.2.21 SIGMA SPORT
- 11.2.21.1. Overview
- 11.2.21.2. Products
- 11.2.21.3. SWOT Analysis
- 11.2.21.4. Recent Developments
- 11.2.21.5. Financials (Based on Availability)
- 11.2.22 Serfas
- 11.2.22.1. Overview
- 11.2.22.2. Products
- 11.2.22.3. SWOT Analysis
- 11.2.22.4. Recent Developments
- 11.2.22.5. Financials (Based on Availability)
- 11.2.23 Knog
- 11.2.23.1. Overview
- 11.2.23.2. Products
- 11.2.23.3. SWOT Analysis
- 11.2.23.4. Recent Developments
- 11.2.23.5. Financials (Based on Availability)
- 11.2.24 Exposure Lights
- 11.2.24.1. Overview
- 11.2.24.2. Products
- 11.2.24.3. SWOT Analysis
- 11.2.24.4. Recent Developments
- 11.2.24.5. Financials (Based on Availability)
- 11.2.25 Topeak
- 11.2.25.1. Overview
- 11.2.25.2. Products
- 11.2.25.3. SWOT Analysis
- 11.2.25.4. Recent Developments
- 11.2.25.5. Financials (Based on Availability)
- 11.2.26 Planet Bike
- 11.2.26.1. Overview
- 11.2.26.2. Products
- 11.2.26.3. SWOT Analysis
- 11.2.26.4. Recent Developments
- 11.2.26.5. Financials (Based on Availability)
- 11.2.27 NiteRider
- 11.2.27.1. Overview
- 11.2.27.2. Products
- 11.2.27.3. SWOT Analysis
- 11.2.27.4. Recent Developments
- 11.2.27.5. Financials (Based on Availability)
- 11.2.28 Magicshine
- 11.2.28.1. Overview
- 11.2.28.2. Products
- 11.2.28.3. SWOT Analysis
- 11.2.28.4. Recent Developments
- 11.2.28.5. Financials (Based on Availability)
- 11.2.29 BBB Cycling
- 11.2.29.1. Overview
- 11.2.29.2. Products
- 11.2.29.3. SWOT Analysis
- 11.2.29.4. Recent Developments
- 11.2.29.5. Financials (Based on Availability)
- 11.2.30 Ferei
- 11.2.30.1. Overview
- 11.2.30.2. Products
- 11.2.30.3. SWOT Analysis
- 11.2.30.4. Recent Developments
- 11.2.30.5. Financials (Based on Availability)
- 11.2.1 Vista Outdoor
List of Figures
- Figure 1: Global Bike Safety Gear Revenue Breakdown (undefined, %) by Region 2025 & 2033
- Figure 2: North America Bike Safety Gear Revenue (undefined), by Application 2025 & 2033
- Figure 3: North America Bike Safety Gear Revenue Share (%), by Application 2025 & 2033
- Figure 4: North America Bike Safety Gear Revenue (undefined), by Types 2025 & 2033
- Figure 5: North America Bike Safety Gear Revenue Share (%), by Types 2025 & 2033
- Figure 6: North America Bike Safety Gear Revenue (undefined), by Country 2025 & 2033
- Figure 7: North America Bike Safety Gear Revenue Share (%), by Country 2025 & 2033
- Figure 8: South America Bike Safety Gear Revenue (undefined), by Application 2025 & 2033
- Figure 9: South America Bike Safety Gear Revenue Share (%), by Application 2025 & 2033
- Figure 10: South America Bike Safety Gear Revenue (undefined), by Types 2025 & 2033
- Figure 11: South America Bike Safety Gear Revenue Share (%), by Types 2025 & 2033
- Figure 12: South America Bike Safety Gear Revenue (undefined), by Country 2025 & 2033
- Figure 13: South America Bike Safety Gear Revenue Share (%), by Country 2025 & 2033
- Figure 14: Europe Bike Safety Gear Revenue (undefined), by Application 2025 & 2033
- Figure 15: Europe Bike Safety Gear Revenue Share (%), by Application 2025 & 2033
- Figure 16: Europe Bike Safety Gear Revenue (undefined), by Types 2025 & 2033
- Figure 17: Europe Bike Safety Gear Revenue Share (%), by Types 2025 & 2033
- Figure 18: Europe Bike Safety Gear Revenue (undefined), by Country 2025 & 2033
- Figure 19: Europe Bike Safety Gear Revenue Share (%), by Country 2025 & 2033
- Figure 20: Middle East & Africa Bike Safety Gear Revenue (undefined), by Application 2025 & 2033
- Figure 21: Middle East & Africa Bike Safety Gear Revenue Share (%), by Application 2025 & 2033
- Figure 22: Middle East & Africa Bike Safety Gear Revenue (undefined), by Types 2025 & 2033
- Figure 23: Middle East & Africa Bike Safety Gear Revenue Share (%), by Types 2025 & 2033
- Figure 24: Middle East & Africa Bike Safety Gear Revenue (undefined), by Country 2025 & 2033
- Figure 25: Middle East & Africa Bike Safety Gear Revenue Share (%), by Country 2025 & 2033
- Figure 26: Asia Pacific Bike Safety Gear Revenue (undefined), by Application 2025 & 2033
- Figure 27: Asia Pacific Bike Safety Gear Revenue Share (%), by Application 2025 & 2033
- Figure 28: Asia Pacific Bike Safety Gear Revenue (undefined), by Types 2025 & 2033
- Figure 29: Asia Pacific Bike Safety Gear Revenue Share (%), by Types 2025 & 2033
- Figure 30: Asia Pacific Bike Safety Gear Revenue (undefined), by Country 2025 & 2033
- Figure 31: Asia Pacific Bike Safety Gear Revenue Share (%), by Country 2025 & 2033
List of Tables
- Table 1: Global Bike Safety Gear Revenue undefined Forecast, by Application 2020 & 2033
- Table 2: Global Bike Safety Gear Revenue undefined Forecast, by Types 2020 & 2033
- Table 3: Global Bike Safety Gear Revenue undefined Forecast, by Region 2020 & 2033
- Table 4: Global Bike Safety Gear Revenue undefined Forecast, by Application 2020 & 2033
- Table 5: Global Bike Safety Gear Revenue undefined Forecast, by Types 2020 & 2033
- Table 6: Global Bike Safety Gear Revenue undefined Forecast, by Country 2020 & 2033
- Table 7: United States Bike Safety Gear Revenue (undefined) Forecast, by Application 2020 & 2033
- Table 8: Canada Bike Safety Gear Revenue (undefined) Forecast, by Application 2020 & 2033
- Table 9: Mexico Bike Safety Gear Revenue (undefined) Forecast, by Application 2020 & 2033
- Table 10: Global Bike Safety Gear Revenue undefined Forecast, by Application 2020 & 2033
- Table 11: Global Bike Safety Gear Revenue undefined Forecast, by Types 2020 & 2033
- Table 12: Global Bike Safety Gear Revenue undefined Forecast, by Country 2020 & 2033
- Table 13: Brazil Bike Safety Gear Revenue (undefined) Forecast, by Application 2020 & 2033
- Table 14: Argentina Bike Safety Gear Revenue (undefined) Forecast, by Application 2020 & 2033
- Table 15: Rest of South America Bike Safety Gear Revenue (undefined) Forecast, by Application 2020 & 2033
- Table 16: Global Bike Safety Gear Revenue undefined Forecast, by Application 2020 & 2033
- Table 17: Global Bike Safety Gear Revenue undefined Forecast, by Types 2020 & 2033
- Table 18: Global Bike Safety Gear Revenue undefined Forecast, by Country 2020 & 2033
- Table 19: United Kingdom Bike Safety Gear Revenue (undefined) Forecast, by Application 2020 & 2033
- Table 20: Germany Bike Safety Gear Revenue (undefined) Forecast, by Application 2020 & 2033
- Table 21: France Bike Safety Gear Revenue (undefined) Forecast, by Application 2020 & 2033
- Table 22: Italy Bike Safety Gear Revenue (undefined) Forecast, by Application 2020 & 2033
- Table 23: Spain Bike Safety Gear Revenue (undefined) Forecast, by Application 2020 & 2033
- Table 24: Russia Bike Safety Gear Revenue (undefined) Forecast, by Application 2020 & 2033
- Table 25: Benelux Bike Safety Gear Revenue (undefined) Forecast, by Application 2020 & 2033
- Table 26: Nordics Bike Safety Gear Revenue (undefined) Forecast, by Application 2020 & 2033
- Table 27: Rest of Europe Bike Safety Gear Revenue (undefined) Forecast, by Application 2020 & 2033
- Table 28: Global Bike Safety Gear Revenue undefined Forecast, by Application 2020 & 2033
- Table 29: Global Bike Safety Gear Revenue undefined Forecast, by Types 2020 & 2033
- Table 30: Global Bike Safety Gear Revenue undefined Forecast, by Country 2020 & 2033
- Table 31: Turkey Bike Safety Gear Revenue (undefined) Forecast, by Application 2020 & 2033
- Table 32: Israel Bike Safety Gear Revenue (undefined) Forecast, by Application 2020 & 2033
- Table 33: GCC Bike Safety Gear Revenue (undefined) Forecast, by Application 2020 & 2033
- Table 34: North Africa Bike Safety Gear Revenue (undefined) Forecast, by Application 2020 & 2033
- Table 35: South Africa Bike Safety Gear Revenue (undefined) Forecast, by Application 2020 & 2033
- Table 36: Rest of Middle East & Africa Bike Safety Gear Revenue (undefined) Forecast, by Application 2020 & 2033
- Table 37: Global Bike Safety Gear Revenue undefined Forecast, by Application 2020 & 2033
- Table 38: Global Bike Safety Gear Revenue undefined Forecast, by Types 2020 & 2033
- Table 39: Global Bike Safety Gear Revenue undefined Forecast, by Country 2020 & 2033
- Table 40: China Bike Safety Gear Revenue (undefined) Forecast, by Application 2020 & 2033
- Table 41: India Bike Safety Gear Revenue (undefined) Forecast, by Application 2020 & 2033
- Table 42: Japan Bike Safety Gear Revenue (undefined) Forecast, by Application 2020 & 2033
- Table 43: South Korea Bike Safety Gear Revenue (undefined) Forecast, by Application 2020 & 2033
- Table 44: ASEAN Bike Safety Gear Revenue (undefined) Forecast, by Application 2020 & 2033
- Table 45: Oceania Bike Safety Gear Revenue (undefined) Forecast, by Application 2020 & 2033
- Table 46: Rest of Asia Pacific Bike Safety Gear Revenue (undefined) Forecast, by Application 2020 & 2033
Frequently Asked Questions
1. What is the projected Compound Annual Growth Rate (CAGR) of the Bike Safety Gear?
The projected CAGR is approximately 9.47%.
2. Which companies are prominent players in the Bike Safety Gear?
Key companies in the market include Vista Outdoor, Dorel, Giant, Trek Bicycle, KASK, Mavic, Merida, Specialized, Uvex, Scott Sports, OGK KABUTO, MET, ABUS, SenHai Sports Goods, Strategic Sports, Orbea, Rudy Project, GUB, One Industries, CatEye, SIGMA SPORT, Serfas, Knog, Exposure Lights, Topeak, Planet Bike, NiteRider, Magicshine, BBB Cycling, Ferei.
3. What are the main segments of the Bike Safety Gear?
The market segments include Application, Types.
4. Can you provide details about the market size?
The market size is estimated to be USD XXX N/A as of 2022.
5. What are some drivers contributing to market growth?
N/A
6. What are the notable trends driving market growth?
N/A
7. Are there any restraints impacting market growth?
N/A
8. Can you provide examples of recent developments in the market?
N/A
9. What pricing options are available for accessing the report?
Pricing options include single-user, multi-user, and enterprise licenses priced at USD 3350.00, USD 5025.00, and USD 6700.00 respectively.
10. Is the market size provided in terms of value or volume?
The market size is provided in terms of value, measured in N/A.
11. Are there any specific market keywords associated with the report?
Yes, the market keyword associated with the report is "Bike Safety Gear," which aids in identifying and referencing the specific market segment covered.
12. How do I determine which pricing option suits my needs best?
The pricing options vary based on user requirements and access needs. Individual users may opt for single-user licenses, while businesses requiring broader access may choose multi-user or enterprise licenses for cost-effective access to the report.
13. Are there any additional resources or data provided in the Bike Safety Gear report?
While the report offers comprehensive insights, it's advisable to review the specific contents or supplementary materials provided to ascertain if additional resources or data are available.
14. How can I stay updated on further developments or reports in the Bike Safety Gear?
To stay informed about further developments, trends, and reports in the Bike Safety Gear, consider subscribing to industry newsletters, following relevant companies and organizations, or regularly checking reputable industry news sources and publications.
Methodology
Step 1 - Identification of Relevant Samples Size from Population Database


Step 2 - Approaches for Defining Global Market Size (Value, Volume* & Price*)

Note*: In applicable scenarios
Step 3 - Data Sources
Primary Research
- Web Analytics
- Survey Reports
- Research Institute
- Latest Research Reports
- Opinion Leaders
Secondary Research
- Annual Reports
- White Paper
- Latest Press Release
- Industry Association
- Paid Database
- Investor Presentations

Step 4 - Data Triangulation
Involves using different sources of information in order to increase the validity of a study
These sources are likely to be stakeholders in a program - participants, other researchers, program staff, other community members, and so on.
Then we put all data in single framework & apply various statistical tools to find out the dynamic on the market.
During the analysis stage, feedback from the stakeholder groups would be compared to determine areas of agreement as well as areas of divergence