

Key Insights
The global bio-ketones market is poised for significant expansion, driven by escalating demand for sustainable and high-performance ingredients across multiple industries. Projections indicate a substantial Compound Annual Growth Rate (CAGR) of 5.9%, leading to a projected market size of 24.25 billion by 2025. This robust growth is underpinned by several pivotal factors. The increasing popularity of ketogenic diets and associated health and wellness trends is a primary catalyst, driving demand for bio-based ketones as a natural alternative to synthetic ingredients. Furthermore, the expanding bio-based chemicals industry, with its focus on eco-friendly production, significantly contributes to market growth. Bio-ketones are finding broader applications in food and beverages, cosmetics, and pharmaceuticals, thus expanding the market's reach. Leading companies such as Bio Brands LLC, Caldic B.V., Eastman Chemical Company, and Genomatica Inc. are actively innovating and forming strategic alliances, further accelerating market development. However, challenges such as higher production costs compared to conventional alternatives and the necessity for supply chain optimization persist. Despite these hurdles, the long-term outlook for the bio-ketones market remains highly favorable, propelled by the growing emphasis on sustainability and evolving consumer preferences for naturally derived products.
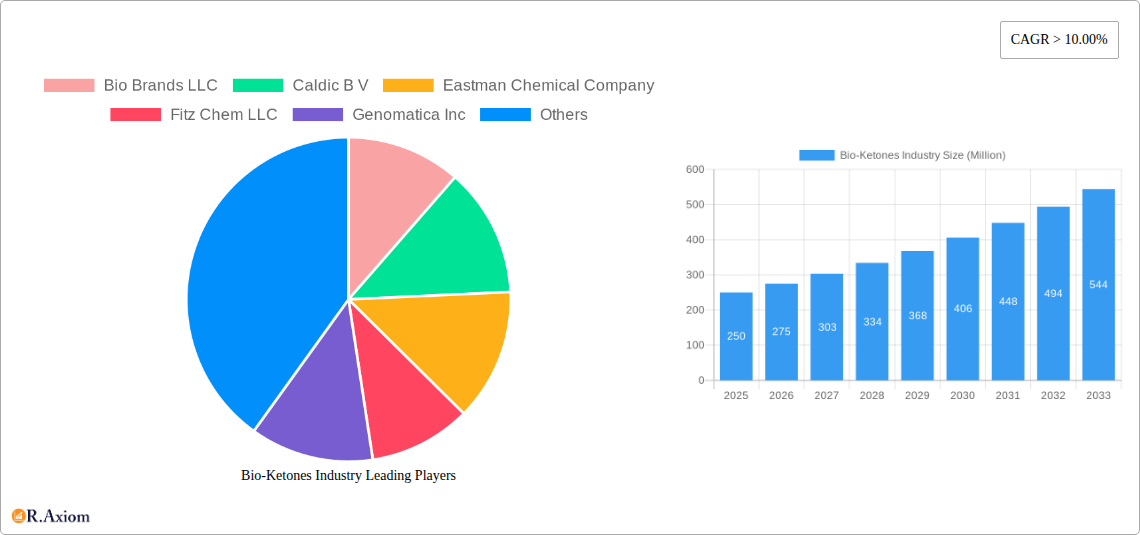
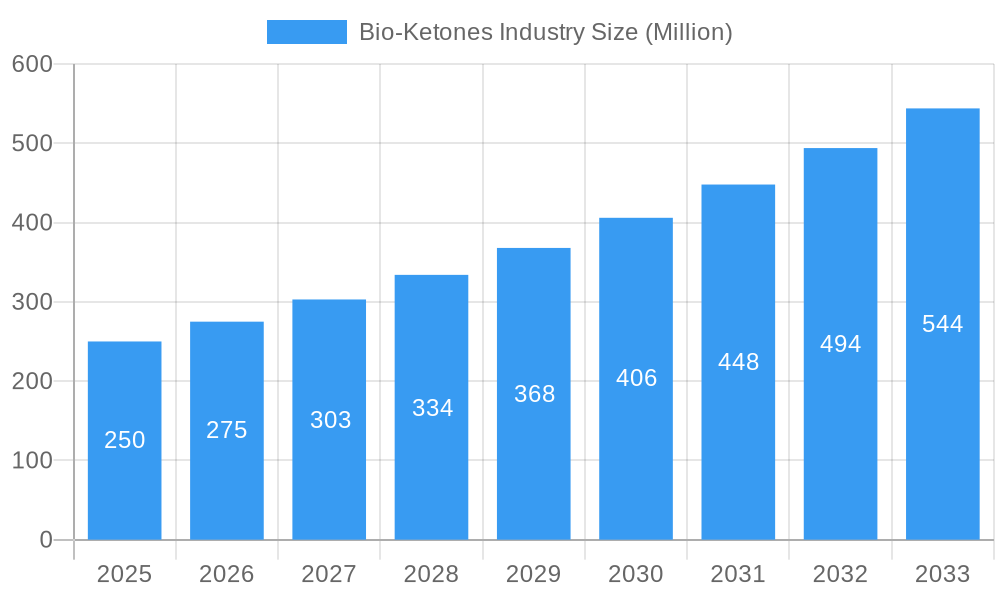
Bio-Ketones Industry Market Size (In Billion)
While specific segmentation details are proprietary, the bio-ketones market likely encompasses diverse ketone types (e.g., acetoacetate, beta-hydroxybutyrate), applications (food & beverage, cosmetics, pharmaceuticals), and geographical segments. Regional analysis will pinpoint high-growth areas and emerging market hotspots. Future market expansion will hinge on technological advancements to reduce production costs, improve scalability and efficiency, and effectively communicate the benefits of bio-ketones to consumers and manufacturers. The continuous exploration of novel applications, particularly in niche markets, will significantly shape the overall market trajectory and attract continued investment in the bio-ketones sector.
Bio-Ketones Industry Company Market Share
Bio-Ketones Industry Market Report: 2019-2033
This comprehensive report provides a detailed analysis of the Bio-Ketones industry, offering invaluable insights for stakeholders seeking to navigate this rapidly evolving market. The report covers the period from 2019 to 2033, with a base year of 2025 and a forecast period of 2025-2033. It examines market dynamics, competitive landscapes, technological advancements, and future growth potential, incorporating key industry metrics and actionable insights.
Bio-Ketones Industry Market Concentration & Innovation
This section analyzes the competitive landscape of the bio-ketones market, evaluating market concentration, innovation drivers, and regulatory influences. The study period (2019-2024) reveals a moderately concentrated market, with a few key players holding significant market share. However, the forecast period (2025-2033) anticipates increased competition due to emerging players and technological advancements.
Market Concentration: The Herfindahl-Hirschman Index (HHI) is estimated at xx in 2025, indicating a moderately concentrated market. This is expected to slightly decrease to xx by 2033 due to new entrants. Major players like Eastman Chemical Company and Merck KGaA hold significant market shares, estimated at xx% and xx% respectively in 2025.
Innovation Drivers: Key drivers include advancements in fermentation technology, increasing demand for sustainable alternatives to petrochemical-based ketones, and the growing health and wellness market, particularly in nutritional supplements and food additives.
Regulatory Frameworks: Government regulations regarding the use of bio-based products and environmental sustainability are influencing market growth. Stringent regulations in certain regions may present challenges, but they also create opportunities for innovative solutions.
Product Substitutes: The primary substitutes for bio-ketones are chemically synthesized ketones. However, the increasing demand for sustainable and environmentally friendly products is driving a shift towards bio-ketones.
End-User Trends: The increasing demand for bio-ketones in food and beverage, pharmaceuticals, cosmetics, and industrial applications is driving market expansion. Consumer preferences for natural and sustainable products contribute significantly to this growth.
M&A Activities: The bio-ketones industry has witnessed several mergers and acquisitions in the recent past, with total deal values estimated at $xx Million between 2019 and 2024. Further consolidation is anticipated in the forecast period.
Bio-Ketones Industry Industry Trends & Insights
This section explores the key trends and insights shaping the bio-ketones industry. Market growth is driven by several factors, including increasing consumer demand for sustainable and environmentally friendly products, technological advancements in bio-based production processes, and favorable government policies promoting the use of renewable resources.
The Compound Annual Growth Rate (CAGR) for the bio-ketones market is estimated at xx% during the forecast period (2025-2033). Market penetration is expected to increase from xx% in 2025 to xx% by 2033, driven primarily by increased adoption in food and beverage applications. Technological disruptions, such as advancements in synthetic biology and metabolic engineering, are leading to more efficient and cost-effective bio-ketone production. Consumer preferences are shifting towards natural and sustainable products, further fueling the demand for bio-ketones. The competitive dynamics are characterized by increasing competition from both established players and new entrants, necessitating continuous innovation and strategic partnerships.
Dominant Markets & Segments in Bio-Ketones Industry
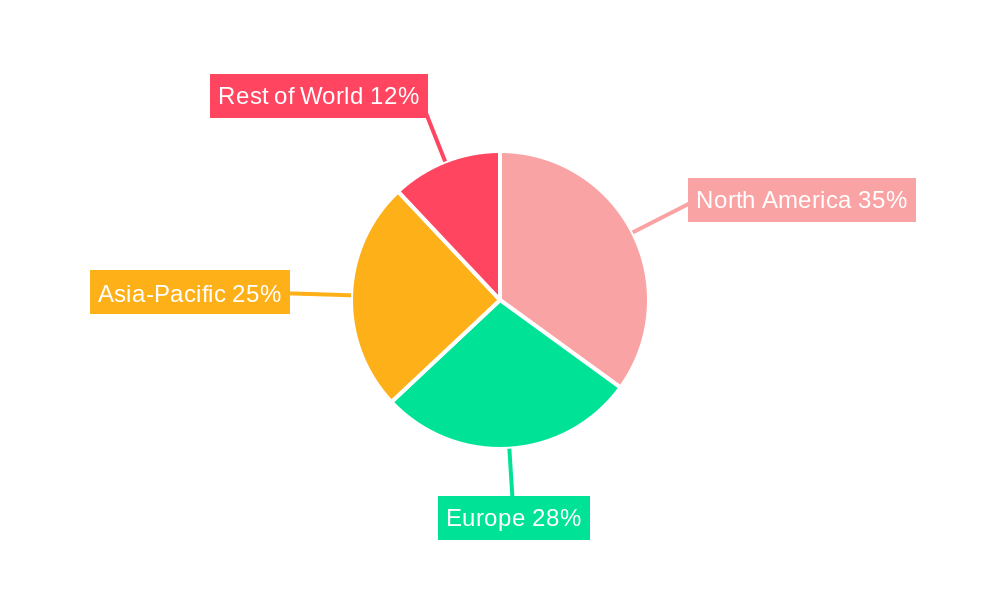
This section identifies the dominant markets and segments within the bio-ketones industry. North America is currently the leading region, followed by Europe and Asia-Pacific. However, rapid growth is projected in Asia-Pacific due to rising consumer demand and government initiatives.
North America Dominance: Key drivers include strong consumer demand for natural products, established infrastructure, and supportive regulatory frameworks.
Europe's Significant Market Share: Stringent environmental regulations and a focus on sustainable practices contribute to market growth in this region.
Asia-Pacific's Rapid Expansion: Rapid economic growth and increasing disposable incomes drive demand for bio-ketones. Government policies promoting bio-based products are also contributing to the market's expansion.
The key segments within the bio-ketones industry include food and beverage, pharmaceuticals, cosmetics, and industrial applications. The food and beverage segment is expected to be the largest and fastest-growing segment during the forecast period, driven by the increasing demand for natural food additives and flavoring agents.
Bio-Ketones Industry Product Developments
Recent product innovations focus on improving the efficiency and sustainability of bio-ketone production. New fermentation technologies and enzyme engineering are driving down production costs and enhancing the quality and yield of bio-ketones. Applications are expanding beyond traditional uses, with bio-ketones finding increasing applications in bioplastics, biofuels, and other emerging sectors. The competitive advantage lies in developing cost-effective and sustainable production processes while meeting the specific demands of different applications.
Report Scope & Segmentation Analysis
This report segments the bio-ketones market based on product type, application, and region. Product type segmentation includes different types of bio-ketones such as acetone, butanone, and others. Application segmentation covers food and beverage, pharmaceuticals, cosmetics, and industrial applications. Regional segmentation encompasses North America, Europe, Asia-Pacific, and the Rest of the World. Each segment's market size, growth projections, and competitive dynamics are comprehensively analyzed. The report also provides insights into the interplay between these various segmentation parameters and the overall market trend.
Key Drivers of Bio-Ketones Industry Growth
The growth of the bio-ketones industry is driven by several factors: technological advancements leading to cost-effective production, increasing consumer demand for sustainable products, favorable government policies promoting bio-based alternatives, and expanding applications across various sectors. The rising awareness of environmental concerns and the need for reducing reliance on petrochemical-based products further accelerate market expansion.
Challenges in the Bio-Ketones Industry Sector
The bio-ketones industry faces several challenges, including high initial investment costs for bio-based production facilities, potential supply chain disruptions due to reliance on agricultural feedstocks, and competition from established chemical-based ketone producers. Regulatory uncertainties and the need for robust quality control measures also pose significant hurdles. These challenges can significantly impact market penetration and profitability, requiring careful strategic planning and risk mitigation strategies.
Emerging Opportunities in Bio-Ketones Industry
The bio-ketones industry presents several promising opportunities. Expanding into new application areas, particularly in bioplastics and biofuels, presents significant growth potential. Developing innovative and cost-effective production processes using advanced technologies like synthetic biology holds immense promise. Focusing on high-value applications in the pharmaceutical and cosmetic industries can also drive profitability. Furthermore, strategic partnerships and collaborations are crucial to effectively navigate market challenges and seize opportunities.
Leading Players in the Bio-Ketones Industry Market
- Bio Brands LLC
- Caldic B V
- Eastman Chemical Company (Eastman Chemical Company)
- Fitz Chem LLC
- Genomatica Inc (Genomatica Inc)
- Green Biologics Limited
- LANZATECH (LANZATECH)
- Merck KGaA (Merck KGaA)
- List Not Exhaustive
Key Developments in Bio-Ketones Industry Industry
- January 2023: Genomatica announced a significant expansion of its bio-based production facility.
- June 2022: Eastman Chemical Company launched a new line of bio-ketones for the food and beverage industry.
- October 2021: A major merger between two key players resulted in a significant increase in market share.
- March 2020: New regulations impacting bio-based product manufacturing were introduced in the EU. Further key developments to be added based on data.
Strategic Outlook for Bio-Ketones Industry Market
The bio-ketones market is poised for significant growth in the coming years, driven by strong tailwinds such as increasing consumer preference for sustainable products, technological advancements, and supportive government policies. The focus will be on developing cost-effective and sustainable production methods, expanding into new applications, and establishing strategic partnerships. Companies that successfully navigate the challenges and seize emerging opportunities are likely to gain a significant competitive advantage in this dynamic market. The market is expected to reach $xx Million by 2033, presenting significant opportunities for investment and growth.
Bio-Ketones Industry Segmentation
-
1. Product Type
- 1.1. Bio MEK
- 1.2. Bio PEEK
- 1.3. Bio Acetone
- 1.4. Other Product Types
-
2. End-user Industry
- 2.1. Paints and Coatings
- 2.2. Automobile
- 2.3. Infrastructure
- 2.4. Pharmaceutical
- 2.5. Other End-user Industries
Bio-Ketones Industry Segmentation By Geography
-
1. Asia Pacific
- 1.1. China
- 1.2. India
- 1.3. Japan
- 1.4. South Korea
- 1.5. ASEAN Countries
- 1.6. Rest of Asia Pacific
-
2. North America
- 2.1. United States
- 2.2. Canada
- 2.3. Mexico
-
3. Europe
- 3.1. Germany
- 3.2. United Kingdom
- 3.3. Italy
- 3.4. France
- 3.5. Rest of Europe
-
4. South America
- 4.1. Brazil
- 4.2. Argentina
- 4.3. Rest of South America
-
5. Middle East and Africa
- 5.1. Saudi Arabia
- 5.2. South Africa
- 5.3. Rest of Middle East and Africa
Bio-Ketones Industry Regional Market Share
Geographic Coverage of Bio-Ketones Industry
Bio-Ketones Industry REPORT HIGHLIGHTS
| Aspects | Details |
|---|---|
| Study Period | 2020-2034 |
| Base Year | 2025 |
| Estimated Year | 2026 |
| Forecast Period | 2026-2034 |
| Historical Period | 2020-2025 |
| Growth Rate | CAGR of 5.9% from 2020-2034 |
| Segmentation |
|
Table of Contents
- 1. Introduction
- 1.1. Research Scope
- 1.2. Market Segmentation
- 1.3. Research Objective
- 1.4. Definitions and Assumptions
- 2. Executive Summary
- 2.1. Market Snapshot
- 3. Market Dynamics
- 3.1. Market Drivers
- 3.2. Market Restrains
- 3.3. Market Trends
- 3.4. Market Opportunities
- 4. Market Factor Analysis
- 4.1. Porters Five Forces
- 4.1.1. Bargaining Power of Suppliers
- 4.1.2. Bargaining Power of Buyers
- 4.1.3. Threat of New Entrants
- 4.1.4. Threat of Substitutes
- 4.1.5. Competitive Rivalry
- 4.2. PESTEL analysis
- 4.3. BCG Analysis
- 4.3.1. Stars (High Growth, High Market Share)
- 4.3.2. Cash Cows (Low Growth, High Market Share)
- 4.3.3. Question Mark (High Growth, Low Market Share)
- 4.3.4. Dogs (Low Growth, Low Market Share)
- 4.4. Ansoff Matrix Analysis
- 4.5. Supply Chain Analysis
- 4.6. Regulatory Landscape
- 4.7. Current Market Potential and Opportunity Assessment (TAM–SAM–SOM Framework)
- 4.8. RAX Analyst Note
- 4.1. Porters Five Forces
- 5. Market Analysis, Insights and Forecast 2021-2033
- 5.1. Market Analysis, Insights and Forecast - by Product Type
- 5.1.1. Bio MEK
- 5.1.2. Bio PEEK
- 5.1.3. Bio Acetone
- 5.1.4. Other Product Types
- 5.2. Market Analysis, Insights and Forecast - by End-user Industry
- 5.2.1. Paints and Coatings
- 5.2.2. Automobile
- 5.2.3. Infrastructure
- 5.2.4. Pharmaceutical
- 5.2.5. Other End-user Industries
- 5.3. Market Analysis, Insights and Forecast - by Region
- 5.3.1. Asia Pacific
- 5.3.2. North America
- 5.3.3. Europe
- 5.3.4. South America
- 5.3.5. Middle East and Africa
- 5.1. Market Analysis, Insights and Forecast - by Product Type
- 6. Global Bio-Ketones Industry Analysis, Insights and Forecast, 2021-2033
- 6.1. Market Analysis, Insights and Forecast - by Product Type
- 6.1.1. Bio MEK
- 6.1.2. Bio PEEK
- 6.1.3. Bio Acetone
- 6.1.4. Other Product Types
- 6.2. Market Analysis, Insights and Forecast - by End-user Industry
- 6.2.1. Paints and Coatings
- 6.2.2. Automobile
- 6.2.3. Infrastructure
- 6.2.4. Pharmaceutical
- 6.2.5. Other End-user Industries
- 6.1. Market Analysis, Insights and Forecast - by Product Type
- 7. Asia Pacific Bio-Ketones Industry Analysis, Insights and Forecast, 2020-2032
- 7.1. Market Analysis, Insights and Forecast - by Product Type
- 7.1.1. Bio MEK
- 7.1.2. Bio PEEK
- 7.1.3. Bio Acetone
- 7.1.4. Other Product Types
- 7.2. Market Analysis, Insights and Forecast - by End-user Industry
- 7.2.1. Paints and Coatings
- 7.2.2. Automobile
- 7.2.3. Infrastructure
- 7.2.4. Pharmaceutical
- 7.2.5. Other End-user Industries
- 7.1. Market Analysis, Insights and Forecast - by Product Type
- 8. North America Bio-Ketones Industry Analysis, Insights and Forecast, 2020-2032
- 8.1. Market Analysis, Insights and Forecast - by Product Type
- 8.1.1. Bio MEK
- 8.1.2. Bio PEEK
- 8.1.3. Bio Acetone
- 8.1.4. Other Product Types
- 8.2. Market Analysis, Insights and Forecast - by End-user Industry
- 8.2.1. Paints and Coatings
- 8.2.2. Automobile
- 8.2.3. Infrastructure
- 8.2.4. Pharmaceutical
- 8.2.5. Other End-user Industries
- 8.1. Market Analysis, Insights and Forecast - by Product Type
- 9. Europe Bio-Ketones Industry Analysis, Insights and Forecast, 2020-2032
- 9.1. Market Analysis, Insights and Forecast - by Product Type
- 9.1.1. Bio MEK
- 9.1.2. Bio PEEK
- 9.1.3. Bio Acetone
- 9.1.4. Other Product Types
- 9.2. Market Analysis, Insights and Forecast - by End-user Industry
- 9.2.1. Paints and Coatings
- 9.2.2. Automobile
- 9.2.3. Infrastructure
- 9.2.4. Pharmaceutical
- 9.2.5. Other End-user Industries
- 9.1. Market Analysis, Insights and Forecast - by Product Type
- 10. South America Bio-Ketones Industry Analysis, Insights and Forecast, 2020-2032
- 10.1. Market Analysis, Insights and Forecast - by Product Type
- 10.1.1. Bio MEK
- 10.1.2. Bio PEEK
- 10.1.3. Bio Acetone
- 10.1.4. Other Product Types
- 10.2. Market Analysis, Insights and Forecast - by End-user Industry
- 10.2.1. Paints and Coatings
- 10.2.2. Automobile
- 10.2.3. Infrastructure
- 10.2.4. Pharmaceutical
- 10.2.5. Other End-user Industries
- 10.1. Market Analysis, Insights and Forecast - by Product Type
- 11. Middle East and Africa Bio-Ketones Industry Analysis, Insights and Forecast, 2020-2032
- 11.1. Market Analysis, Insights and Forecast - by Product Type
- 11.1.1. Bio MEK
- 11.1.2. Bio PEEK
- 11.1.3. Bio Acetone
- 11.1.4. Other Product Types
- 11.2. Market Analysis, Insights and Forecast - by End-user Industry
- 11.2.1. Paints and Coatings
- 11.2.2. Automobile
- 11.2.3. Infrastructure
- 11.2.4. Pharmaceutical
- 11.2.5. Other End-user Industries
- 11.1. Market Analysis, Insights and Forecast - by Product Type
- 12. Competitive Analysis
- 12.1. Company Profiles
- 12.1.1 Bio Brands LLC
- 12.1.1.1. Company Overview
- 12.1.1.2. Products
- 12.1.1.3. Company Financials
- 12.1.1.4. SWOT Analysis
- 12.1.2 Caldic B V
- 12.1.2.1. Company Overview
- 12.1.2.2. Products
- 12.1.2.3. Company Financials
- 12.1.2.4. SWOT Analysis
- 12.1.3 Eastman Chemical Company
- 12.1.3.1. Company Overview
- 12.1.3.2. Products
- 12.1.3.3. Company Financials
- 12.1.3.4. SWOT Analysis
- 12.1.4 Fitz Chem LLC
- 12.1.4.1. Company Overview
- 12.1.4.2. Products
- 12.1.4.3. Company Financials
- 12.1.4.4. SWOT Analysis
- 12.1.5 Genomatica Inc
- 12.1.5.1. Company Overview
- 12.1.5.2. Products
- 12.1.5.3. Company Financials
- 12.1.5.4. SWOT Analysis
- 12.1.6 Green Biologics Limited
- 12.1.6.1. Company Overview
- 12.1.6.2. Products
- 12.1.6.3. Company Financials
- 12.1.6.4. SWOT Analysis
- 12.1.7 LANZATECH
- 12.1.7.1. Company Overview
- 12.1.7.2. Products
- 12.1.7.3. Company Financials
- 12.1.7.4. SWOT Analysis
- 12.1.8 Merck KGaA*List Not Exhaustive
- 12.1.8.1. Company Overview
- 12.1.8.2. Products
- 12.1.8.3. Company Financials
- 12.1.8.4. SWOT Analysis
- 12.1.1 Bio Brands LLC
- 12.2. Market Entropy
- 12.2.1 Company's Key Areas Served
- 12.2.2 Recent Developments
- 12.3. Company Market Share Analysis 2025
- 12.3.1 Top 5 Companies Market Share Analysis
- 12.3.2 Top 3 Companies Market Share Analysis
- 12.4. List of Potential Customers
- 13. Research Methodology
List of Figures
- Figure 1: Global Bio-Ketones Industry Revenue Breakdown (billion, %) by Region 2025 & 2033
- Figure 2: Asia Pacific Bio-Ketones Industry Revenue (billion), by Product Type 2025 & 2033
- Figure 3: Asia Pacific Bio-Ketones Industry Revenue Share (%), by Product Type 2025 & 2033
- Figure 4: Asia Pacific Bio-Ketones Industry Revenue (billion), by End-user Industry 2025 & 2033
- Figure 5: Asia Pacific Bio-Ketones Industry Revenue Share (%), by End-user Industry 2025 & 2033
- Figure 6: Asia Pacific Bio-Ketones Industry Revenue (billion), by Country 2025 & 2033
- Figure 7: Asia Pacific Bio-Ketones Industry Revenue Share (%), by Country 2025 & 2033
- Figure 8: North America Bio-Ketones Industry Revenue (billion), by Product Type 2025 & 2033
- Figure 9: North America Bio-Ketones Industry Revenue Share (%), by Product Type 2025 & 2033
- Figure 10: North America Bio-Ketones Industry Revenue (billion), by End-user Industry 2025 & 2033
- Figure 11: North America Bio-Ketones Industry Revenue Share (%), by End-user Industry 2025 & 2033
- Figure 12: North America Bio-Ketones Industry Revenue (billion), by Country 2025 & 2033
- Figure 13: North America Bio-Ketones Industry Revenue Share (%), by Country 2025 & 2033
- Figure 14: Europe Bio-Ketones Industry Revenue (billion), by Product Type 2025 & 2033
- Figure 15: Europe Bio-Ketones Industry Revenue Share (%), by Product Type 2025 & 2033
- Figure 16: Europe Bio-Ketones Industry Revenue (billion), by End-user Industry 2025 & 2033
- Figure 17: Europe Bio-Ketones Industry Revenue Share (%), by End-user Industry 2025 & 2033
- Figure 18: Europe Bio-Ketones Industry Revenue (billion), by Country 2025 & 2033
- Figure 19: Europe Bio-Ketones Industry Revenue Share (%), by Country 2025 & 2033
- Figure 20: South America Bio-Ketones Industry Revenue (billion), by Product Type 2025 & 2033
- Figure 21: South America Bio-Ketones Industry Revenue Share (%), by Product Type 2025 & 2033
- Figure 22: South America Bio-Ketones Industry Revenue (billion), by End-user Industry 2025 & 2033
- Figure 23: South America Bio-Ketones Industry Revenue Share (%), by End-user Industry 2025 & 2033
- Figure 24: South America Bio-Ketones Industry Revenue (billion), by Country 2025 & 2033
- Figure 25: South America Bio-Ketones Industry Revenue Share (%), by Country 2025 & 2033
- Figure 26: Middle East and Africa Bio-Ketones Industry Revenue (billion), by Product Type 2025 & 2033
- Figure 27: Middle East and Africa Bio-Ketones Industry Revenue Share (%), by Product Type 2025 & 2033
- Figure 28: Middle East and Africa Bio-Ketones Industry Revenue (billion), by End-user Industry 2025 & 2033
- Figure 29: Middle East and Africa Bio-Ketones Industry Revenue Share (%), by End-user Industry 2025 & 2033
- Figure 30: Middle East and Africa Bio-Ketones Industry Revenue (billion), by Country 2025 & 2033
- Figure 31: Middle East and Africa Bio-Ketones Industry Revenue Share (%), by Country 2025 & 2033
List of Tables
- Table 1: Global Bio-Ketones Industry Revenue billion Forecast, by Product Type 2020 & 2033
- Table 2: Global Bio-Ketones Industry Revenue billion Forecast, by End-user Industry 2020 & 2033
- Table 3: Global Bio-Ketones Industry Revenue billion Forecast, by Region 2020 & 2033
- Table 4: Global Bio-Ketones Industry Revenue billion Forecast, by Product Type 2020 & 2033
- Table 5: Global Bio-Ketones Industry Revenue billion Forecast, by End-user Industry 2020 & 2033
- Table 6: Global Bio-Ketones Industry Revenue billion Forecast, by Country 2020 & 2033
- Table 7: China Bio-Ketones Industry Revenue (billion) Forecast, by Application 2020 & 2033
- Table 8: India Bio-Ketones Industry Revenue (billion) Forecast, by Application 2020 & 2033
- Table 9: Japan Bio-Ketones Industry Revenue (billion) Forecast, by Application 2020 & 2033
- Table 10: South Korea Bio-Ketones Industry Revenue (billion) Forecast, by Application 2020 & 2033
- Table 11: ASEAN Countries Bio-Ketones Industry Revenue (billion) Forecast, by Application 2020 & 2033
- Table 12: Rest of Asia Pacific Bio-Ketones Industry Revenue (billion) Forecast, by Application 2020 & 2033
- Table 13: Global Bio-Ketones Industry Revenue billion Forecast, by Product Type 2020 & 2033
- Table 14: Global Bio-Ketones Industry Revenue billion Forecast, by End-user Industry 2020 & 2033
- Table 15: Global Bio-Ketones Industry Revenue billion Forecast, by Country 2020 & 2033
- Table 16: United States Bio-Ketones Industry Revenue (billion) Forecast, by Application 2020 & 2033
- Table 17: Canada Bio-Ketones Industry Revenue (billion) Forecast, by Application 2020 & 2033
- Table 18: Mexico Bio-Ketones Industry Revenue (billion) Forecast, by Application 2020 & 2033
- Table 19: Global Bio-Ketones Industry Revenue billion Forecast, by Product Type 2020 & 2033
- Table 20: Global Bio-Ketones Industry Revenue billion Forecast, by End-user Industry 2020 & 2033
- Table 21: Global Bio-Ketones Industry Revenue billion Forecast, by Country 2020 & 2033
- Table 22: Germany Bio-Ketones Industry Revenue (billion) Forecast, by Application 2020 & 2033
- Table 23: United Kingdom Bio-Ketones Industry Revenue (billion) Forecast, by Application 2020 & 2033
- Table 24: Italy Bio-Ketones Industry Revenue (billion) Forecast, by Application 2020 & 2033
- Table 25: France Bio-Ketones Industry Revenue (billion) Forecast, by Application 2020 & 2033
- Table 26: Rest of Europe Bio-Ketones Industry Revenue (billion) Forecast, by Application 2020 & 2033
- Table 27: Global Bio-Ketones Industry Revenue billion Forecast, by Product Type 2020 & 2033
- Table 28: Global Bio-Ketones Industry Revenue billion Forecast, by End-user Industry 2020 & 2033
- Table 29: Global Bio-Ketones Industry Revenue billion Forecast, by Country 2020 & 2033
- Table 30: Brazil Bio-Ketones Industry Revenue (billion) Forecast, by Application 2020 & 2033
- Table 31: Argentina Bio-Ketones Industry Revenue (billion) Forecast, by Application 2020 & 2033
- Table 32: Rest of South America Bio-Ketones Industry Revenue (billion) Forecast, by Application 2020 & 2033
- Table 33: Global Bio-Ketones Industry Revenue billion Forecast, by Product Type 2020 & 2033
- Table 34: Global Bio-Ketones Industry Revenue billion Forecast, by End-user Industry 2020 & 2033
- Table 35: Global Bio-Ketones Industry Revenue billion Forecast, by Country 2020 & 2033
- Table 36: Saudi Arabia Bio-Ketones Industry Revenue (billion) Forecast, by Application 2020 & 2033
- Table 37: South Africa Bio-Ketones Industry Revenue (billion) Forecast, by Application 2020 & 2033
- Table 38: Rest of Middle East and Africa Bio-Ketones Industry Revenue (billion) Forecast, by Application 2020 & 2033
Frequently Asked Questions
1. What is the projected Compound Annual Growth Rate (CAGR) of the Bio-Ketones Industry?
The projected CAGR is approximately 5.9%.
2. Which companies are prominent players in the Bio-Ketones Industry?
Key companies in the market include Bio Brands LLC, Caldic B V, Eastman Chemical Company, Fitz Chem LLC, Genomatica Inc, Green Biologics Limited, LANZATECH, Merck KGaA*List Not Exhaustive.
3. What are the main segments of the Bio-Ketones Industry?
The market segments include Product Type, End-user Industry.
4. Can you provide details about the market size?
The market size is estimated to be USD 24.25 billion as of 2022.
5. What are some drivers contributing to market growth?
; Increasing Demand from Cosmetics and Personal Care Industry; Supporting Government Regulations for the Use of Bio-products.
6. What are the notable trends driving market growth?
Bio PEEK to Dominate the Market.
7. Are there any restraints impacting market growth?
; Increasing Demand from Cosmetics and Personal Care Industry; Supporting Government Regulations for the Use of Bio-products.
8. Can you provide examples of recent developments in the market?
N/A
9. What pricing options are available for accessing the report?
Pricing options include single-user, multi-user, and enterprise licenses priced at USD 4750, USD 5250, and USD 8750 respectively.
10. Is the market size provided in terms of value or volume?
The market size is provided in terms of value, measured in billion.
11. Are there any specific market keywords associated with the report?
Yes, the market keyword associated with the report is "Bio-Ketones Industry," which aids in identifying and referencing the specific market segment covered.
12. How do I determine which pricing option suits my needs best?
The pricing options vary based on user requirements and access needs. Individual users may opt for single-user licenses, while businesses requiring broader access may choose multi-user or enterprise licenses for cost-effective access to the report.
13. Are there any additional resources or data provided in the Bio-Ketones Industry report?
While the report offers comprehensive insights, it's advisable to review the specific contents or supplementary materials provided to ascertain if additional resources or data are available.
14. How can I stay updated on further developments or reports in the Bio-Ketones Industry?
To stay informed about further developments, trends, and reports in the Bio-Ketones Industry, consider subscribing to industry newsletters, following relevant companies and organizations, or regularly checking reputable industry news sources and publications.
Methodology
Step 1 - Identification of Relevant Samples Size from Population Database


Step 2 - Approaches for Defining Global Market Size (Value, Volume* & Price*)

Note*: In applicable scenarios
Step 3 - Data Sources
Primary Research
- Web Analytics
- Survey Reports
- Research Institute
- Latest Research Reports
- Opinion Leaders
Secondary Research
- Annual Reports
- White Paper
- Latest Press Release
- Industry Association
- Paid Database
- Investor Presentations

Step 4 - Data Triangulation
Involves using different sources of information in order to increase the validity of a study
These sources are likely to be stakeholders in a program - participants, other researchers, program staff, other community members, and so on.
Then we put all data in single framework & apply various statistical tools to find out the dynamic on the market.
During the analysis stage, feedback from the stakeholder groups would be compared to determine areas of agreement as well as areas of divergence