

Key Insights
The global bioethanol market, valued at approximately $66.99 billion in 2025, is projected for substantial expansion. It is expected to grow at a Compound Annual Growth Rate (CAGR) of 11.7% from 2025 to 2033. This growth is fueled by increasing demand for sustainable energy solutions and governmental mandates to curb transportation-related carbon emissions. A heightened global awareness of environmental issues and the imperative for a sustainable economy are accelerating the adoption of bioethanol as a cleaner alternative to conventional fossil fuels. Bioethanol's broad utility extends beyond fuel applications, with significant uses in food and beverages, pharmaceuticals, and cosmetics, further underpinning market expansion. While challenges related to feedstock supply and price fluctuations persist, ongoing technological innovations in bioethanol production are enhancing efficiency and sustainability, thereby addressing these concerns. The market is dominated by sugarcane and corn feedstocks, with the automotive and transportation sector as the primary consumer.
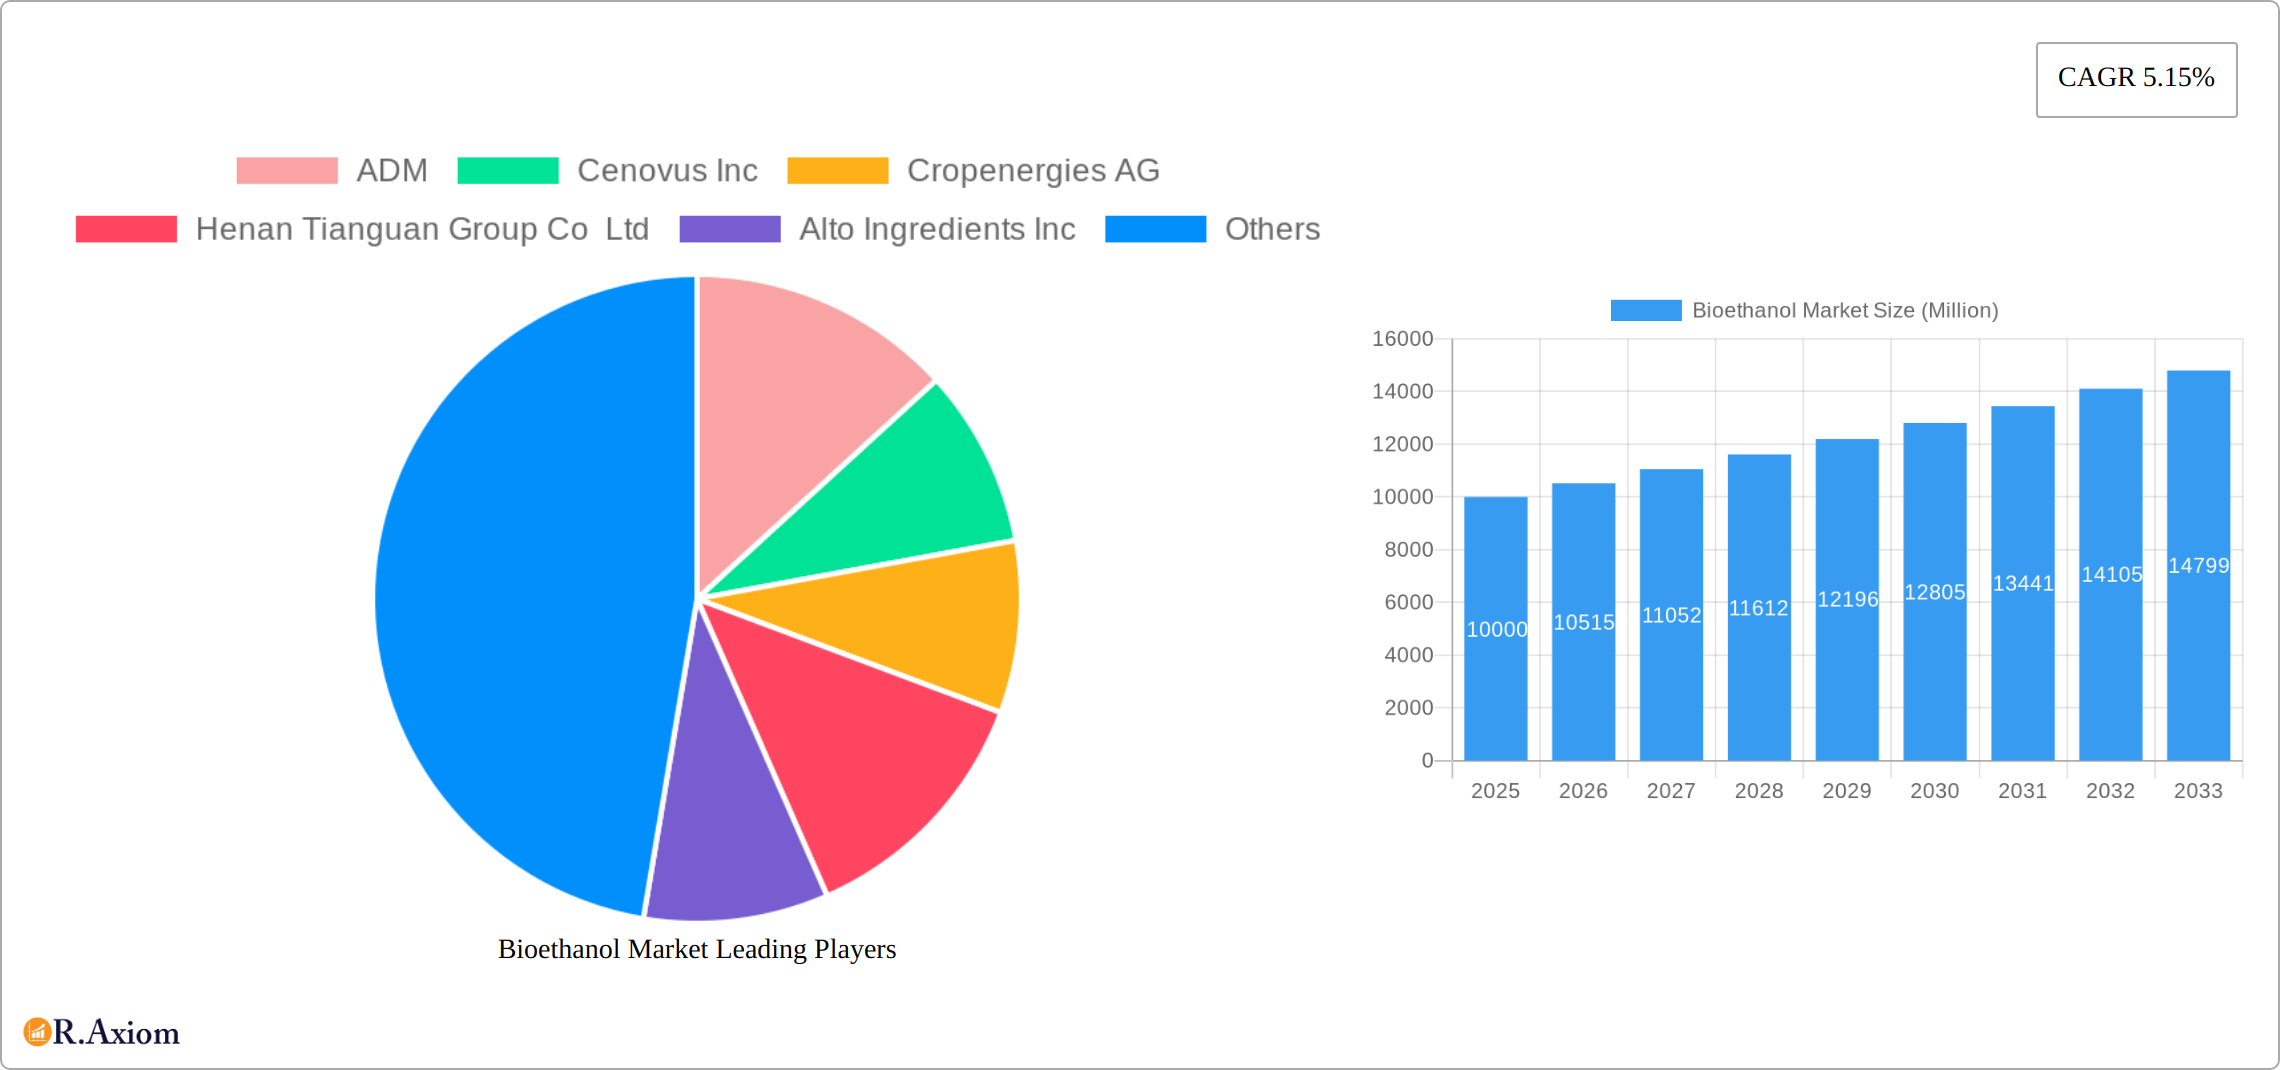
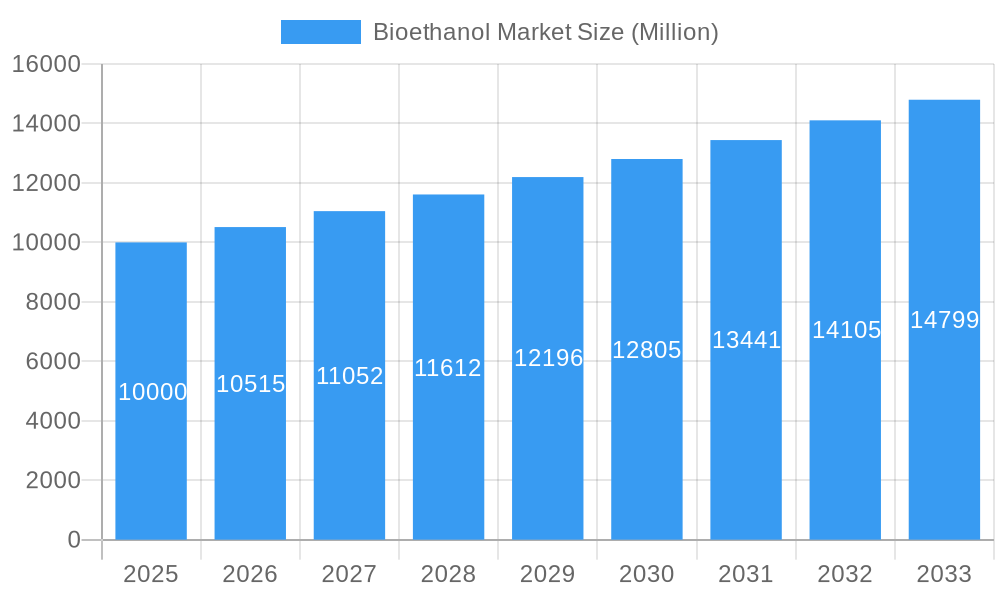
Bioethanol Market Market Size (In Billion)
Regional market dynamics will vary. North America, led by the United States, is anticipated to retain a significant market share owing to established biofuel policies and robust infrastructure. The Asia-Pacific region is set for robust growth, driven by escalating energy requirements and supportive government policies in key economies such as China and India. Europe, committed to sustainable development and ambitious renewable energy targets, will also witness considerable market expansion. Conversely, the Middle East and Africa may experience more moderate growth due to infrastructure limitations and the presence of alternative energy sources. The competitive environment features both established industry leaders like ADM and Valero, alongside emerging regional manufacturers, fostering a dynamic market characterized by continuous innovation and strategic consolidation. Technological advancements and evolving government regulations will intensify competition throughout the forecast period, significantly influencing the market's future direction.
Bioethanol Market Company Market Share
Bioethanol Market: A Comprehensive Report (2019-2033)
This detailed report provides a comprehensive analysis of the global bioethanol market, encompassing market size, growth drivers, challenges, key players, and future outlook. The study period covers 2019-2033, with 2025 as the base and estimated year. The report leverages extensive data analysis and industry insights to offer actionable strategies for stakeholders.
Bioethanol Market Concentration & Innovation
This section analyzes the competitive landscape of the bioethanol market, examining market concentration, innovation drivers, regulatory frameworks, product substitutes, end-user trends, and M&A activities. The market is moderately concentrated, with several key players holding significant shares, yet fostering an environment of continuous innovation and competition.
- Market Share: ADM, Green Plains Inc., and Raizen collectively hold an estimated xx% market share in 2025, reflecting their established production capacities and global reach. Smaller players contribute to the remaining share, creating a dynamic and fragmented market.
- Innovation Drivers: Growing demand for renewable fuels, stringent emission regulations, and advancements in feedstock utilization are key innovation drivers. Companies are investing heavily in R&D to improve efficiency, reduce costs, and explore new applications for bioethanol, such as sustainable aviation fuel (SAF).
- Regulatory Frameworks: Government policies promoting biofuel adoption, including subsidies and mandates, significantly influence market growth. However, variations in these policies across regions create complexities for businesses operating globally.
- Product Substitutes: Competition comes from other renewable fuels like biodiesel and other alternative energy sources. The relative cost-effectiveness and environmental impact of bioethanol compared to these substitutes are crucial factors influencing market share.
- End-User Trends: The automotive and transportation sector remains the dominant end-user segment, driven by increasing vehicle production and government mandates for biofuel blending. However, growing interest in bioethanol applications in food and beverage, pharmaceuticals, and cosmetics presents significant expansion opportunities.
- M&A Activities: The bioethanol industry has witnessed several mergers and acquisitions in recent years, driven by the need for consolidation, access to new technologies, and expansion into new markets. The total value of M&A deals in the sector during 2019-2024 was estimated at xx Million.
Bioethanol Market Industry Trends & Insights
The bioethanol market is experiencing robust growth, driven by several key factors. The Compound Annual Growth Rate (CAGR) is projected to be xx% during the forecast period (2025-2033). Market penetration is increasing steadily as governments worldwide strive to reduce greenhouse gas emissions and enhance energy security.
Technological advancements, including improved fermentation processes and the development of cellulosic ethanol technologies, are significantly boosting production efficiency and reducing costs. Consumer preference for environmentally friendly products is further fueling market demand. However, the bioethanol market faces challenges from fluctuating feedstock prices and competition from other renewable fuels. The competitive dynamics are characterized by continuous innovation, strategic partnerships, and capacity expansions.
Dominant Markets & Segments in Bioethanol Market
The global bioethanol market is geographically diverse, with significant variations in production and consumption patterns across regions.
Leading Regions/Countries: Brazil and the US are the leading producers and consumers of bioethanol, driven by favorable government policies, abundant feedstock resources (sugarcane in Brazil and corn in the US), and established infrastructure. Other regions, including the EU and Asia-Pacific, are also experiencing growth.
Dominant Feedstock Type: Corn is currently the dominant feedstock for bioethanol production globally, due to its widespread availability and relatively low cost. However, sugarcane is a significant feedstock in Brazil, and other feedstocks like wheat and various biomass sources are gaining traction, reflecting the industry's commitment to diversification.
Key Drivers (by Segment):
- Sugarcane: Favorable climatic conditions and government support in countries like Brazil are driving growth.
- Corn: Large-scale corn production in the US, coupled with established ethanol infrastructure, contributes to the dominance of this feedstock.
- Wheat: Wheat-based bioethanol is experiencing moderate growth, particularly in regions with high wheat production.
- Other Feedstock Types: Advancements in cellulosic ethanol technology are enabling the use of diverse biomass sources, including agricultural residues and dedicated energy crops, opening up new avenues for growth.
- Automotive and Transportation: The automotive sector is the primary driver, fueled by government mandates and consumer adoption of biofuel-blended gasoline.
- Food and Beverage: Bioethanol finds applications as a solvent and ingredient in various food and beverage products, supporting market expansion.
- Pharmaceutical & Cosmetics: Bioethanol serves as a solvent and ingredient in pharmaceuticals and cosmetics, representing a niche but growing segment.
The dominance analysis highlights the interplay of factors such as economic policies, infrastructure development, and feedstock availability in determining market leadership.
Bioethanol Market Product Developments
Recent advancements in bioethanol production are significantly impacting market dynamics. Focus areas include enhancing production efficiency, lowering costs, and expanding the range of bioethanol applications. Key innovations driving this progress include breakthroughs in fermentation technologies, the development of second-generation bioethanol from sustainable cellulosic feedstocks (like agricultural residues and dedicated energy crops), and the creation of novel bioethanol-based chemicals and materials. These improvements bolster the competitiveness of bioethanol producers, contributing to increased market share and profitability. Furthermore, research into advanced biofuel blends and optimized production processes promises further enhancements in the future.
Report Scope & Segmentation Analysis
This comprehensive report segments the bioethanol market based on feedstock type (Sugarcane, Corn, Wheat, and Other Feedstock Types) and application (Automotive and Transportation, Food and Beverage, Pharmaceutical, Cosmetics and Personal Care, and Other Applications). A detailed analysis of each segment is provided, including projected growth rates, market size estimations, and a competitive landscape assessment. The automotive and transportation sector is projected to experience the most substantial growth, fueled by the rising demand for renewable fuels and increasingly stringent emission regulations globally. Conversely, corn-based bioethanol currently dominates the market in terms of market share. The report meticulously analyzes each segment, factoring in current market size and future growth projections based on a variety of influential factors and market trends.
Key Drivers of Bioethanol Market Growth
The bioethanol market is experiencing robust growth driven by several key factors. The escalating global awareness of climate change and the urgent need for renewable energy sources are primary catalysts. Supportive government policies, including subsidies and biofuel blending mandates, play a crucial role in stimulating market expansion. Simultaneously, continuous technological advancements lead to increased production efficiency and reduced production costs, making bioethanol a more economically viable option. Finally, growing consumer preference for environmentally sustainable products further fuels market demand, creating a positive feedback loop.
Challenges in the Bioethanol Market Sector
Despite its considerable growth potential, the bioethanol market faces substantial challenges. Fluctuations in feedstock prices introduce significant uncertainty and directly impact profitability. Intense competition from other renewable fuels, as well as established fossil fuels, poses a considerable threat to market share. Moreover, regulatory hurdles and the necessity for substantial infrastructure investments can significantly hinder market expansion. The cumulative impact of these factors contributes to price volatility and the potential for reduced market growth projections.
Emerging Opportunities in Bioethanol Market
Despite existing challenges, the bioethanol market presents significant emerging opportunities. The development and deployment of advanced biofuels, particularly cellulosic ethanol, offer a pathway towards greater sustainability and reduced reliance on food crops for biofuel production. Expanding the applications of bioethanol into niche markets, including personal care and pharmaceuticals, presents exciting new revenue streams. Furthermore, ongoing innovations in feedstock conversion technologies are continuously paving the way for more cost-effective bioethanol production, enhancing its overall competitiveness and long-term sustainability.
Leading Players in the Bioethanol Market Market
- ADM
- Cenovus Inc
- Cropenergies AG
- Henan Tianguan Group Co Ltd
- Alto Ingredients Inc
- Green Plains Inc
- Suncor Energy Inc
- Valero
- Ethanol Technologies
- Verbio Vereinigte Bioenergie AG
- Abengoa
- Granbio Investimentos SA
- Sekab
- Blue Bio Fuels Inc
- Lantmannen
- Tereos
- Cristalco
- Poet LLC
- Jilin Fuel Ethanol Co Ltd
- Raizen
- KWST
Key Developments in Bioethanol Market Industry
- September 2022: CropEnergies AG acquired a stake in Syclus BV, a Dutch start-up producing renewable ethylene from renewable ethanol, signaling a move towards diversification in the bio-based chemicals market.
- May 2022: Blue Biofuels Inc. announced progress on its fifth-generation Cellulose-to-Sugar machine, indicating advancements in cellulosic ethanol technology.
- January 2023: United Airlines, Tallgrass, and Green Plains Inc. launched a joint venture with Blue Blade Energy to develop sustainable aviation fuel (SAF) using ethanol feedstock, highlighting the increasing demand for biofuels in the aviation sector. This development signifies a major market shift toward sustainable transportation fuels.
Strategic Outlook for Bioethanol Market Market
The future of the bioethanol market is promising, with continued growth driven by increased demand for renewable fuels and government support. Technological advancements will lead to greater efficiency and reduced production costs. Expansion into new applications and geographic markets will further fuel market growth. Companies strategically investing in R&D, expanding production capacity, and exploring strategic partnerships are well-positioned to capitalize on the market's growth potential. The market is anticipated to witness sustained growth in the coming years, with the potential for significant expansion in new sectors and geographies.
Bioethanol Market Segmentation
-
1. Feedstock Type
- 1.1. Sugarcane
- 1.2. Corn
- 1.3. Wheat
- 1.4. Other Feedstock Types
-
2. Application
- 2.1. Automotive and Transportation
- 2.2. Food and Beverage
- 2.3. Pharmaceutical
- 2.4. Cosmetics and Personal Care
- 2.5. Other Applications
Bioethanol Market Segmentation By Geography
-
1. Asia Pacific
- 1.1. China
- 1.2. India
- 1.3. Japan
- 1.4. South Korea
- 1.5. Rest of Asia Pacific
-
2. North America
- 2.1. United States
- 2.2. Canada
- 2.3. Mexico
-
3. Europe
- 3.1. Germany
- 3.2. United Kingdom
- 3.3. France
- 3.4. Italy
- 3.5. Rest of Europe
-
4. South America
- 4.1. Brazil
- 4.2. Argentina
- 4.3. Rest of South America
-
5. Middle East and Africa
- 5.1. Saudi Arabia
- 5.2. South Africa
- 5.3. Rest of Middle East and Africa
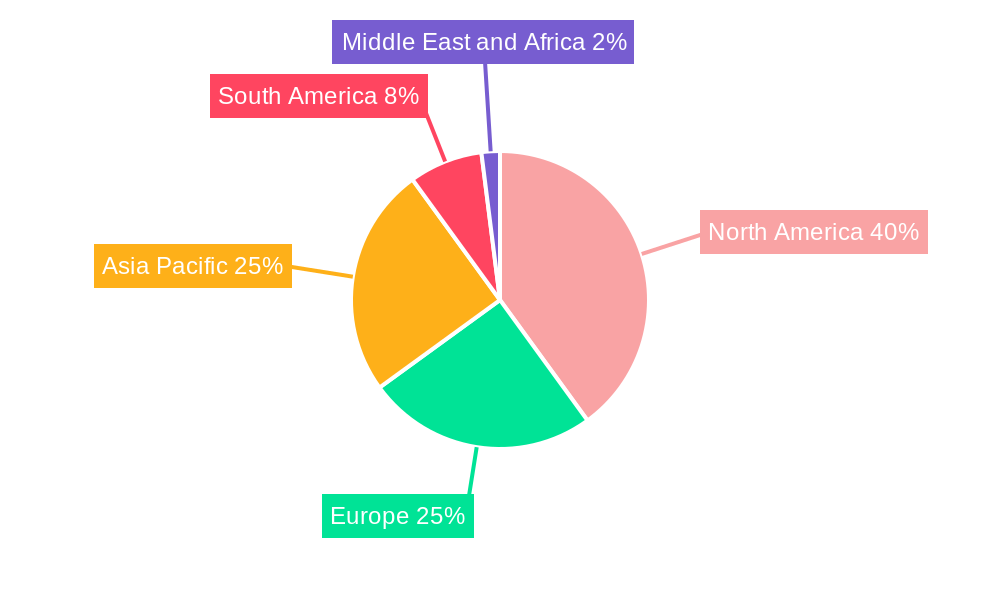
Bioethanol Market Regional Market Share
Geographic Coverage of Bioethanol Market
Bioethanol Market REPORT HIGHLIGHTS
| Aspects | Details |
|---|---|
| Study Period | 2020-2034 |
| Base Year | 2025 |
| Estimated Year | 2026 |
| Forecast Period | 2026-2034 |
| Historical Period | 2020-2025 |
| Growth Rate | CAGR of 11.7% from 2020-2034 |
| Segmentation |
|
Table of Contents
- 1. Introduction
- 1.1. Research Scope
- 1.2. Market Segmentation
- 1.3. Research Objective
- 1.4. Definitions and Assumptions
- 2. Executive Summary
- 2.1. Market Snapshot
- 3. Market Dynamics
- 3.1. Market Drivers
- 3.2. Market Restrains
- 3.3. Market Trends
- 3.4. Market Opportunities
- 4. Market Factor Analysis
- 4.1. Porters Five Forces
- 4.1.1. Bargaining Power of Suppliers
- 4.1.2. Bargaining Power of Buyers
- 4.1.3. Threat of New Entrants
- 4.1.4. Threat of Substitutes
- 4.1.5. Competitive Rivalry
- 4.2. PESTEL analysis
- 4.3. BCG Analysis
- 4.3.1. Stars (High Growth, High Market Share)
- 4.3.2. Cash Cows (Low Growth, High Market Share)
- 4.3.3. Question Mark (High Growth, Low Market Share)
- 4.3.4. Dogs (Low Growth, Low Market Share)
- 4.4. Ansoff Matrix Analysis
- 4.5. Supply Chain Analysis
- 4.6. Regulatory Landscape
- 4.7. Current Market Potential and Opportunity Assessment (TAM–SAM–SOM Framework)
- 4.8. RAX Analyst Note
- 4.1. Porters Five Forces
- 5. Market Analysis, Insights and Forecast 2021-2033
- 5.1. Market Analysis, Insights and Forecast - by Feedstock Type
- 5.1.1. Sugarcane
- 5.1.2. Corn
- 5.1.3. Wheat
- 5.1.4. Other Feedstock Types
- 5.2. Market Analysis, Insights and Forecast - by Application
- 5.2.1. Automotive and Transportation
- 5.2.2. Food and Beverage
- 5.2.3. Pharmaceutical
- 5.2.4. Cosmetics and Personal Care
- 5.2.5. Other Applications
- 5.3. Market Analysis, Insights and Forecast - by Region
- 5.3.1. Asia Pacific
- 5.3.2. North America
- 5.3.3. Europe
- 5.3.4. South America
- 5.3.5. Middle East and Africa
- 5.1. Market Analysis, Insights and Forecast - by Feedstock Type
- 6. Global Bioethanol Market Analysis, Insights and Forecast, 2021-2033
- 6.1. Market Analysis, Insights and Forecast - by Feedstock Type
- 6.1.1. Sugarcane
- 6.1.2. Corn
- 6.1.3. Wheat
- 6.1.4. Other Feedstock Types
- 6.2. Market Analysis, Insights and Forecast - by Application
- 6.2.1. Automotive and Transportation
- 6.2.2. Food and Beverage
- 6.2.3. Pharmaceutical
- 6.2.4. Cosmetics and Personal Care
- 6.2.5. Other Applications
- 6.1. Market Analysis, Insights and Forecast - by Feedstock Type
- 7. Asia Pacific Bioethanol Market Analysis, Insights and Forecast, 2020-2032
- 7.1. Market Analysis, Insights and Forecast - by Feedstock Type
- 7.1.1. Sugarcane
- 7.1.2. Corn
- 7.1.3. Wheat
- 7.1.4. Other Feedstock Types
- 7.2. Market Analysis, Insights and Forecast - by Application
- 7.2.1. Automotive and Transportation
- 7.2.2. Food and Beverage
- 7.2.3. Pharmaceutical
- 7.2.4. Cosmetics and Personal Care
- 7.2.5. Other Applications
- 7.1. Market Analysis, Insights and Forecast - by Feedstock Type
- 8. North America Bioethanol Market Analysis, Insights and Forecast, 2020-2032
- 8.1. Market Analysis, Insights and Forecast - by Feedstock Type
- 8.1.1. Sugarcane
- 8.1.2. Corn
- 8.1.3. Wheat
- 8.1.4. Other Feedstock Types
- 8.2. Market Analysis, Insights and Forecast - by Application
- 8.2.1. Automotive and Transportation
- 8.2.2. Food and Beverage
- 8.2.3. Pharmaceutical
- 8.2.4. Cosmetics and Personal Care
- 8.2.5. Other Applications
- 8.1. Market Analysis, Insights and Forecast - by Feedstock Type
- 9. Europe Bioethanol Market Analysis, Insights and Forecast, 2020-2032
- 9.1. Market Analysis, Insights and Forecast - by Feedstock Type
- 9.1.1. Sugarcane
- 9.1.2. Corn
- 9.1.3. Wheat
- 9.1.4. Other Feedstock Types
- 9.2. Market Analysis, Insights and Forecast - by Application
- 9.2.1. Automotive and Transportation
- 9.2.2. Food and Beverage
- 9.2.3. Pharmaceutical
- 9.2.4. Cosmetics and Personal Care
- 9.2.5. Other Applications
- 9.1. Market Analysis, Insights and Forecast - by Feedstock Type
- 10. South America Bioethanol Market Analysis, Insights and Forecast, 2020-2032
- 10.1. Market Analysis, Insights and Forecast - by Feedstock Type
- 10.1.1. Sugarcane
- 10.1.2. Corn
- 10.1.3. Wheat
- 10.1.4. Other Feedstock Types
- 10.2. Market Analysis, Insights and Forecast - by Application
- 10.2.1. Automotive and Transportation
- 10.2.2. Food and Beverage
- 10.2.3. Pharmaceutical
- 10.2.4. Cosmetics and Personal Care
- 10.2.5. Other Applications
- 10.1. Market Analysis, Insights and Forecast - by Feedstock Type
- 11. Middle East and Africa Bioethanol Market Analysis, Insights and Forecast, 2020-2032
- 11.1. Market Analysis, Insights and Forecast - by Feedstock Type
- 11.1.1. Sugarcane
- 11.1.2. Corn
- 11.1.3. Wheat
- 11.1.4. Other Feedstock Types
- 11.2. Market Analysis, Insights and Forecast - by Application
- 11.2.1. Automotive and Transportation
- 11.2.2. Food and Beverage
- 11.2.3. Pharmaceutical
- 11.2.4. Cosmetics and Personal Care
- 11.2.5. Other Applications
- 11.1. Market Analysis, Insights and Forecast - by Feedstock Type
- 12. Competitive Analysis
- 12.1. Company Profiles
- 12.1.1 ADM
- 12.1.1.1. Company Overview
- 12.1.1.2. Products
- 12.1.1.3. Company Financials
- 12.1.1.4. SWOT Analysis
- 12.1.2 Cenovus Inc
- 12.1.2.1. Company Overview
- 12.1.2.2. Products
- 12.1.2.3. Company Financials
- 12.1.2.4. SWOT Analysis
- 12.1.3 Cropenergies AG
- 12.1.3.1. Company Overview
- 12.1.3.2. Products
- 12.1.3.3. Company Financials
- 12.1.3.4. SWOT Analysis
- 12.1.4 Henan Tianguan Group Co Ltd
- 12.1.4.1. Company Overview
- 12.1.4.2. Products
- 12.1.4.3. Company Financials
- 12.1.4.4. SWOT Analysis
- 12.1.5 Alto Ingredients Inc
- 12.1.5.1. Company Overview
- 12.1.5.2. Products
- 12.1.5.3. Company Financials
- 12.1.5.4. SWOT Analysis
- 12.1.6 Green Plains Inc
- 12.1.6.1. Company Overview
- 12.1.6.2. Products
- 12.1.6.3. Company Financials
- 12.1.6.4. SWOT Analysis
- 12.1.7 Suncor Energy Inc
- 12.1.7.1. Company Overview
- 12.1.7.2. Products
- 12.1.7.3. Company Financials
- 12.1.7.4. SWOT Analysis
- 12.1.8 Valero
- 12.1.8.1. Company Overview
- 12.1.8.2. Products
- 12.1.8.3. Company Financials
- 12.1.8.4. SWOT Analysis
- 12.1.9 Ethanol Technologies
- 12.1.9.1. Company Overview
- 12.1.9.2. Products
- 12.1.9.3. Company Financials
- 12.1.9.4. SWOT Analysis
- 12.1.10 Verbio Vereinigte Bioenergie AG*List Not Exhaustive
- 12.1.10.1. Company Overview
- 12.1.10.2. Products
- 12.1.10.3. Company Financials
- 12.1.10.4. SWOT Analysis
- 12.1.11 Abengoa
- 12.1.11.1. Company Overview
- 12.1.11.2. Products
- 12.1.11.3. Company Financials
- 12.1.11.4. SWOT Analysis
- 12.1.12 Granbio Investimentos SA
- 12.1.12.1. Company Overview
- 12.1.12.2. Products
- 12.1.12.3. Company Financials
- 12.1.12.4. SWOT Analysis
- 12.1.13 Sekab
- 12.1.13.1. Company Overview
- 12.1.13.2. Products
- 12.1.13.3. Company Financials
- 12.1.13.4. SWOT Analysis
- 12.1.14 Blue Bio Fuels Inc
- 12.1.14.1. Company Overview
- 12.1.14.2. Products
- 12.1.14.3. Company Financials
- 12.1.14.4. SWOT Analysis
- 12.1.15 Lantmannen
- 12.1.15.1. Company Overview
- 12.1.15.2. Products
- 12.1.15.3. Company Financials
- 12.1.15.4. SWOT Analysis
- 12.1.16 Tereos
- 12.1.16.1. Company Overview
- 12.1.16.2. Products
- 12.1.16.3. Company Financials
- 12.1.16.4. SWOT Analysis
- 12.1.17 Cristalco
- 12.1.17.1. Company Overview
- 12.1.17.2. Products
- 12.1.17.3. Company Financials
- 12.1.17.4. SWOT Analysis
- 12.1.18 Poet LLC
- 12.1.18.1. Company Overview
- 12.1.18.2. Products
- 12.1.18.3. Company Financials
- 12.1.18.4. SWOT Analysis
- 12.1.19 Jilin Fuel Ethanol Co Ltd
- 12.1.19.1. Company Overview
- 12.1.19.2. Products
- 12.1.19.3. Company Financials
- 12.1.19.4. SWOT Analysis
- 12.1.20 Raizen
- 12.1.20.1. Company Overview
- 12.1.20.2. Products
- 12.1.20.3. Company Financials
- 12.1.20.4. SWOT Analysis
- 12.1.21 KWST
- 12.1.21.1. Company Overview
- 12.1.21.2. Products
- 12.1.21.3. Company Financials
- 12.1.21.4. SWOT Analysis
- 12.1.1 ADM
- 12.2. Market Entropy
- 12.2.1 Company's Key Areas Served
- 12.2.2 Recent Developments
- 12.3. Company Market Share Analysis 2025
- 12.3.1 Top 5 Companies Market Share Analysis
- 12.3.2 Top 3 Companies Market Share Analysis
- 12.4. List of Potential Customers
- 13. Research Methodology
List of Figures
- Figure 1: Global Bioethanol Market Revenue Breakdown (billion, %) by Region 2025 & 2033
- Figure 2: Global Bioethanol Market Volume Breakdown (Billion, %) by Region 2025 & 2033
- Figure 3: Asia Pacific Bioethanol Market Revenue (billion), by Feedstock Type 2025 & 2033
- Figure 4: Asia Pacific Bioethanol Market Volume (Billion), by Feedstock Type 2025 & 2033
- Figure 5: Asia Pacific Bioethanol Market Revenue Share (%), by Feedstock Type 2025 & 2033
- Figure 6: Asia Pacific Bioethanol Market Volume Share (%), by Feedstock Type 2025 & 2033
- Figure 7: Asia Pacific Bioethanol Market Revenue (billion), by Application 2025 & 2033
- Figure 8: Asia Pacific Bioethanol Market Volume (Billion), by Application 2025 & 2033
- Figure 9: Asia Pacific Bioethanol Market Revenue Share (%), by Application 2025 & 2033
- Figure 10: Asia Pacific Bioethanol Market Volume Share (%), by Application 2025 & 2033
- Figure 11: Asia Pacific Bioethanol Market Revenue (billion), by Country 2025 & 2033
- Figure 12: Asia Pacific Bioethanol Market Volume (Billion), by Country 2025 & 2033
- Figure 13: Asia Pacific Bioethanol Market Revenue Share (%), by Country 2025 & 2033
- Figure 14: Asia Pacific Bioethanol Market Volume Share (%), by Country 2025 & 2033
- Figure 15: North America Bioethanol Market Revenue (billion), by Feedstock Type 2025 & 2033
- Figure 16: North America Bioethanol Market Volume (Billion), by Feedstock Type 2025 & 2033
- Figure 17: North America Bioethanol Market Revenue Share (%), by Feedstock Type 2025 & 2033
- Figure 18: North America Bioethanol Market Volume Share (%), by Feedstock Type 2025 & 2033
- Figure 19: North America Bioethanol Market Revenue (billion), by Application 2025 & 2033
- Figure 20: North America Bioethanol Market Volume (Billion), by Application 2025 & 2033
- Figure 21: North America Bioethanol Market Revenue Share (%), by Application 2025 & 2033
- Figure 22: North America Bioethanol Market Volume Share (%), by Application 2025 & 2033
- Figure 23: North America Bioethanol Market Revenue (billion), by Country 2025 & 2033
- Figure 24: North America Bioethanol Market Volume (Billion), by Country 2025 & 2033
- Figure 25: North America Bioethanol Market Revenue Share (%), by Country 2025 & 2033
- Figure 26: North America Bioethanol Market Volume Share (%), by Country 2025 & 2033
- Figure 27: Europe Bioethanol Market Revenue (billion), by Feedstock Type 2025 & 2033
- Figure 28: Europe Bioethanol Market Volume (Billion), by Feedstock Type 2025 & 2033
- Figure 29: Europe Bioethanol Market Revenue Share (%), by Feedstock Type 2025 & 2033
- Figure 30: Europe Bioethanol Market Volume Share (%), by Feedstock Type 2025 & 2033
- Figure 31: Europe Bioethanol Market Revenue (billion), by Application 2025 & 2033
- Figure 32: Europe Bioethanol Market Volume (Billion), by Application 2025 & 2033
- Figure 33: Europe Bioethanol Market Revenue Share (%), by Application 2025 & 2033
- Figure 34: Europe Bioethanol Market Volume Share (%), by Application 2025 & 2033
- Figure 35: Europe Bioethanol Market Revenue (billion), by Country 2025 & 2033
- Figure 36: Europe Bioethanol Market Volume (Billion), by Country 2025 & 2033
- Figure 37: Europe Bioethanol Market Revenue Share (%), by Country 2025 & 2033
- Figure 38: Europe Bioethanol Market Volume Share (%), by Country 2025 & 2033
- Figure 39: South America Bioethanol Market Revenue (billion), by Feedstock Type 2025 & 2033
- Figure 40: South America Bioethanol Market Volume (Billion), by Feedstock Type 2025 & 2033
- Figure 41: South America Bioethanol Market Revenue Share (%), by Feedstock Type 2025 & 2033
- Figure 42: South America Bioethanol Market Volume Share (%), by Feedstock Type 2025 & 2033
- Figure 43: South America Bioethanol Market Revenue (billion), by Application 2025 & 2033
- Figure 44: South America Bioethanol Market Volume (Billion), by Application 2025 & 2033
- Figure 45: South America Bioethanol Market Revenue Share (%), by Application 2025 & 2033
- Figure 46: South America Bioethanol Market Volume Share (%), by Application 2025 & 2033
- Figure 47: South America Bioethanol Market Revenue (billion), by Country 2025 & 2033
- Figure 48: South America Bioethanol Market Volume (Billion), by Country 2025 & 2033
- Figure 49: South America Bioethanol Market Revenue Share (%), by Country 2025 & 2033
- Figure 50: South America Bioethanol Market Volume Share (%), by Country 2025 & 2033
- Figure 51: Middle East and Africa Bioethanol Market Revenue (billion), by Feedstock Type 2025 & 2033
- Figure 52: Middle East and Africa Bioethanol Market Volume (Billion), by Feedstock Type 2025 & 2033
- Figure 53: Middle East and Africa Bioethanol Market Revenue Share (%), by Feedstock Type 2025 & 2033
- Figure 54: Middle East and Africa Bioethanol Market Volume Share (%), by Feedstock Type 2025 & 2033
- Figure 55: Middle East and Africa Bioethanol Market Revenue (billion), by Application 2025 & 2033
- Figure 56: Middle East and Africa Bioethanol Market Volume (Billion), by Application 2025 & 2033
- Figure 57: Middle East and Africa Bioethanol Market Revenue Share (%), by Application 2025 & 2033
- Figure 58: Middle East and Africa Bioethanol Market Volume Share (%), by Application 2025 & 2033
- Figure 59: Middle East and Africa Bioethanol Market Revenue (billion), by Country 2025 & 2033
- Figure 60: Middle East and Africa Bioethanol Market Volume (Billion), by Country 2025 & 2033
- Figure 61: Middle East and Africa Bioethanol Market Revenue Share (%), by Country 2025 & 2033
- Figure 62: Middle East and Africa Bioethanol Market Volume Share (%), by Country 2025 & 2033
List of Tables
- Table 1: Global Bioethanol Market Revenue billion Forecast, by Feedstock Type 2020 & 2033
- Table 2: Global Bioethanol Market Volume Billion Forecast, by Feedstock Type 2020 & 2033
- Table 3: Global Bioethanol Market Revenue billion Forecast, by Application 2020 & 2033
- Table 4: Global Bioethanol Market Volume Billion Forecast, by Application 2020 & 2033
- Table 5: Global Bioethanol Market Revenue billion Forecast, by Region 2020 & 2033
- Table 6: Global Bioethanol Market Volume Billion Forecast, by Region 2020 & 2033
- Table 7: Global Bioethanol Market Revenue billion Forecast, by Feedstock Type 2020 & 2033
- Table 8: Global Bioethanol Market Volume Billion Forecast, by Feedstock Type 2020 & 2033
- Table 9: Global Bioethanol Market Revenue billion Forecast, by Application 2020 & 2033
- Table 10: Global Bioethanol Market Volume Billion Forecast, by Application 2020 & 2033
- Table 11: Global Bioethanol Market Revenue billion Forecast, by Country 2020 & 2033
- Table 12: Global Bioethanol Market Volume Billion Forecast, by Country 2020 & 2033
- Table 13: China Bioethanol Market Revenue (billion) Forecast, by Application 2020 & 2033
- Table 14: China Bioethanol Market Volume (Billion) Forecast, by Application 2020 & 2033
- Table 15: India Bioethanol Market Revenue (billion) Forecast, by Application 2020 & 2033
- Table 16: India Bioethanol Market Volume (Billion) Forecast, by Application 2020 & 2033
- Table 17: Japan Bioethanol Market Revenue (billion) Forecast, by Application 2020 & 2033
- Table 18: Japan Bioethanol Market Volume (Billion) Forecast, by Application 2020 & 2033
- Table 19: South Korea Bioethanol Market Revenue (billion) Forecast, by Application 2020 & 2033
- Table 20: South Korea Bioethanol Market Volume (Billion) Forecast, by Application 2020 & 2033
- Table 21: Rest of Asia Pacific Bioethanol Market Revenue (billion) Forecast, by Application 2020 & 2033
- Table 22: Rest of Asia Pacific Bioethanol Market Volume (Billion) Forecast, by Application 2020 & 2033
- Table 23: Global Bioethanol Market Revenue billion Forecast, by Feedstock Type 2020 & 2033
- Table 24: Global Bioethanol Market Volume Billion Forecast, by Feedstock Type 2020 & 2033
- Table 25: Global Bioethanol Market Revenue billion Forecast, by Application 2020 & 2033
- Table 26: Global Bioethanol Market Volume Billion Forecast, by Application 2020 & 2033
- Table 27: Global Bioethanol Market Revenue billion Forecast, by Country 2020 & 2033
- Table 28: Global Bioethanol Market Volume Billion Forecast, by Country 2020 & 2033
- Table 29: United States Bioethanol Market Revenue (billion) Forecast, by Application 2020 & 2033
- Table 30: United States Bioethanol Market Volume (Billion) Forecast, by Application 2020 & 2033
- Table 31: Canada Bioethanol Market Revenue (billion) Forecast, by Application 2020 & 2033
- Table 32: Canada Bioethanol Market Volume (Billion) Forecast, by Application 2020 & 2033
- Table 33: Mexico Bioethanol Market Revenue (billion) Forecast, by Application 2020 & 2033
- Table 34: Mexico Bioethanol Market Volume (Billion) Forecast, by Application 2020 & 2033
- Table 35: Global Bioethanol Market Revenue billion Forecast, by Feedstock Type 2020 & 2033
- Table 36: Global Bioethanol Market Volume Billion Forecast, by Feedstock Type 2020 & 2033
- Table 37: Global Bioethanol Market Revenue billion Forecast, by Application 2020 & 2033
- Table 38: Global Bioethanol Market Volume Billion Forecast, by Application 2020 & 2033
- Table 39: Global Bioethanol Market Revenue billion Forecast, by Country 2020 & 2033
- Table 40: Global Bioethanol Market Volume Billion Forecast, by Country 2020 & 2033
- Table 41: Germany Bioethanol Market Revenue (billion) Forecast, by Application 2020 & 2033
- Table 42: Germany Bioethanol Market Volume (Billion) Forecast, by Application 2020 & 2033
- Table 43: United Kingdom Bioethanol Market Revenue (billion) Forecast, by Application 2020 & 2033
- Table 44: United Kingdom Bioethanol Market Volume (Billion) Forecast, by Application 2020 & 2033
- Table 45: France Bioethanol Market Revenue (billion) Forecast, by Application 2020 & 2033
- Table 46: France Bioethanol Market Volume (Billion) Forecast, by Application 2020 & 2033
- Table 47: Italy Bioethanol Market Revenue (billion) Forecast, by Application 2020 & 2033
- Table 48: Italy Bioethanol Market Volume (Billion) Forecast, by Application 2020 & 2033
- Table 49: Rest of Europe Bioethanol Market Revenue (billion) Forecast, by Application 2020 & 2033
- Table 50: Rest of Europe Bioethanol Market Volume (Billion) Forecast, by Application 2020 & 2033
- Table 51: Global Bioethanol Market Revenue billion Forecast, by Feedstock Type 2020 & 2033
- Table 52: Global Bioethanol Market Volume Billion Forecast, by Feedstock Type 2020 & 2033
- Table 53: Global Bioethanol Market Revenue billion Forecast, by Application 2020 & 2033
- Table 54: Global Bioethanol Market Volume Billion Forecast, by Application 2020 & 2033
- Table 55: Global Bioethanol Market Revenue billion Forecast, by Country 2020 & 2033
- Table 56: Global Bioethanol Market Volume Billion Forecast, by Country 2020 & 2033
- Table 57: Brazil Bioethanol Market Revenue (billion) Forecast, by Application 2020 & 2033
- Table 58: Brazil Bioethanol Market Volume (Billion) Forecast, by Application 2020 & 2033
- Table 59: Argentina Bioethanol Market Revenue (billion) Forecast, by Application 2020 & 2033
- Table 60: Argentina Bioethanol Market Volume (Billion) Forecast, by Application 2020 & 2033
- Table 61: Rest of South America Bioethanol Market Revenue (billion) Forecast, by Application 2020 & 2033
- Table 62: Rest of South America Bioethanol Market Volume (Billion) Forecast, by Application 2020 & 2033
- Table 63: Global Bioethanol Market Revenue billion Forecast, by Feedstock Type 2020 & 2033
- Table 64: Global Bioethanol Market Volume Billion Forecast, by Feedstock Type 2020 & 2033
- Table 65: Global Bioethanol Market Revenue billion Forecast, by Application 2020 & 2033
- Table 66: Global Bioethanol Market Volume Billion Forecast, by Application 2020 & 2033
- Table 67: Global Bioethanol Market Revenue billion Forecast, by Country 2020 & 2033
- Table 68: Global Bioethanol Market Volume Billion Forecast, by Country 2020 & 2033
- Table 69: Saudi Arabia Bioethanol Market Revenue (billion) Forecast, by Application 2020 & 2033
- Table 70: Saudi Arabia Bioethanol Market Volume (Billion) Forecast, by Application 2020 & 2033
- Table 71: South Africa Bioethanol Market Revenue (billion) Forecast, by Application 2020 & 2033
- Table 72: South Africa Bioethanol Market Volume (Billion) Forecast, by Application 2020 & 2033
- Table 73: Rest of Middle East and Africa Bioethanol Market Revenue (billion) Forecast, by Application 2020 & 2033
- Table 74: Rest of Middle East and Africa Bioethanol Market Volume (Billion) Forecast, by Application 2020 & 2033
Frequently Asked Questions
1. What is the projected Compound Annual Growth Rate (CAGR) of the Bioethanol Market?
The projected CAGR is approximately 11.7%.
2. Which companies are prominent players in the Bioethanol Market?
Key companies in the market include ADM, Cenovus Inc, Cropenergies AG, Henan Tianguan Group Co Ltd, Alto Ingredients Inc, Green Plains Inc, Suncor Energy Inc, Valero, Ethanol Technologies, Verbio Vereinigte Bioenergie AG*List Not Exhaustive, Abengoa, Granbio Investimentos SA, Sekab, Blue Bio Fuels Inc, Lantmannen, Tereos, Cristalco, Poet LLC, Jilin Fuel Ethanol Co Ltd, Raizen, KWST.
3. What are the main segments of the Bioethanol Market?
The market segments include Feedstock Type, Application.
4. Can you provide details about the market size?
The market size is estimated to be USD 66.99 billion as of 2022.
5. What are some drivers contributing to market growth?
Increasing Favorable Initiatives and Blending Mandates by Regulatory Bodies; Rising Environmental Concerns by the Use of Fossil Fuels and Need for the Bio-fuels.
6. What are the notable trends driving market growth?
Increasing Usage in the Automotive and Transportation Sector.
7. Are there any restraints impacting market growth?
Phasing out of Fuel-based Vehicles Due to Rising Demand for Electric Vehicles; Shifting Focus to Bio-butanol.
8. Can you provide examples of recent developments in the market?
January 2023: United Airlines, Tallgrass, and Green Plains Inc. announced a joint venture with Blue Blade Energy to develop and commercialize a novel Sustainable Aviation Fuel (SAF) technology that uses ethanol feedstock.
9. What pricing options are available for accessing the report?
Pricing options include single-user, multi-user, and enterprise licenses priced at USD 4750, USD 5250, and USD 8750 respectively.
10. Is the market size provided in terms of value or volume?
The market size is provided in terms of value, measured in billion and volume, measured in Billion.
11. Are there any specific market keywords associated with the report?
Yes, the market keyword associated with the report is "Bioethanol Market," which aids in identifying and referencing the specific market segment covered.
12. How do I determine which pricing option suits my needs best?
The pricing options vary based on user requirements and access needs. Individual users may opt for single-user licenses, while businesses requiring broader access may choose multi-user or enterprise licenses for cost-effective access to the report.
13. Are there any additional resources or data provided in the Bioethanol Market report?
While the report offers comprehensive insights, it's advisable to review the specific contents or supplementary materials provided to ascertain if additional resources or data are available.
14. How can I stay updated on further developments or reports in the Bioethanol Market?
To stay informed about further developments, trends, and reports in the Bioethanol Market, consider subscribing to industry newsletters, following relevant companies and organizations, or regularly checking reputable industry news sources and publications.
Methodology
Step 1 - Identification of Relevant Samples Size from Population Database


Step 2 - Approaches for Defining Global Market Size (Value, Volume* & Price*)

Note*: In applicable scenarios
Step 3 - Data Sources
Primary Research
- Web Analytics
- Survey Reports
- Research Institute
- Latest Research Reports
- Opinion Leaders
Secondary Research
- Annual Reports
- White Paper
- Latest Press Release
- Industry Association
- Paid Database
- Investor Presentations

Step 4 - Data Triangulation
Involves using different sources of information in order to increase the validity of a study
These sources are likely to be stakeholders in a program - participants, other researchers, program staff, other community members, and so on.
Then we put all data in single framework & apply various statistical tools to find out the dynamic on the market.
During the analysis stage, feedback from the stakeholder groups would be compared to determine areas of agreement as well as areas of divergence